Photonics Research, 2020, 8 (7): 07001226, Published Online: Jun. 30, 2020  

Plasmonic resonance-linewidth shrinkage to boost biosensing Download: 706次

Author Affiliations
1 Department of Physics, Collaborative Innovation Center for Optoelectronic Semiconductors and Efficient Devices, Jiujiang Research Institute, Xiamen University, Xiamen 361005, China
2 Institute of Electromagnetics and Acoustics, Xiamen University, Xiamen 361005, China
3 College of Physics Science and Technology, Xinjiang University, Urumqi 830046, China
4 The First Affiliated Hospital of Xiamen University, Xiamen 361003, China
5 e-mail: nanoantenna@hotmail.com
6 e-mail: zlyang@xmu.edu.cn
Figures & Tables

Fig. 1. Two-dimensional gold nanohole arrays supporting SPP modes fabricated by the nanoimprint lithography method. (a) Schematic illustration of the optical measurement configuration. (b) Definitions of incident angle θ, azimuthal angle φ, and polarization (p or s), respectively. Inset: (top) SEM images of the array with cross-sectional and top views; (bottom) photographic images of the array under different visual angles. Scale bars denote 500 nm and 1 cm for SEM and photographic images, respectively. (c) Experimentally measured reflectance spectra as a function of incident angles from 0° to 75°. The azimuthal angle is set as φ=0°. (d) Dependence of FWHM on (1, 0) SPP mode achieved at different incident angles.

下载图片 查看原文

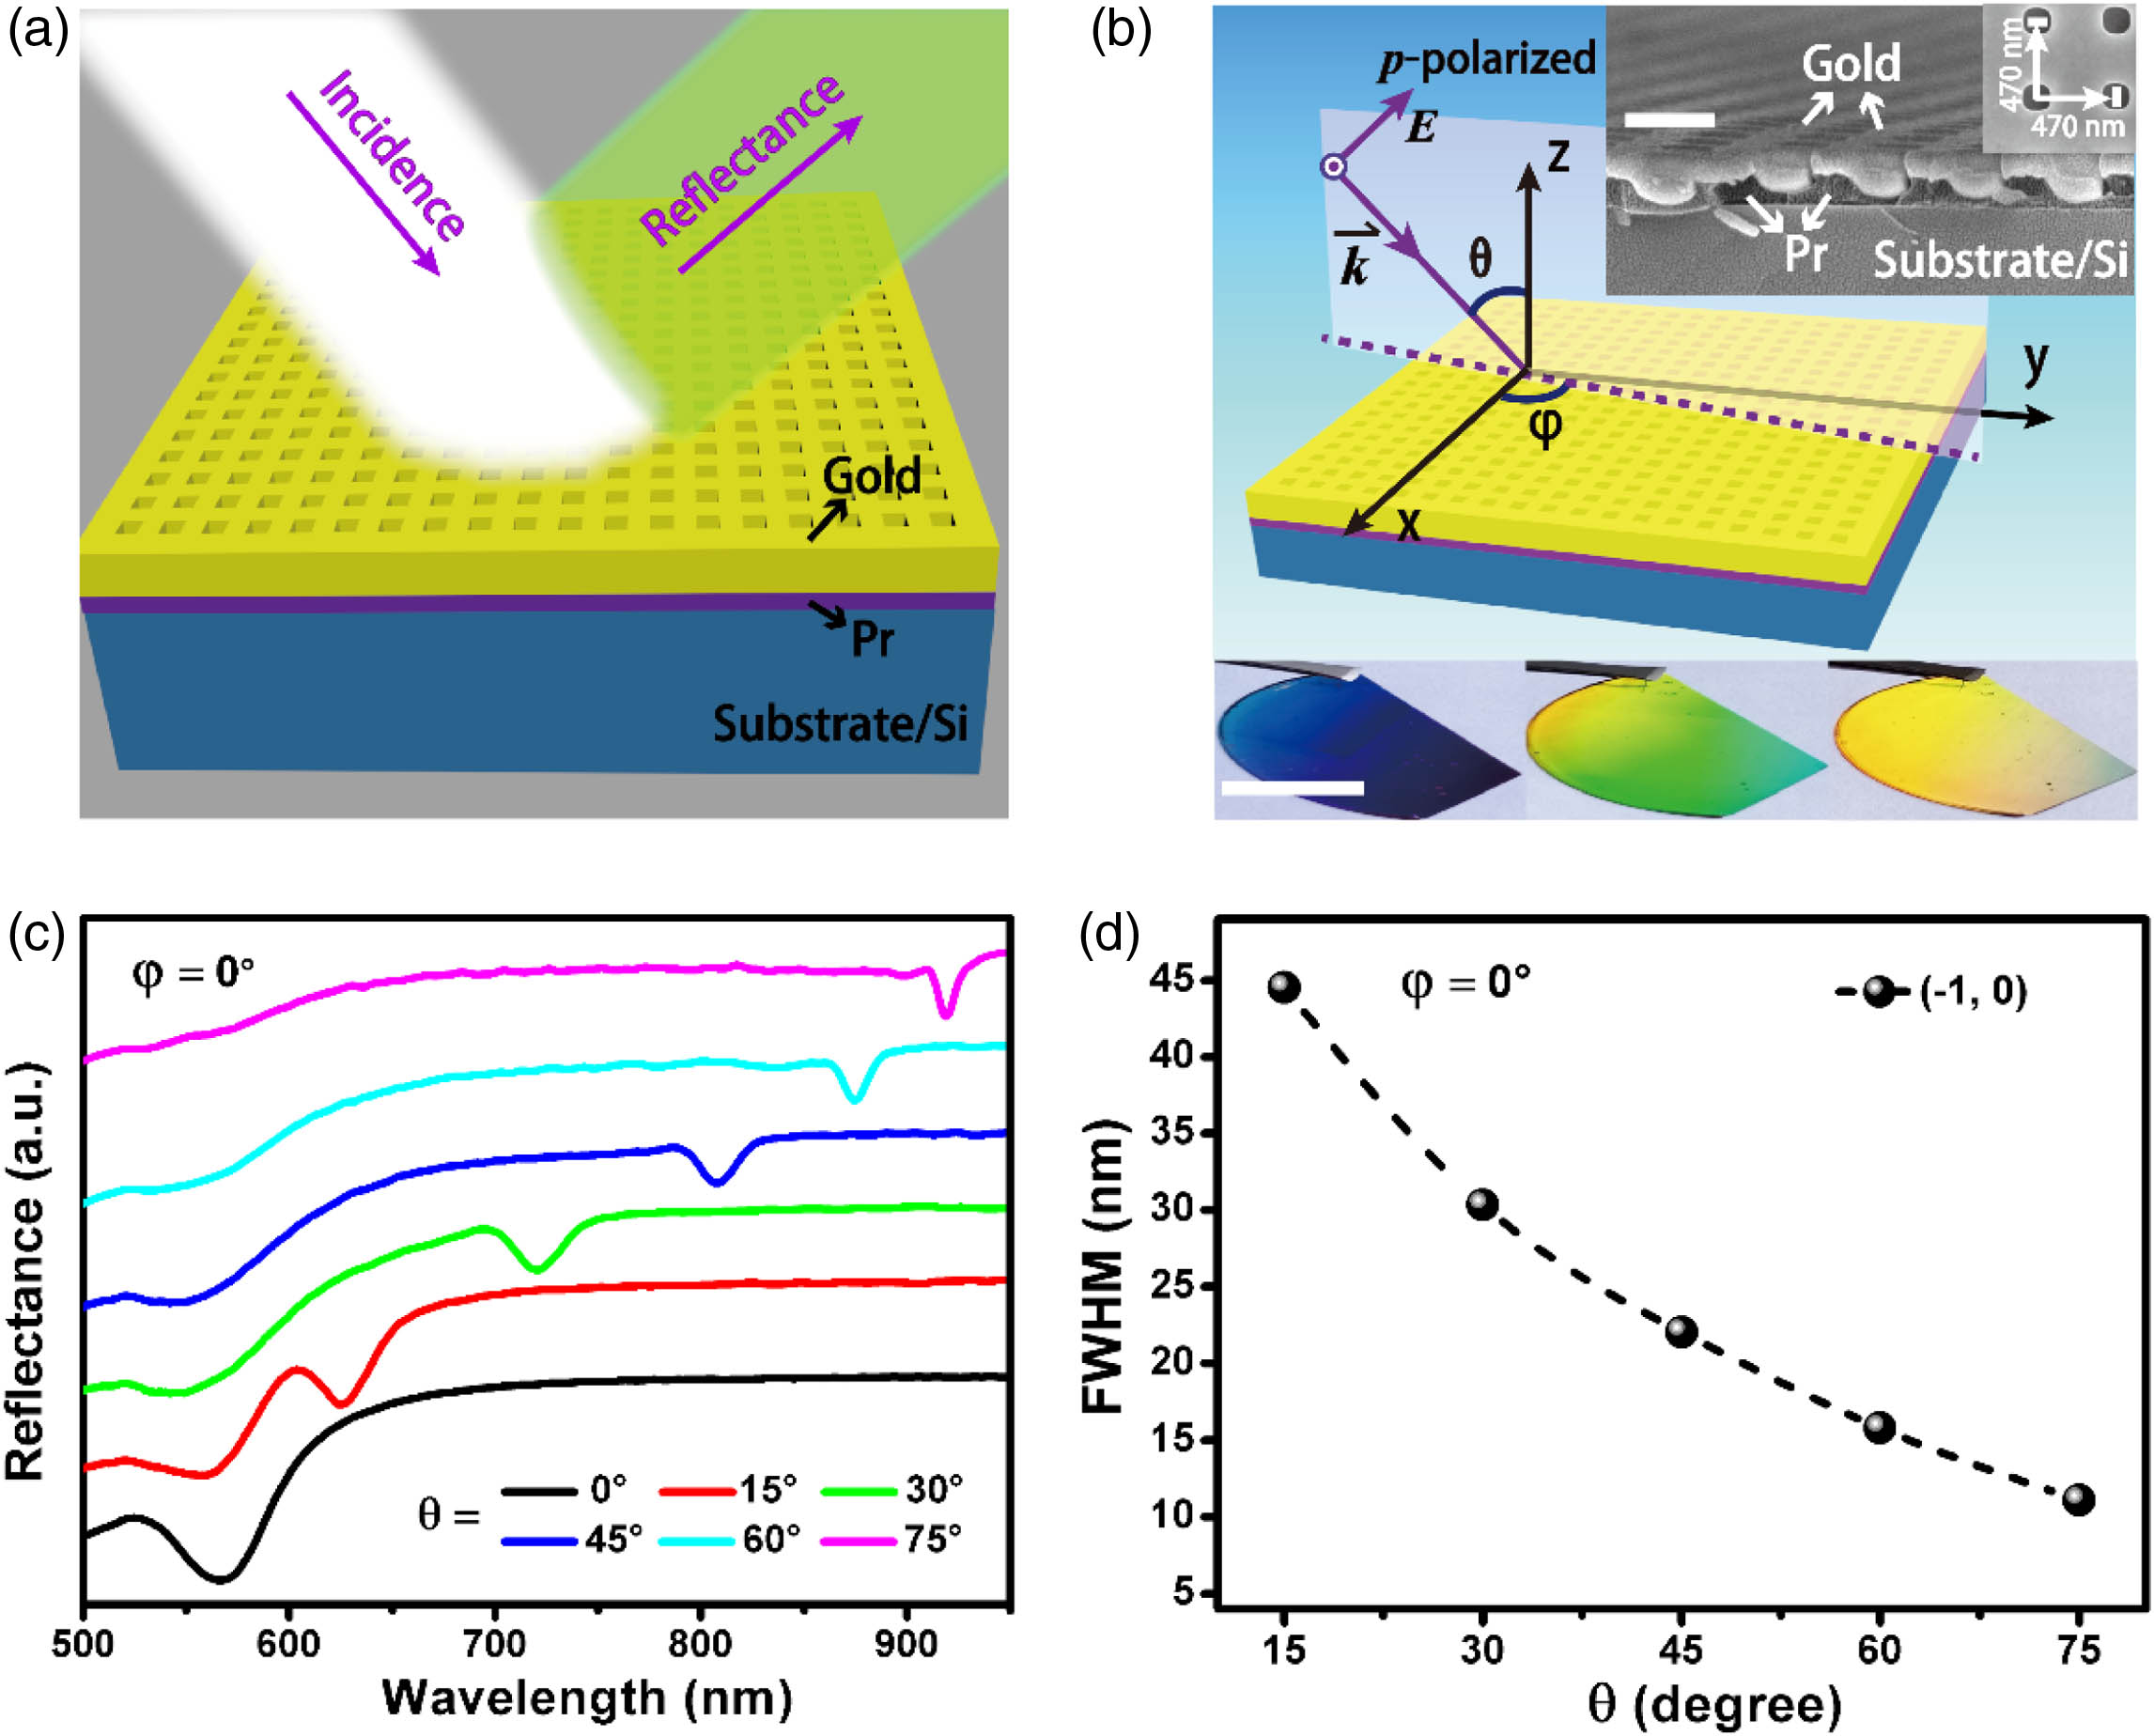
Fig. 2. Tuning the linewidths of plasmonic modes by varying azimuthal angles. (a), (b) Azimuthal angle-dependent reflectance spectra at the incident angles of 15° and 75°, respectively. (c) Theoretical resonance wavelength of (1, 0) mode (black curve) and (0, 1) (red curve) mode as a function of the azimuthal angle. Measured (1, 0) mode (black spheres) and (0, 1) mode (red spheres) nearly overlaid on theoretical modes. The pink dash arrows denote the cases used later. (d) Dependence of FWHM on (1, 0) mode (blue spheres) and (0, 1) mode (red spheres) achieved at different azimuthal angles. The short dash line and dot correspond to the left and right coordinate values, respectively, as shown by black arrows. Th incident angle is set as θ=75° in both (c) and (d).

下载图片 查看原文

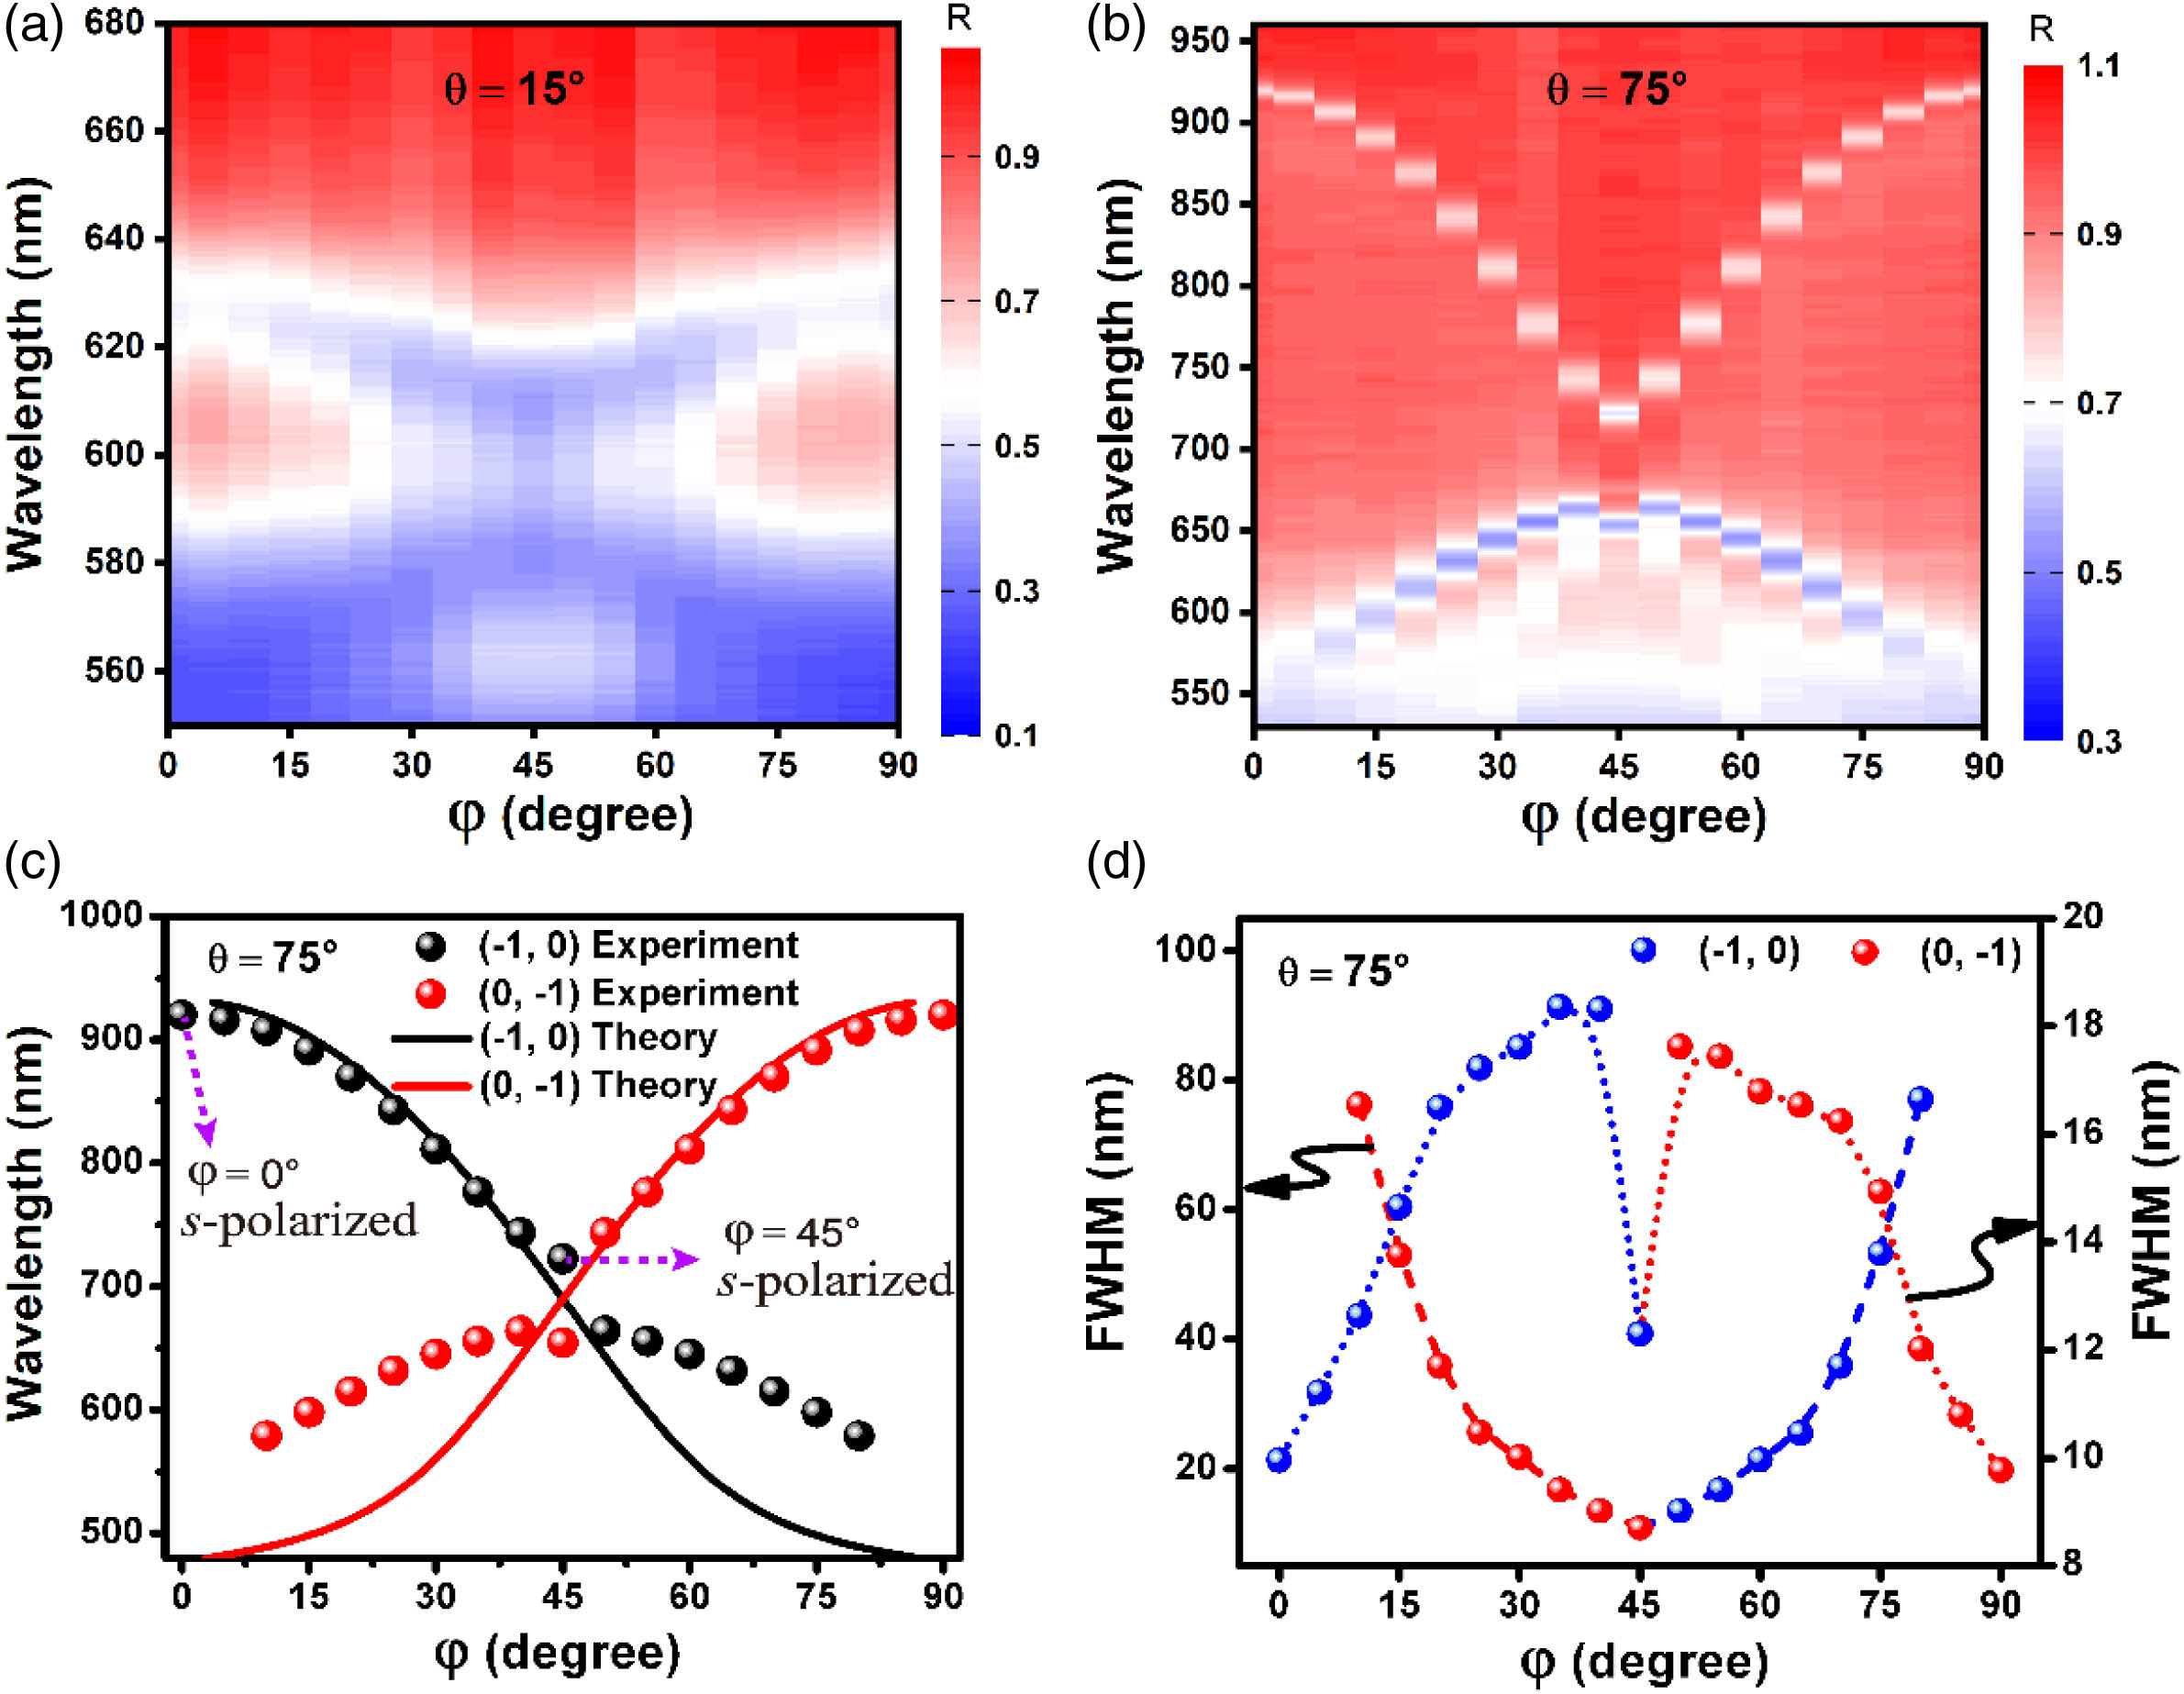
Fig. 3. Comparisons of the sensitivity between normal and oblique incidence with the unpolarized light. (a), (b) Experimentally measured reflectance spectra with different PSA concentrations ranging from 10 to 30 ng/mL after normalization. The excitation configurations are set as normal (θ=0°) and oblique (θ=75°,φ=0°) incidence with the unpolarized light in (a) and (b), respectively. Inset: Schematic drawings of excitation configurations. (c), (d) Plots of resonance wavelength positions of plasmonic modes extracted from (a) and (b) against PSA concentrations. The S and R2 denote the sensitivity and the correlation coefficient of the linear fitting, respectively. Note that the FWHM values are about 44 nm and 11 nm in (a) and (b), respectively.

下载图片 查看原文

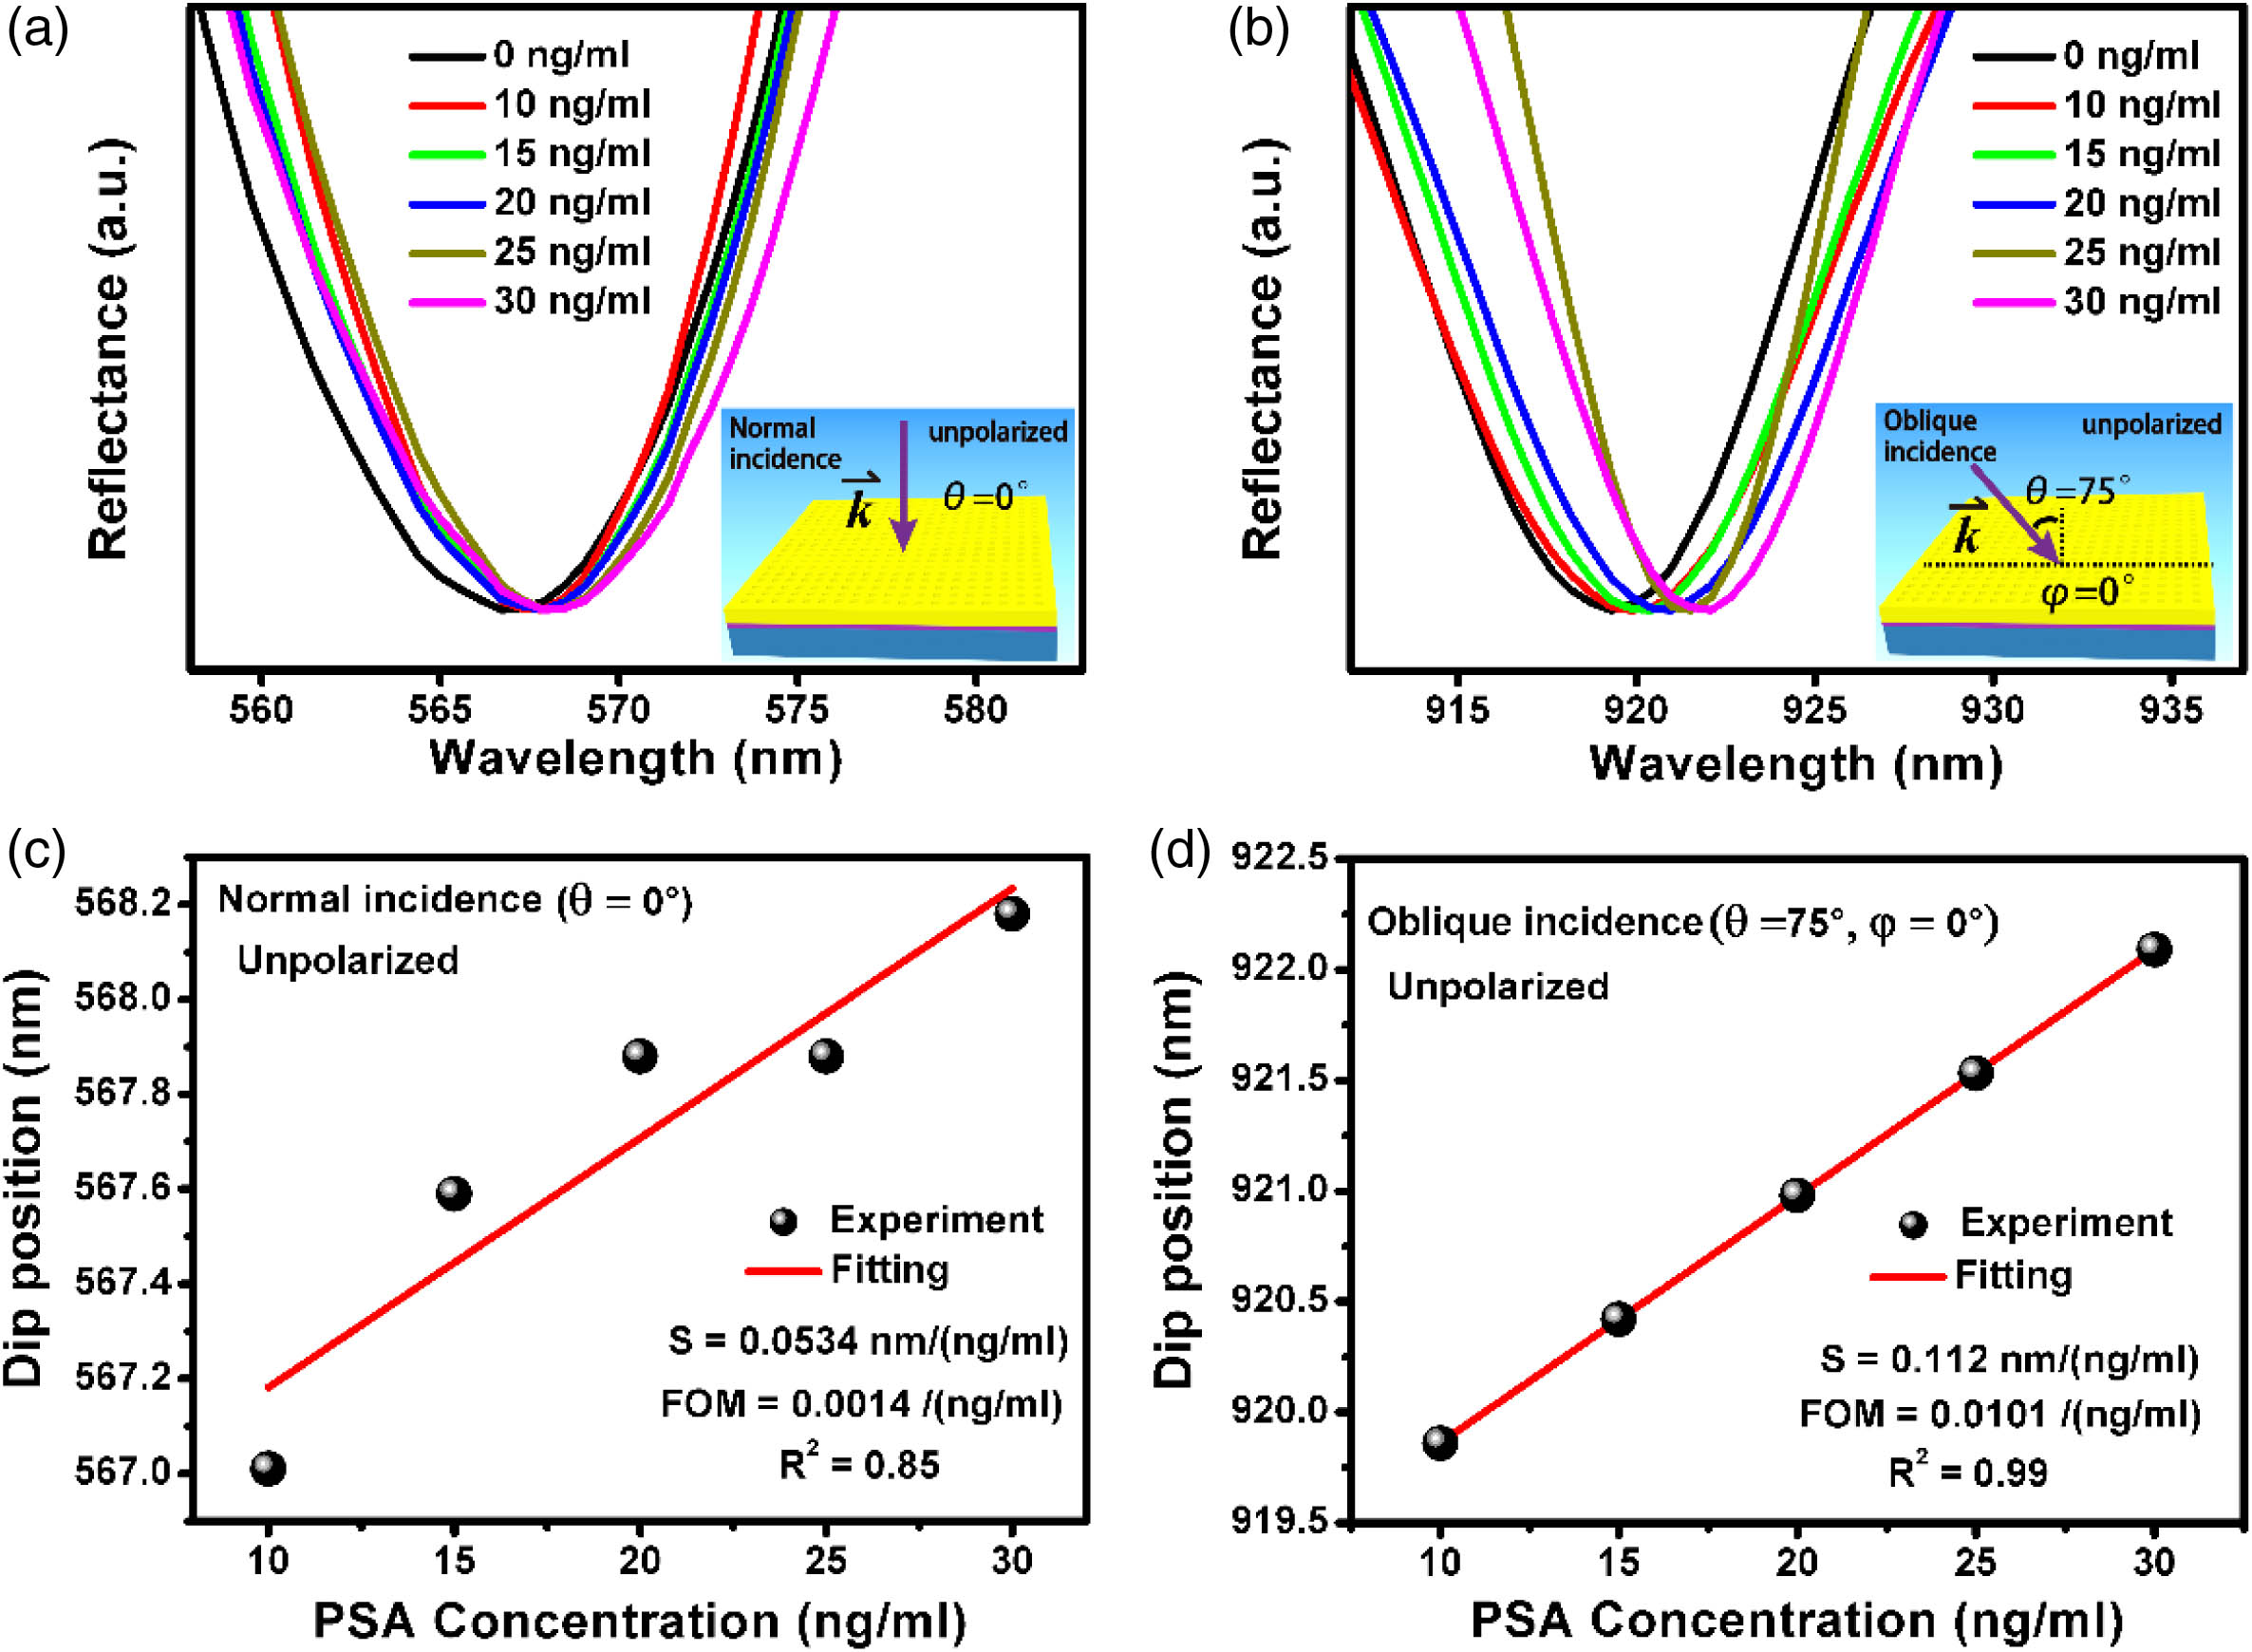
Fig. 4. Comparisons of the sensitivity under different azimuthal angles with the s-polarized light. (a), (b) Experimentally measured reflectance spectra with different PSA concentrations ranging from 10 to 35 ng/mL after normalization. Inset: Schematic drawings of excitation configurations. (c), (d) Resonance wavelength positions of plasmonic modes extracted from (a) and (b) as a function of PSA concentration. The S and R2 denote the sensitivity and the correlation coefficient of the linear fitting, respectively. Note that the FWHM values are about 10 nm and 12 nm in (a) and (b), respectively.

下载图片 查看原文

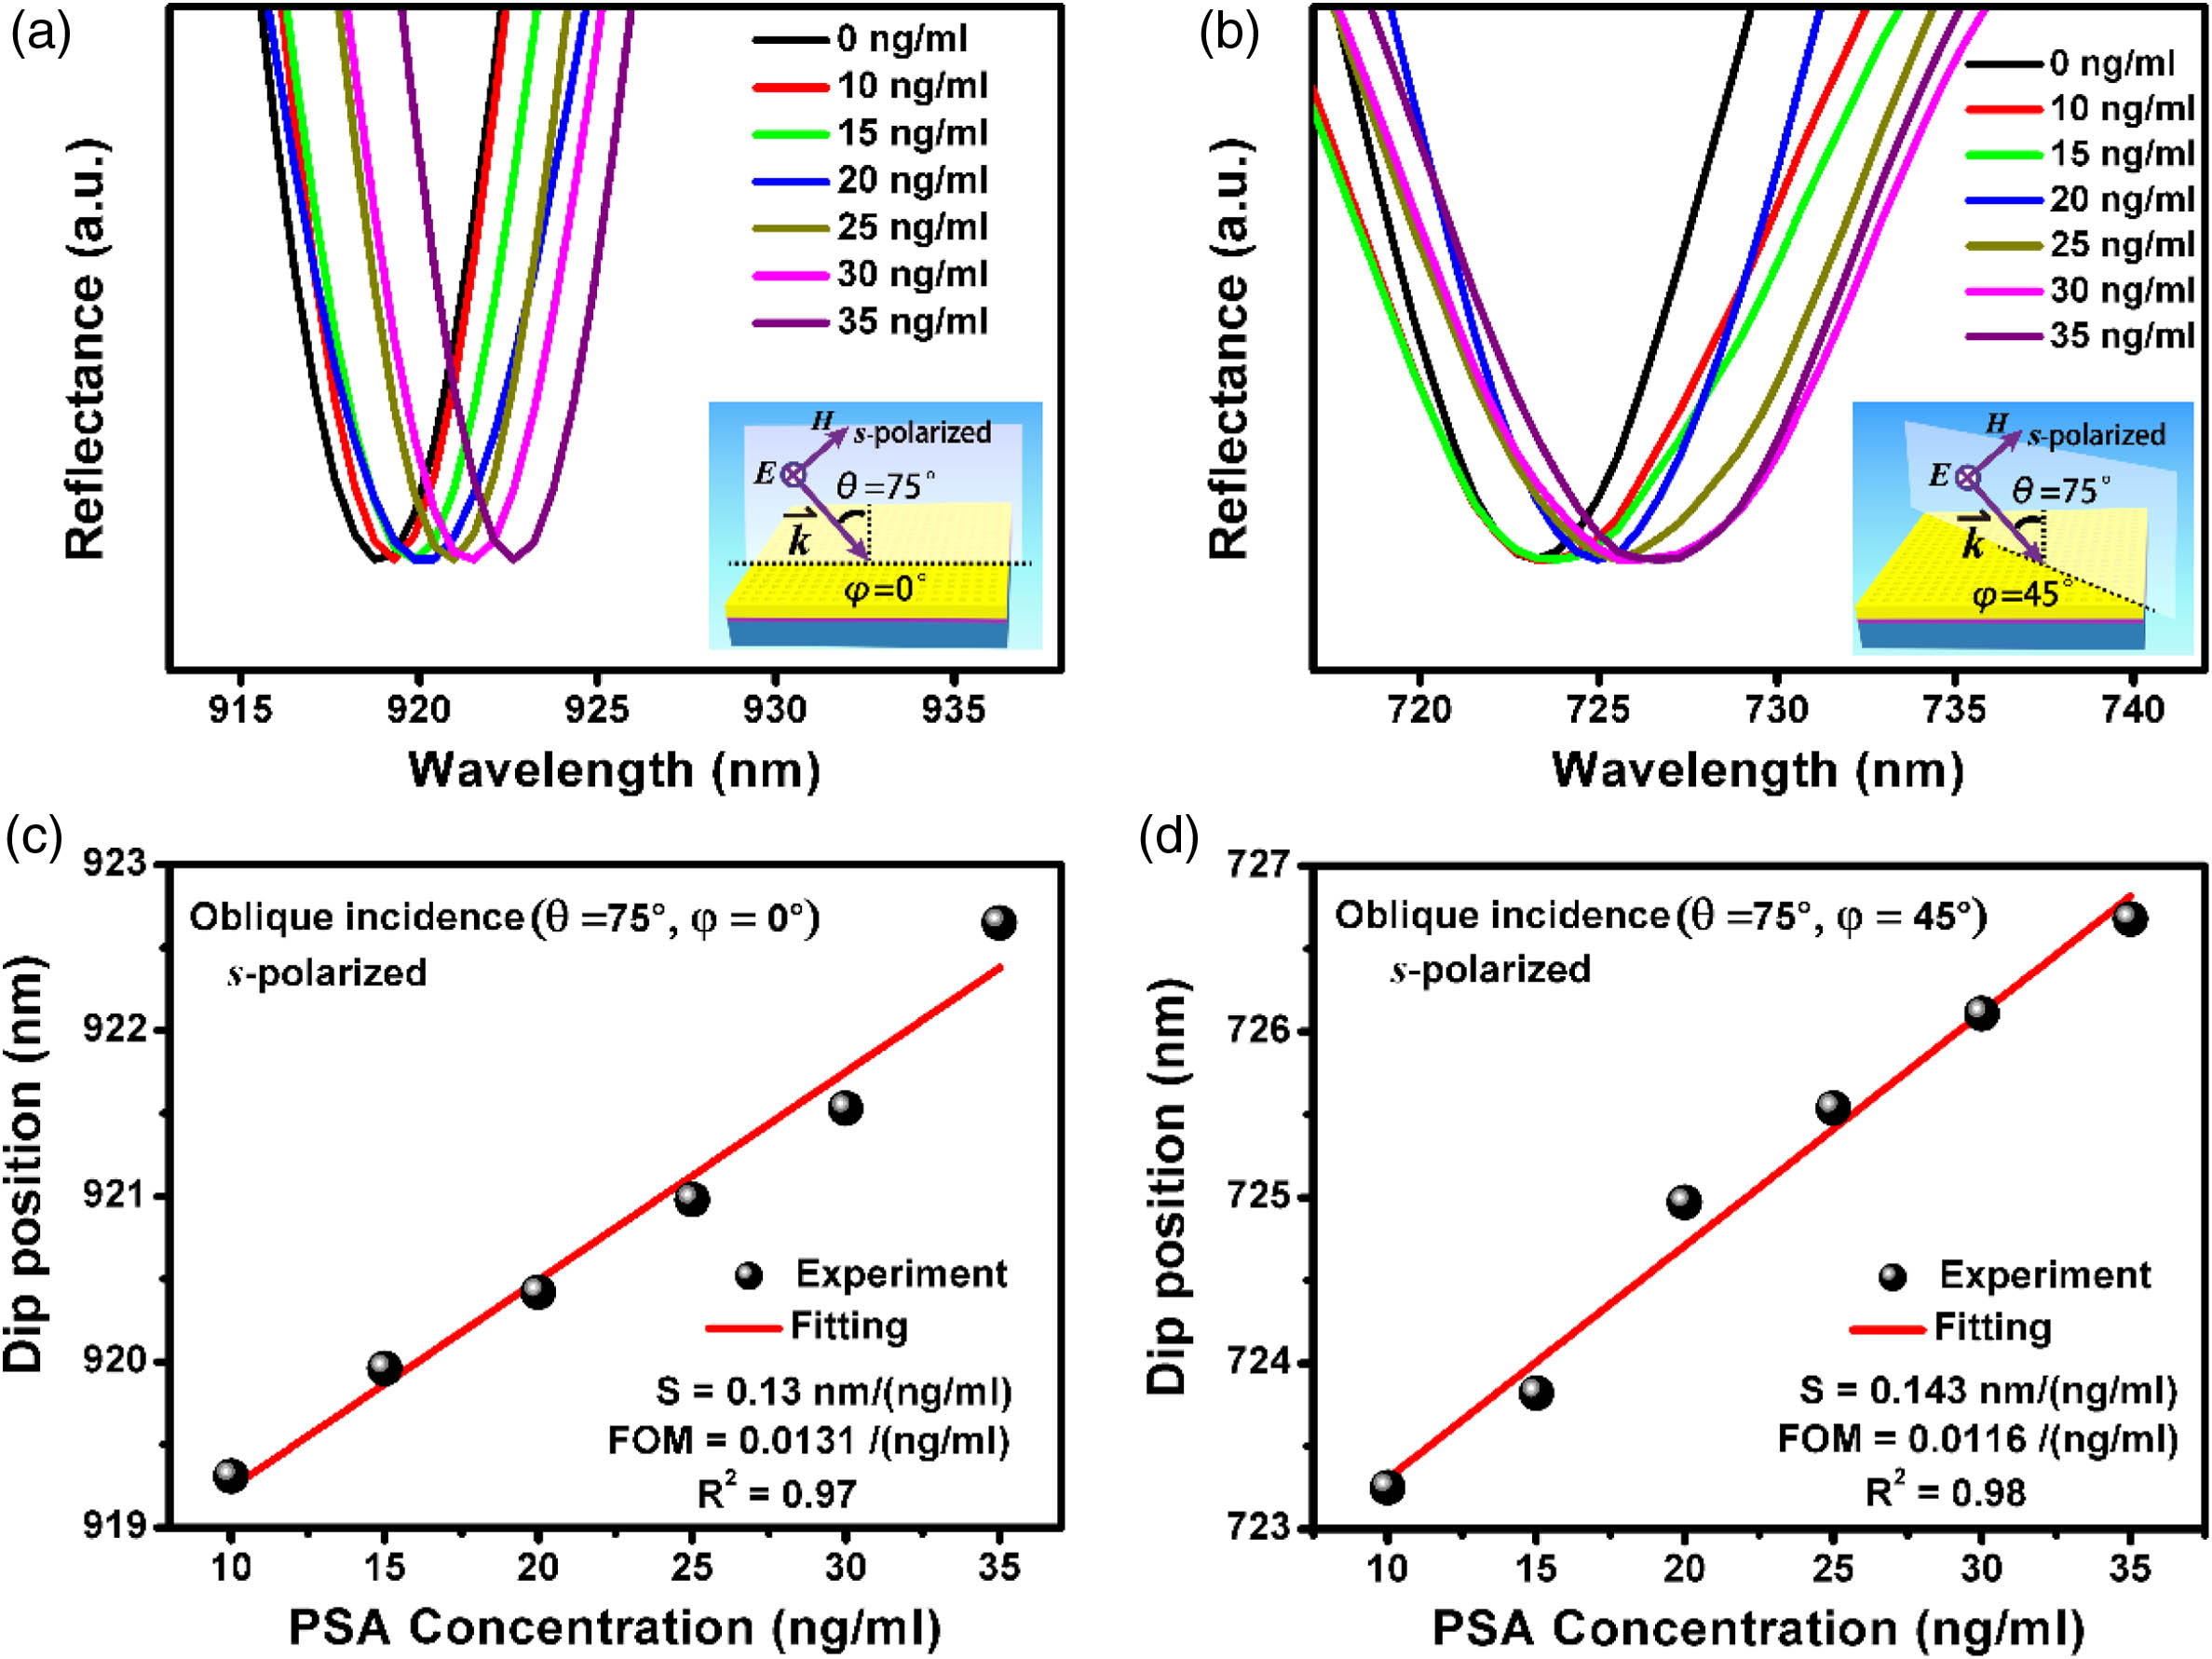
Fig. 5. Comparisons of the (a) sensitivity and (b) FOM under different excitation configurations. The C1, C2, C3, and C4 represent corresponding configurations explicated in Table 1.

下载图片 查看原文

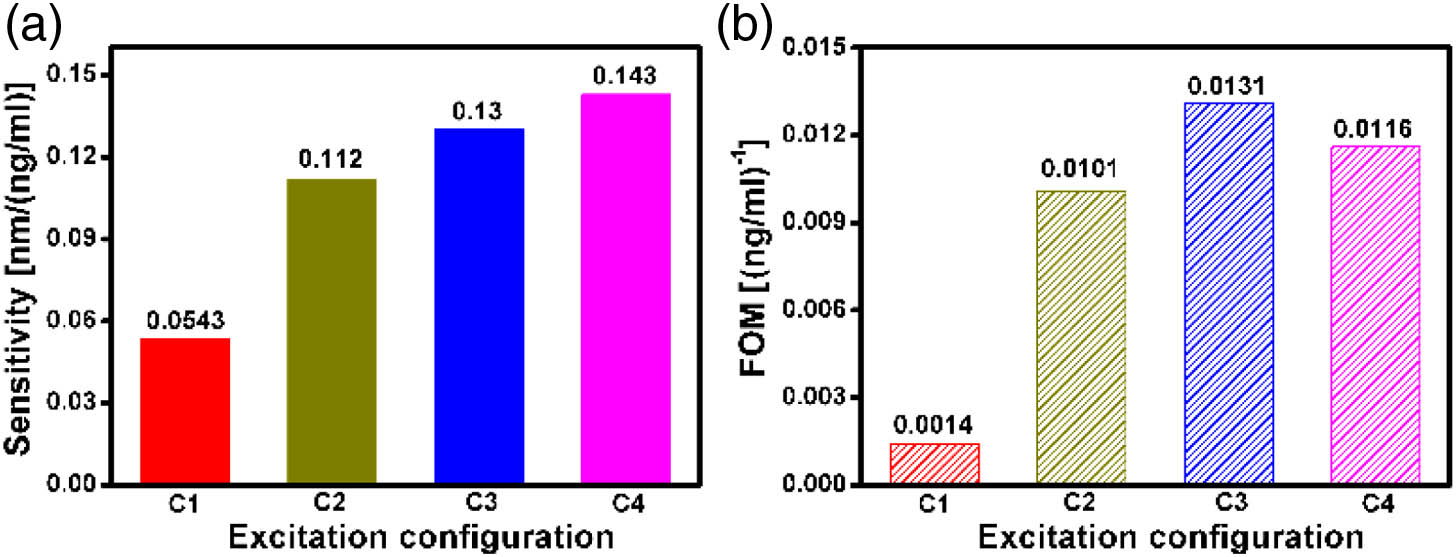
Fig. 6. Experimental and simulated reflectance spectra at normal incidence (θ=0°). Inset: Electromagnetic field profiles on and off resonances at 568, 527, and 698 nm, respectively.

下载图片 查看原文

Fig. 7. Experimentally measured (black spheres) and theoretical (red curve) resonance wavelength of (1, 0) SPP mode as a function of sinθ. The azimuthal angle is set as φ=0°.

下载图片 查看原文

Fig. 8. Azimuthal angle-dependent reflectance spectra at incident angles of 30°, 45°, and 60°, respectively.

下载图片 查看原文

Fig. 9. Periodic plasmonic nanohole arrays for biosensing. (a) Schematic drawings of functionalization, detection, and recycling. (b) Experimentally measured reflectance spectra under normal incidence for each procedure. Dashed lines denote corresponding configurations when performing the measurements.

下载图片 查看原文

Fig. 10. Comparisons of the linewidths of plasmonic modes between unpolarized and p/s-polarized excitations. The dashed lines are a guide for representing two hybrid modes (H1 and H2). Inset: Normalized FWHM of H1 and H2 modes without polarization (black columns) and with p- (red column) and s-polarizations (blue column). The incident angle is set as θ=75°, and the azimuthal angle is set as φ=45°.

下载图片 查看原文

Table1. Comparisons of Biosensing Performance under Different Excitation Configurationsa

Abbr.Excitation ConfigurationSensitivity [nm/(ng/mL)]FOM [(ng/mL)1]
C1Normal incidence, unpolarized, θ=0°0.05340.0014
C2Oblique incidence, unpolarized, θ=75°,φ=0°0.11200.0101
C3Oblique incidence, s-polarized, θ=75°,φ=0°0.13000.0131
C4Oblique incidence, s-polarized, θ=75°,φ=45°0.14300.0116

查看原文

Min Gao, Weimin Yang, Zhengying Wang, Shaowei Lin, Jinfeng Zhu, Zhilin Yang. Plasmonic resonance-linewidth shrinkage to boost biosensing[J]. Photonics Research, 2020, 8(7): 07001226.

引用该论文: TXT   |   EndNote

相关论文

加载中...

关于本站 Cookie 的使用提示

中国光学期刊网使用基于 cookie 的技术来更好地为您提供各项服务,点击此处了解我们的隐私策略。 如您需继续使用本网站,请您授权我们使用本地 cookie 来保存部分信息。
全站搜索
您最值得信赖的光电行业旗舰网络服务平台!