Photonics Research, 2020, 8 (7): 07001226, Published Online: Jun. 30, 2020  

Plasmonic resonance-linewidth shrinkage to boost biosensing Download: 705次

Author Affiliations
1 Department of Physics, Collaborative Innovation Center for Optoelectronic Semiconductors and Efficient Devices, Jiujiang Research Institute, Xiamen University, Xiamen 361005, China
2 Institute of Electromagnetics and Acoustics, Xiamen University, Xiamen 361005, China
3 College of Physics Science and Technology, Xinjiang University, Urumqi 830046, China
4 The First Affiliated Hospital of Xiamen University, Xiamen 361003, China
5 e-mail: nanoantenna@hotmail.com
6 e-mail: zlyang@xmu.edu.cn
Abstract
Coupling effects of surface plasmon resonance (SPR) induce changes in the wavelength, intensity, and linewidth of plasmonic modes. Here, inspired by coupling effects, we reveal an abrupt linewidth-shrinking effect in 2D gold nanohole arrays at the azimuthal angle of 45° arising from the interference of two degenerate SPR modes. We further demonstrate the biosensing capability under various excitation conditions for detecting the critical molecular biomarker of prostatic carcinoma, and achieve the maximum sensitivity at this angle. Our study not only enhances the understanding toward plasmonic resonance-linewidth shrinking, but also provides a promising strategy to greatly improve biosensing performance by light manipulation on plasmonic nanostructures.

1. INTRODUCTION

Surface plasmon resonance (SPR) [1,2] with tunable resonance wavelength, linewidth, and intensity has proven instrumental in wide applications, such as physics [36" target="_self" style="display: inline;">6], chemistry [7,8], biology [9,10], medicine [11], and renewable energy [12,13]. Particularly, extremely narrow plasmon-resonance linewidths lay solid foundations for refractive index sensing or practical biosensing [14,15]. However, along with SPR excitation in plasmonic nanostructures, electromagnetic decay occurs either radiatively or non-radiatively, suppressing the lifetimes of SPR modes [16,17]. Owing to such decay, the experimental SPR modes generally manifest broad resonance linewidths, leading to small figure of merit (FOM) values and naturally limiting the sensing performances [15,18].

In order to improve SPR sensing performances, substantial efforts have been devoted to increasing the FOM of plasmonic sensors [1830" target="_self" style="display: inline;">30]. Alternative methods by (i) using all-dielectric nanostructures [22], hyperbolic materials [14,23], and plasmonic metasurfaces [24,25], (ii) developing polarization conversion and chiral-based circular dichroism approaches [2628" target="_self" style="display: inline;">–28], and (iii) exploiting the control of the phase of light in magnetoplasmonic nanostructures [29,30] are widely used to achieve high sensing performances. Additionally, through elaborately designing specific plasmonic nanostructures, the active sensing regions that feature larger mode volumes and higher enhancements of electric fields are achieved. Such active regions are accessible to more molecular species, thus optimizing the sensitivity of SPR sensors [20,21]. Actually, except for increasing the sensitivity, more efforts have been made to decrease the resonance linewidth (full width at half maximum, FWHM, Γ) of SPR modes and hence increase the FOM that is widely used to evaluate the sensing performance [15,18]. The FWHM is inversely proportional to the lifetime (τ) of the SPR mode expressed as Γ=2/τ [17]. Based on this expression, therefore, one can prolong τ to reduce Γ. Generally, the τ is determined by the non-radiative decay originating from the intrinsic absorption loss or by the radiative decay through re-emitted photons [16].

On the one hand, reduction of non-radiative losses can efficiently prolong τ, generally focusing on improving the crystallinity of metallic nanomaterials and seeking alternatives with low losses [20,31], such as dielectric materials. On the other hand, reduction of radiative losses can be achieved through the coupling of plasmonic modes associated with localized surface plasmon (LSP) and surface plasmon polaritons (SPPs) [15,18,3234" target="_self" style="display: inline;">–34]. For instance, couplings of LSP-LSP [34], LSP-SPP [32], and LSP/SPP with other resonance modes such as Wood’s anomaly [15], optical waveguide modes [3], and photonic microcavities [33], respectively, are capable of reducing channels of losses and therefore decreasing the FWHM for enhanced sensing performance. In addition, another scheme for reducing FWHM lies in the formation of surface lattice resonances with extremely narrow linewidths below 10 nm and highly enhanced electric fields, due to diffractive coupling among metallic nanoparticles arranged periodically [35,36]. Furthermore, two SPP modes can strongly interact with each other with the formation of hybridized bright and dark modes in the ΓM direction (the ΓM direction in reciprocal space corresponding to the azimuthal angle of 45° in real space) [37,38], whereas efforts have been devoted to determining group velocity [39], polarization states [40], fluorescence enhancement [41], and excitation rate of quantum dots [42], etc. Amid the immenseness of these research endeavors, the use of the shrink effect of plasmonic FWHM in the ΓM direction to directly improve practical biosensing performances has yet to be realized.

In this work, we systematically investigate the plasmonic effects on biomolecular sensing by changing excitation conditions, such as the incident angle, azimuthal angle, and polarization. We reveal the abrupt shrinking of resonance linewidth in the ΓM direction, which is attributed to the hybridized mode induced by the interference of two degenerate SPP modes. In view of the unique resonance feature, we adopt the hybridized mode to demonstrate the practical biosensing capability by detecting the prostate specific antigen (PSA), which is a key biomarker for the diagnosis and prognosis of prostatic cancer. By optimizing the excitation conditions, a maximum sensitivity is achieved in the ΓM direction, and the manipulation on light polarization and angle demonstrates significant improvement on biosensing performance.

2. RESULTS AND DISCUSSION

2.1 A. Plasmonic Resonance-Linewidth Shrinking

Two-dimensional (2D) gold nanohole arrays are fabricated via the nanoimprint lithography system and the gold deposition method [43]. The detailed experimental procedure is depicted in the Materials and Methods section. The schematic illustration of the measurement configuration is shown in Fig. 1(a). To simplify the following discussions, we define the symbols for the incident angle and azimuthal angle, respectively [Fig. 1(b)]. The scanning electron microscopy (SEM) image of the array with a cross-sectional view is shown in the top inset of Fig. 1(b). The period of the array is fixed at 470 nm throughout this work. The photographs of the array exhibit bright and variable colors under different visual angles, as shown in the bottom inset of Fig. 1(b).

Fig. 1. Two-dimensional gold nanohole arrays supporting SPP modes fabricated by the nanoimprint lithography method. (a) Schematic illustration of the optical measurement configuration. (b) Definitions of incident angle θ, azimuthal angle φ, and polarization (p or s), respectively. Inset: (top) SEM images of the array with cross-sectional and top views; (bottom) photographic images of the array under different visual angles. Scale bars denote 500 nm and 1 cm for SEM and photographic images, respectively. (c) Experimentally measured reflectance spectra as a function of incident angles from 0° to 75°. The azimuthal angle is set as φ=0°. (d) Dependence of FWHM on (1, 0) SPP mode achieved at different incident angles.

下载图片 查看所有图片

The gold nanohole arrays provide orthogonal reciprocal lattice vectors, allowing for exciting grating-coupled SPP modes and trapping spatial light around resonance wavelengths. In comparison with the off-resonance modes (see Appendix A), the simulated electric-field distributions of the on-resonance mode manifest that the electric fields are tightly confined and highly enhanced surrounding the nanoholes. We continue to investigate the influences of incident angle on resonant wavelengths and linewidths of plasmonic modes, as illustrated in Fig. 1(c). For simplification, the azimuthal angle φ is kept as 0°. From θ=0° to θ=75°, we clearly observe the phenomenon that the reflectance spectra continue to have a redshift and become narrower when θ increases. To quantitatively explore the evolution characteristics of plasmonic modes, we perform the theoretical fitting by using the phase matching equation [40,44,45], where λSPP denotes the SPP resonance wavelength, and εAu and ε represent the permittivity of gold and dielectric, respectively. (m, n) are the orders of SPP modes. θ, φ, and P are the incidence angle, azimuthal angle, and array periodicity, respectively. The fitting results indicate that the plasmonic mode observed in Fig. 1(c) can be attributed to the (1, 0) SPP mode (see Appendix B). To find out the relation between linewidths (i.e., FWHM) and incident angles, we have therefore fitted incident angle-dependent reflectance spectra measured in Fig. 1(c) using a Lorentzian line shape function, which manifests behaviors similar to those of the Fano line shape [17,18]. As shown in Fig. 1(d), a gradual decreasing behavior of FWHM when θ increases from 0° to 75° can be seen. We can explain this behavior by means of a Rayleigh scattering model [17,46]. Based on the Rayleigh description, the FWHM is inversely proportional to the wavelength for a given 2D periodic nanohole array. As expected, we can see the redshift of SPP modes and therefore the narrowing of linewidths shown in Fig. 1(d).

In order to find out how the azimuthal angle influences resonance wavelengths and linewidths of plasmonic modes, we study the reflectance spectra depending on the change of azimuthal angle. As illustrated in Fig. 2(a), we can readily identify two symmetrical branches at θ=15°, which can be attributed to two different SPP modes. As θ increases to 75°, those SPP modes exhibit familiar symmetrical characteristics and become easier to be identified [Fig. 2(b)]. For a comprehensive understanding, additional azimuthal angle-dependent reflectance spectra with other incident angles are also investigated (see Appendix C). Quantitatively, we have compared the corresponding spectral positions of SPP modes and the theoretical fitting by using Eq. (1). As a result, satisfactory qualitative agreements between measurements and fittings can be obtained [Fig. 2(c)]. As validated by Eq. (1), those plasmonic modes can be attributed to the (0, 1) and (1, 0) SPP modes, respectively. Although these two SPP modes behave as critical symmetries at φ=45°, the mechanism that governs these mode evolutions differs. Indeed, those two SPP modes monotonically shift with increasing φ. From φ=0° to φ=90°, for instance, the (0, 1) SPP mode retains the redshift, while the (1, 0) SPP mode continues to have the blueshift. It should be pointed out that the discrepancies between the simplification of the theory and the complexity of the experimental inner nanostructure of the array can possibly result in differences between theoretical fittings and experiments. Additionally, we have fitted azimuthal angle-dependent reflectance spectra measured in Fig. 2(c). As a result, from φ=0° to φ=45°, the FWHM of the (0, 1) SPP mode decreases with increasing φ [Fig. 2(d)], which agrees with the Rayleigh scattering theory [17,46]. According to the abovementioned Rayleigh description, we know that a larger wavelength is capable of leading to a drastically decreased SPP linewidth. However, we can observe a conspicuous drop of FWHM for the (1, 0) SPP mode when φ increases to 45°. This abrupt change of the FWHM probably originates from the strong interference effect of two (0, 1) and (1, 0) SPP modes at φ=45°, forming the hybridization of these two SPP modes. We note that, furthermore, an intriguing plasmonic bandgap of 68  nm occurs at φ=45° [37,43,44].

Fig. 2. Tuning the linewidths of plasmonic modes by varying azimuthal angles. (a), (b) Azimuthal angle-dependent reflectance spectra at the incident angles of 15° and 75°, respectively. (c) Theoretical resonance wavelength of (1, 0) mode (black curve) and (0, 1) (red curve) mode as a function of the azimuthal angle. Measured (1, 0) mode (black spheres) and (0, 1) mode (red spheres) nearly overlaid on theoretical modes. The pink dash arrows denote the cases used later. (d) Dependence of FWHM on (1, 0) mode (blue spheres) and (0, 1) mode (red spheres) achieved at different azimuthal angles. The short dash line and dot correspond to the left and right coordinate values, respectively, as shown by black arrows. Th incident angle is set as θ=75° in both (c) and (d).

下载图片 查看所有图片

2.2 B. Efficient Biomolecular Sensing

Based on above investigations of SPR linewidths and intensities, we have demonstrated that the FWHM decreases with increasing θ and that an abrupt change of the FWHM occurs at φ=45°. The plasmonic modes with narrow FWHM are highly advantageous for ultrasensitive SPR sensing, and are particularly beneficial for biomolecular detection [9,10,47]. Therefore, we have exemplified the sensing of PSA by the immunologic specificity of anti-PSA binding. For reference, the whole detailed experimental procedures of functionalization, detection, and recycling have been depicted in our previous work [9], as briefly illustrated in Appendix D. Under normal incidence, the Eq. (1) can be simplified to For the biosensing system, ε can be regarded as a local effective permittivity in combination with the immobilized molecules and the air. With the adsorption or the binding, ε (or the refractive index) becomes larger (as the effective permittivity behaves proportionally to the refractive index). Hence, according to Eq. (2), the resonance wavelength λSPP redshifts when ε increases (see Appendix D). Similarly, in Eq. (1), ε can be assumed as the effective permittivity in combination with the finite dielectric bounding layer and the air, and the use of bounding layer leads to the redshift of plasmonic modes.

To systematically validate and demonstrate the influences of excitation conditions on the biosensing performance, we have measured the detection sensitivity and FOM of the array under different excitation configurations. As illustrated in Fig. 3(a), we first measure the reflectance spectra under normal incidence without polarization by using different concentrations of PSA from 10 to 30 ng/mL. For the sake of ensuring the measurement precision, the incubation time and the liquid volume have been maintained as the same for various concentrations. From the concentration-dependent reflectance spectra, we can observe that the resonance wavelength behaves with slight redshifts with larger concentrations [Fig. 3(a)]. To quantitatively analyze the detection sensitivity, we have linearly fitted spectral dip positions extracted from Fig. 3(a), as shown in Fig. 3(c). As a result, the fitted sensitivity merely equals 0.0534 nm/(ng/mL), and the widely used evaluation metric of the sensing performance, FOM, can be calculated to be 0.0014(ng/mL)1. Additionally, the linear fitting manifests a low correlation coefficient R2 of 0.85, indicating a poor linear relationship. Once the excitation configuration turns into oblique incidence at θ=75°, an obvious wavelength shift can be seen immediately [Fig. 3(b)]. Moreover, the fitted detection sensitivity and the calculated FOM reach 0.112 nm/(ng/mL) and 0.0101(ng/mL)1, respectively, and a very good correlation coefficient R2 of 0.99 is obtained [Fig. 3(d)], indicating that increasing the incident angle will help improve the detection sensitivity and FOM.
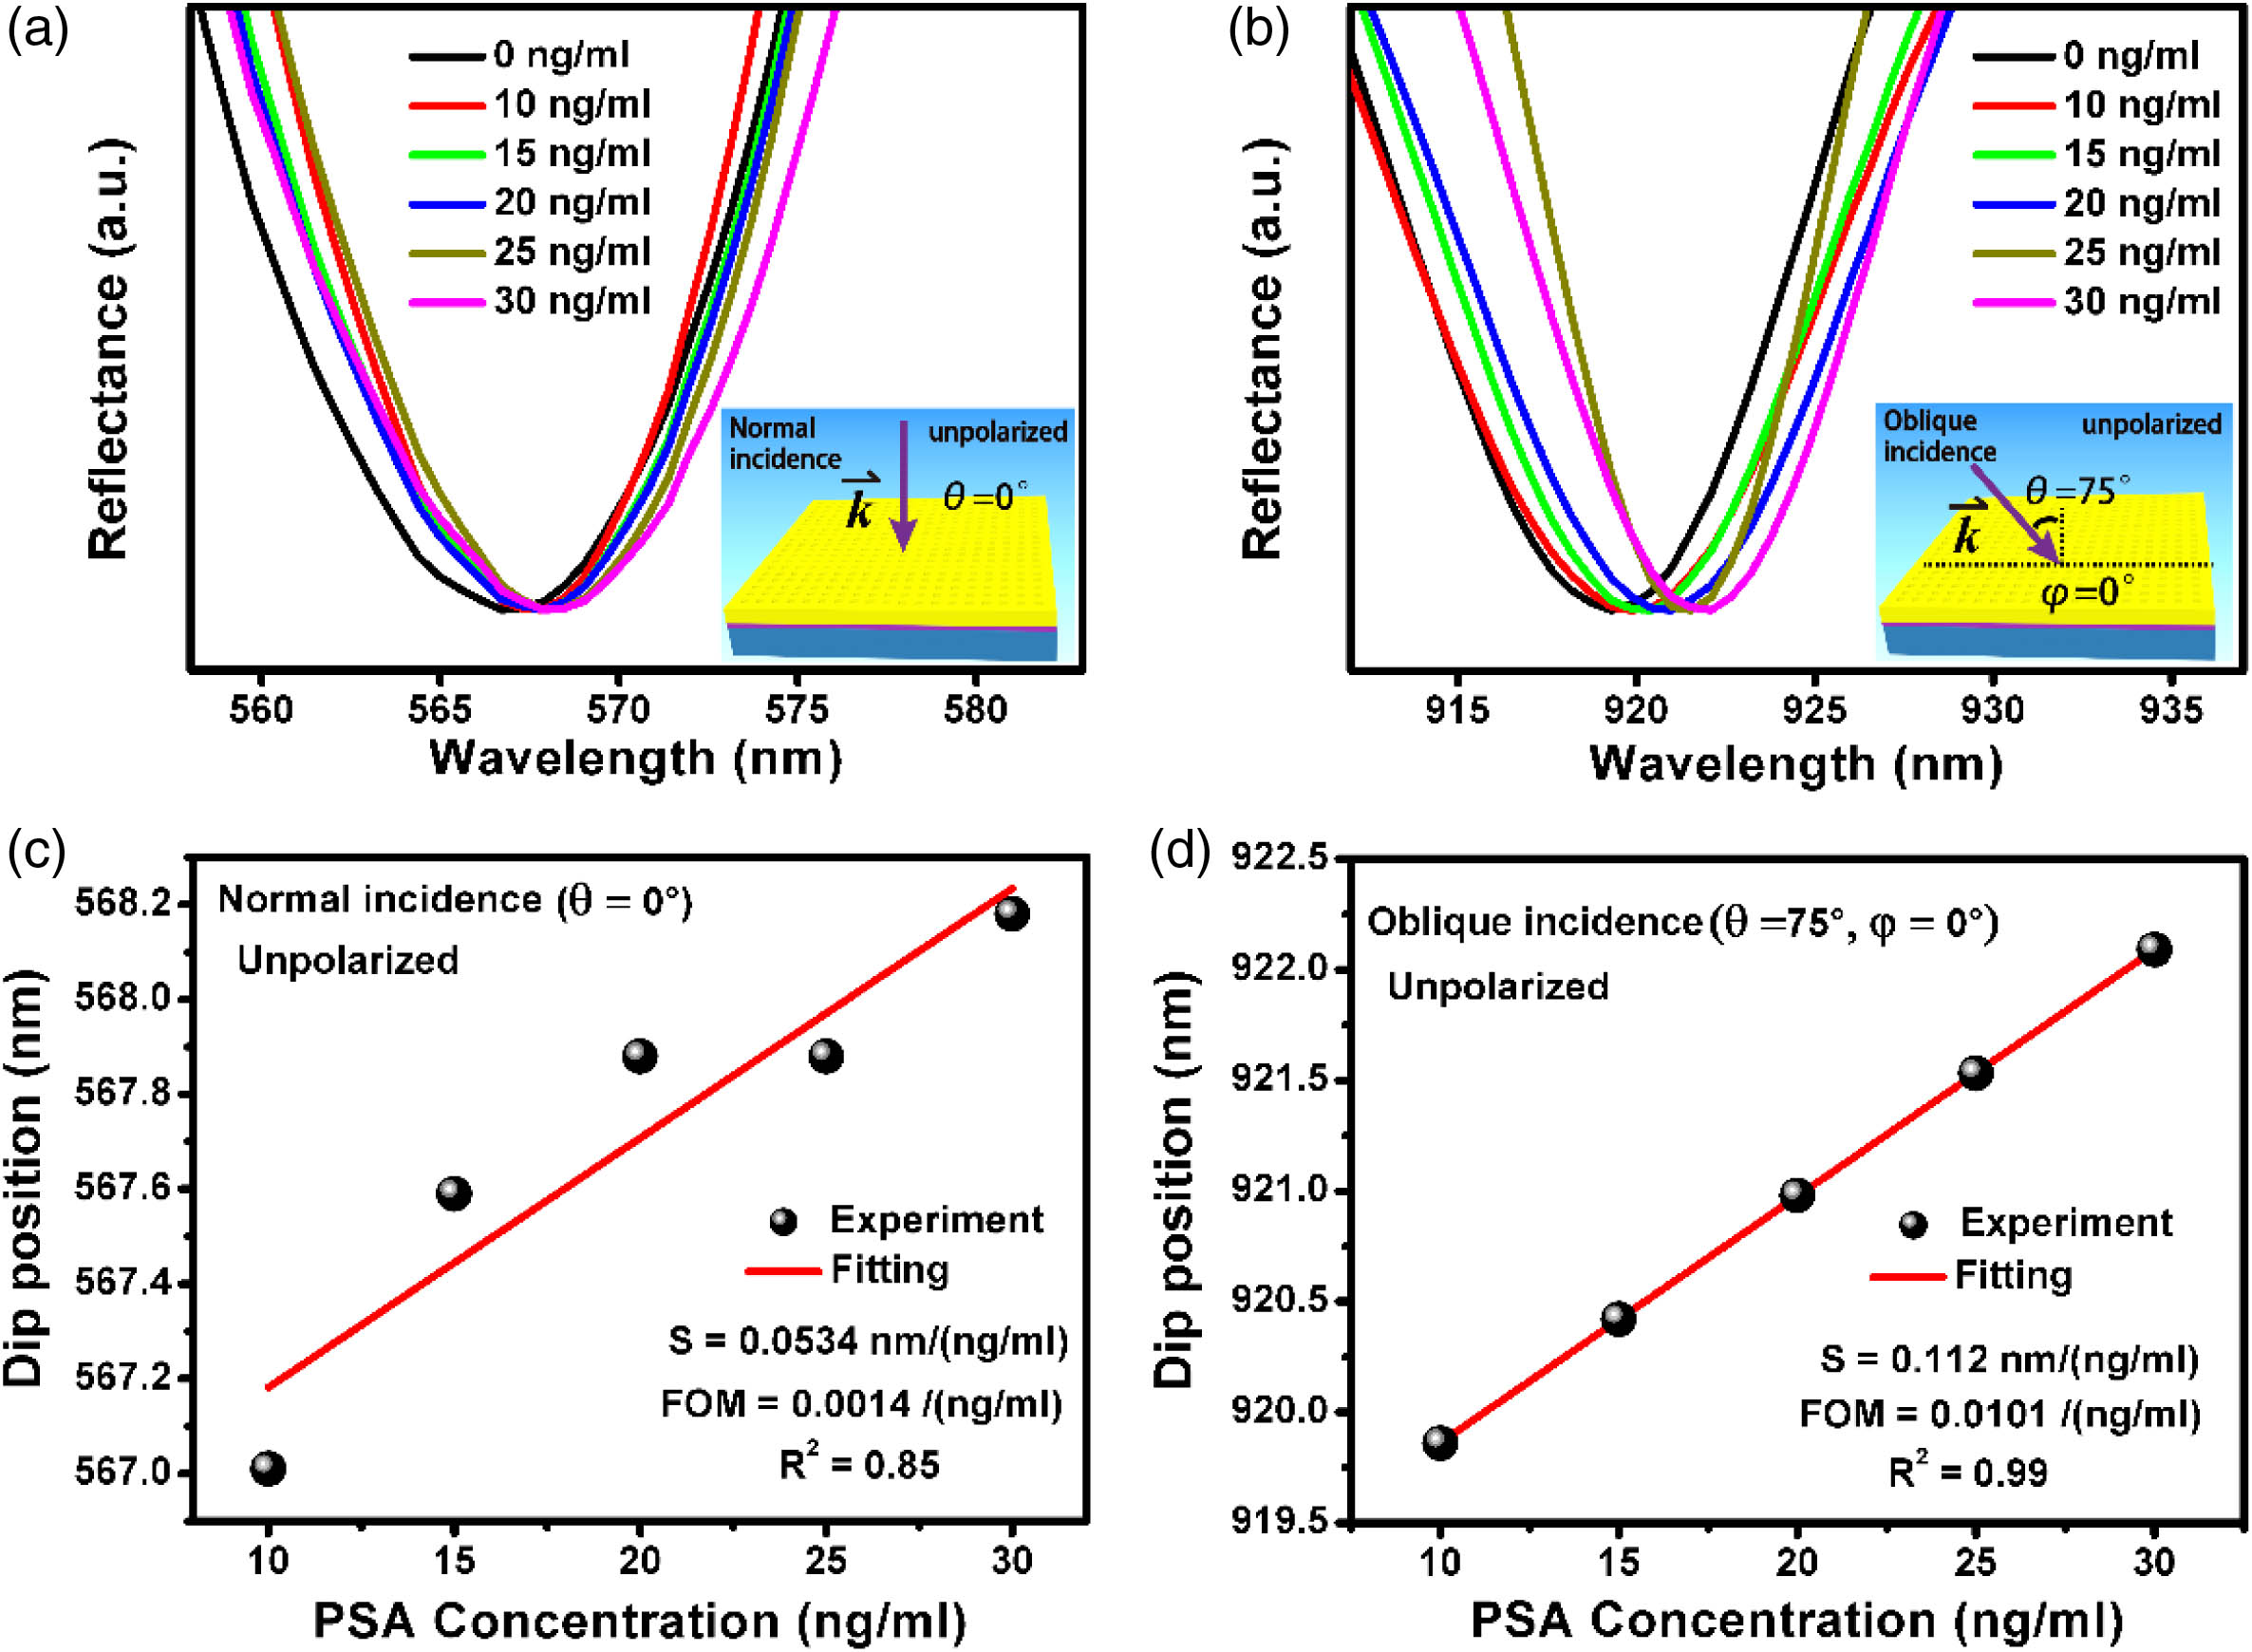
Fig. 3. Comparisons of the sensitivity between normal and oblique incidence with the unpolarized light. (a), (b) Experimentally measured reflectance spectra with different PSA concentrations ranging from 10 to 30 ng/mL after normalization. The excitation configurations are set as normal (θ=0°) and oblique (θ=75°,φ=0°) incidence with the unpolarized light in (a) and (b), respectively. Inset: Schematic drawings of excitation configurations. (c), (d) Plots of resonance wavelength positions of plasmonic modes extracted from (a) and (b) against PSA concentrations. The S and R2 denote the sensitivity and the correlation coefficient of the linear fitting, respectively. Note that the FWHM values are about 44 nm and 11 nm in (a) and (b), respectively.

下载图片 查看所有图片

We continue to investigate the influence of the azimuthal angle on the detection sensitivity [Fig. 4(a)]. As can be seen from Fig. 4(c), the sensitivity and FOM reach 0.13 nm/(ng/mL) and 0.0131(ng/mL)1, respectively, under s-polarization at φ=0°, which indeed improves the sensing performance in comparison with 0.112 nm/(ng/mL) and 0.0101(ng/mL)1 without polarization illustrated in Fig. 3(d). It is worth mentioning that we here exemplify the s-polarization for sensing due to the narrower FWHM under s-polarization than that under p-polarization (see Appendix E). Subsequently, at the critical angle of φ=45°, we explore the effect of the strong mode interference on the sensitivity [Fig. 4(b)]. We can observe more noticeable spectral shifts in comparison with Fig. 4(a), and obtain a continuous improved detection sensitivity up to 0.143 nm/(ng/mL), whereas the FOM decreases to 0.0116(ng/mL)1 [Fig. 4(d)].
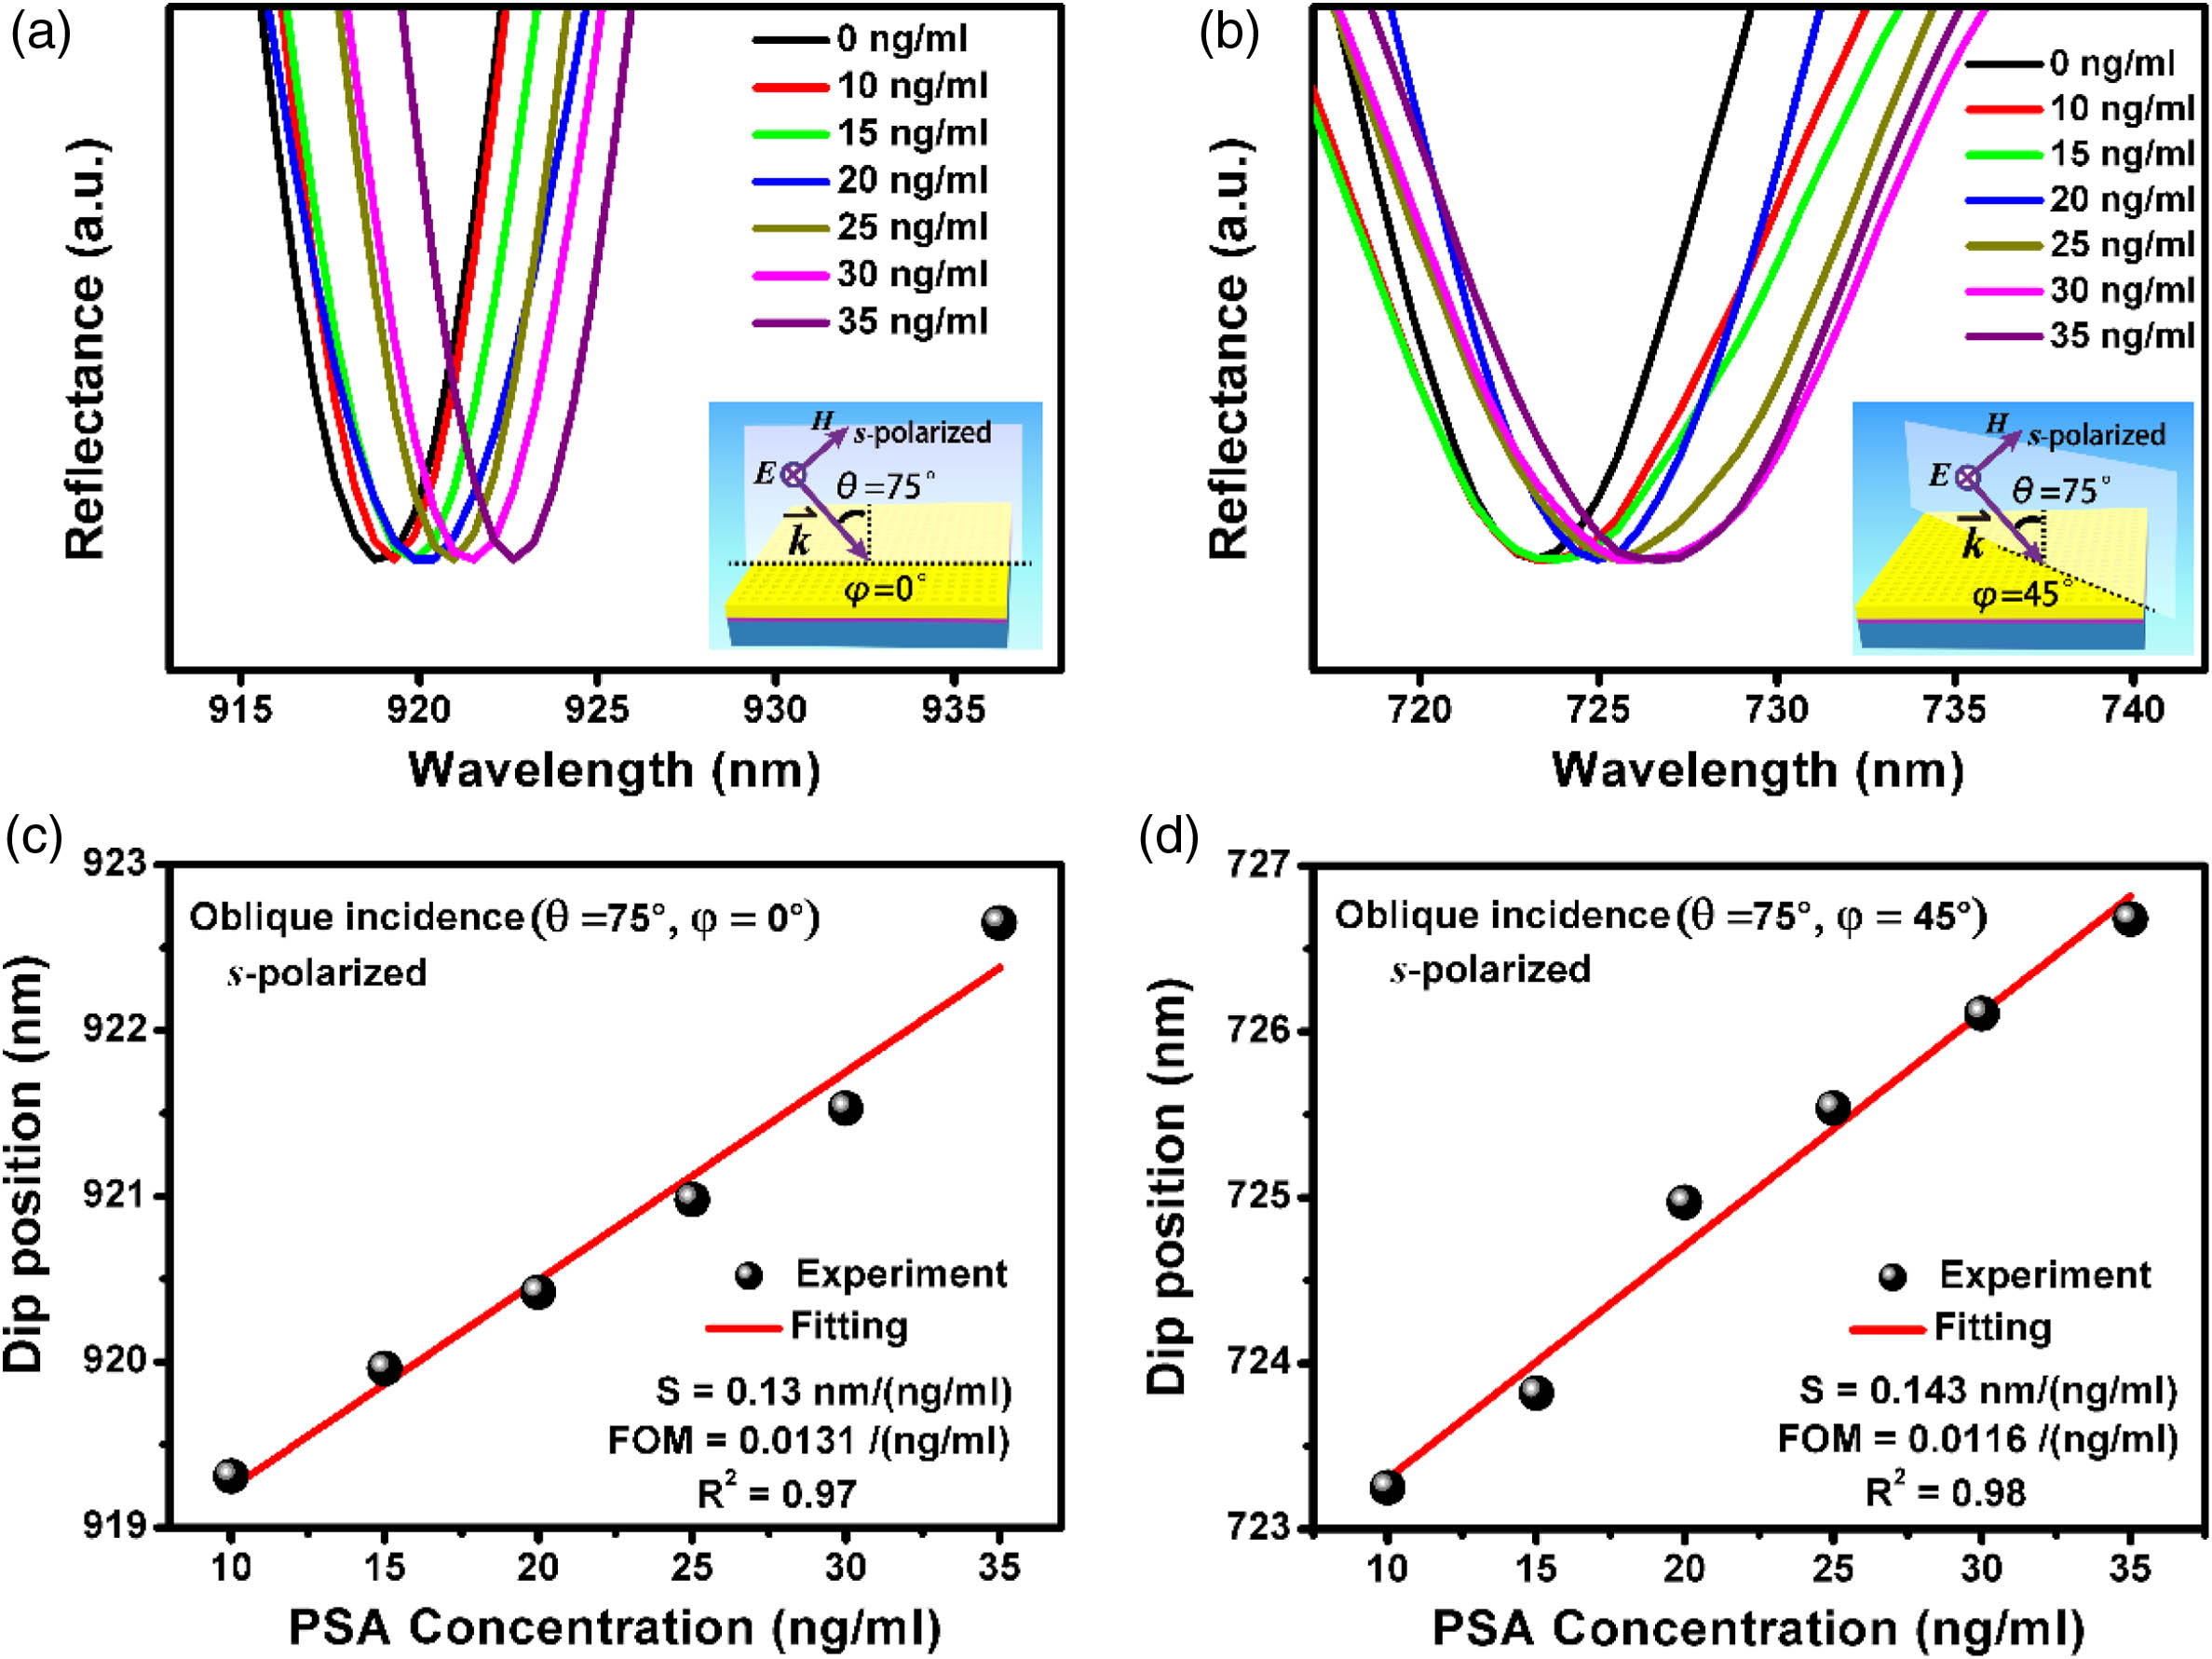
Fig. 4. Comparisons of the sensitivity under different azimuthal angles with the s-polarized light. (a), (b) Experimentally measured reflectance spectra with different PSA concentrations ranging from 10 to 35 ng/mL after normalization. Inset: Schematic drawings of excitation configurations. (c), (d) Resonance wavelength positions of plasmonic modes extracted from (a) and (b) as a function of PSA concentration. The S and R2 denote the sensitivity and the correlation coefficient of the linear fitting, respectively. Note that the FWHM values are about 10 nm and 12 nm in (a) and (b), respectively.

下载图片 查看所有图片

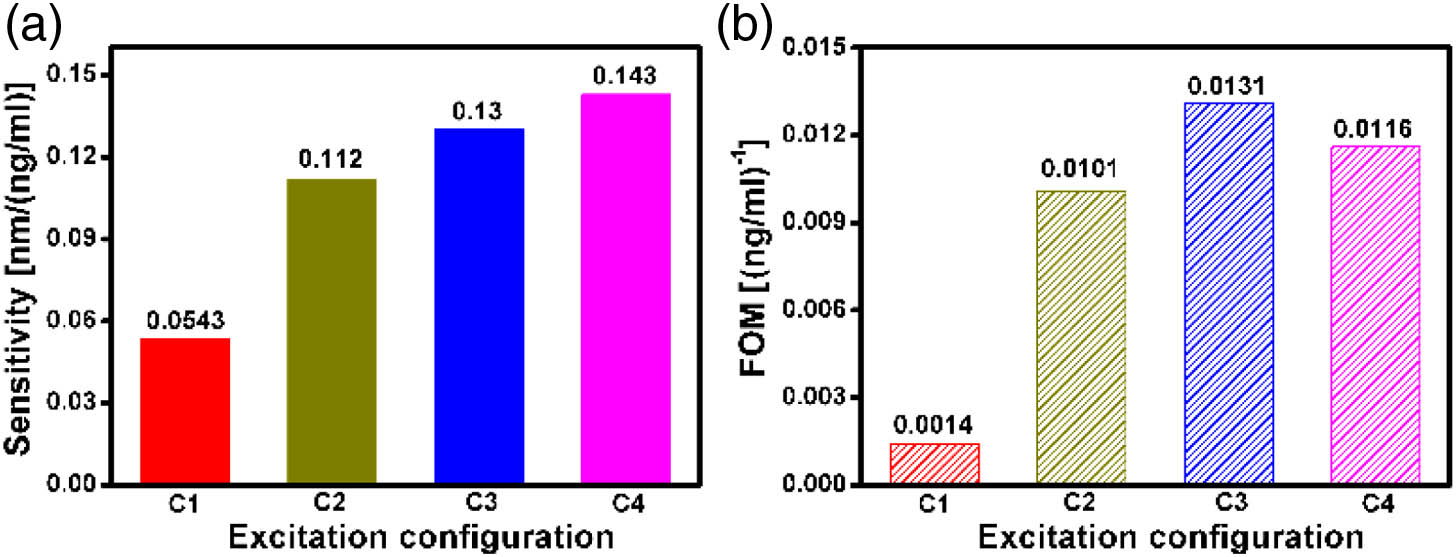
Comparisons of biosensing performance under different excitation configurations are summarized in Table 1 and are also conveniently illustrated in Fig. 5, in which we are capable of systematically comparing and rationally screening the optimal one. Continuous improvements of the sensitivity can be seen from C1 to C4 [Fig. 5(a)], whereas the FOM is first enhanced greatly from C1 to C3 and then begins to reduce from C3 to C4 [Fig. 5(b)]. Among those sensing performances, we achieve 3 and 9 times enhancements of the sensitivity and FOM under C4 and C3 in comparison with C1, respectively, indicating that we can choose the C4 configuration when pursuing the sensitivity and the C3 for the demand on FOM. Based on the above results, we find that the manipulation of optical incident angle and polarization on plasmonic nanostructures has more advantages than the normal light excitation, which is extensively used in plasmonic biosensing. One can manipulate the incident light to pursue more performance improvements for plasmonic sensing of biomolecules in the future.

Table 1. Comparisons of Biosensing Performance under Different Excitation Configurationsa

Abbr.Excitation ConfigurationSensitivity [nm/(ng/mL)]FOM [(ng/mL)1]
C1Normal incidence, unpolarized, θ=0°0.05340.0014
C2Oblique incidence, unpolarized, θ=75°,φ=0°0.11200.0101
C3Oblique incidence, s-polarized, θ=75°,φ=0°0.13000.0131
C4Oblique incidence, s-polarized, θ=75°,φ=45°0.14300.0116

查看所有表

Fig. 5. Comparisons of the (a) sensitivity and (b) FOM under different excitation configurations. The C1, C2, C3, and C4 represent corresponding configurations explicated in Table 1.

下载图片 查看所有图片

Additionally, this study also features several advantages for practical applications. First, plasmonic characteristics such as resonance wavelength, linewidth, and intensity can be conveniently tuned in a broadband covering the visible and near IR range. Assuming that the material is replaced to aluminum, the spectral band is capable of covering the ultraviolet range [48]. Second, the working wavelength of the optimal sensitivity lies in the visible range, which facilitates the use of low-cost detecting devices such as a charge-coupled digital camera. Third, the concentration of PSA detected in our biosensing experiment can be as low as 10 ng/mL, beyond the threshold concentration of 20 ng/mL in the early cancer prediction. Furthermore, under the excitation condition of C4, highly confined and enhanced electromagnetic fields can be formed around the corner of the nanohole [40,49], indicating the potential of our approach for single-molecule sensing [50,51].

3. CONCLUSION

In conclusion, we have systematically investigated the plasmonic effects of Au nanohole arrays through changing excitation conditions, such as the incident angle, azimuthal angle, and polarization. Importantly, an abrupt shrinking effect of resonance linewidth originated from the interference of two degenerate SPP modes in the ΓM direction has been revealed. Moreover, we have demonstrated the biosensing capability for detecting the molecular biomarker of prostatic carcinoma under different excitation conditions, and achieved the maximum sensitivity in the ΓM direction. Our study may deepen the understanding of plasmonic resonance-linewidth shrinking, and offer a promising strategy for improving biosensing performance significantly.

4. MATERIALS AND METHODS

4.1 A. Sample Fabrication

The clean silicon wafer was prepared after the standard cleaning procedure detailed previously. Then the wafer was dried and baked in an oven at 150°C for 2 h. After drying, the Si wafer was spin-coated with the photoresist (Tu-170, Obducat, Sweden) for 200 nm. Afterwards, the spin-coated wafer was processed with the nanoimprint system. Then, the 2  nm chromium and 100  nm gold layers were deposited sequentially with an electron-beam evaporation system (FC2000, Temescal). The depth of the hole is set as 180  nm after optimization.

4.2 B. Characterizations

Normal incidence and oblique angle-resolved reflectance spectra were measured by a lab-built system, mainly including a light source (AvaLight-DH-S-BAL, Avantes), a portable UV-visible-NIR spectrometer (AvaSpec-NIR256/512-1, Avantes), and a film polarizer (LPVISE2X2, Thorlabs). The morphology of the array was characterized by scanning an electron microscope (S-4800, Hitachi).

4.3 C. Simulation

The theoretical reflection spectrum (Appendix B) under normal incidence was computed by the 3D-FDTD method (FDTD Solutions 8.7, Lumerical). The electric-field amplitude was set as 1.0 V/m. To ensure the calculation convergence, the simulation time was set to 3000 fs. For saving the computation time without losing the precision, a nonuniform mesh method was adopted, and the Yee cell size in regions of the hole and the nearby air was set as 0.5  nm×0.5  nm×0.5  nm whereas 1  nm×1  nm×1  nm Yee cell size was set for other regions. Perfectly matched layers were adopted as the upper and lower boundary conditions. The optical constant of gold was taken from the literature [52]. We note that, for simplicity, the resist layer was not considered in the simulation.

5 Acknowledgment

Acknowledgment. The authors would like to thank Prof. Martin Moskovits and Dr. Feng Zhao for helpful discussions.

References

[1] M. Moskovits. Surface-enhanced spectroscopy. Rev. Mod. Phys., 1985, 57: 783-826.

[2] MaierS. A., “Plasmonics: Fundamentals and Applications,” (Springer, 2007).

[3] S. I. Azzam, V. M. Shalaev, A. Boltasseva, A. V. Kildishev. Formation of bound states in the continuum in hybrid plasmonic-photonic systems. Phys. Rev. Lett., 2018, 121: 253901.

[4] X. Tian, Z.-Y. Li. Visible-near infrared ultra-broadband polarization-independent metamaterial perfect absorber involving phase-change materials. Photon. Res., 2016, 4: 146-152.

[5] L. Meng, M. Sun. Tip-enhanced photoluminescence spectroscopy of monolayer MoS2. Photon. Res., 2017, 5: 745-749.

[6] J. R. Hendrickson, S. Vangala, C. Dass, R. Gibson, J. Goldsmith, K. Leedy, D. E. Walker, J. W. Cleary, W. Kim, J. Guo. Coupling of epsilon-near-zero mode to gap plasmon mode for flat-top wideband perfect light absorption. ACS Photon., 2018, 5: 776-781.

[7] L. N. Zhou, D. F. Swearer, C. Zhang, H. Robatjazi, H. Q. Zhao, L. Henderson, L. L. Dong, P. Christopher, E. A. Carter, P. Nordlander, N. J. Halas. Quantifying hot carrier and thermal contributions in plasmonic photocatalysis. Science, 2018, 362: 69-72.

[8] J. C. Dong, X. G. Zhang, V. Briega Martos, X. Jin, J. Yang, S. Chen, Z. L. Yang, D. Y. Wu, J. M. Feliu, C. T. Williams, Z. Q. Tian, J. F. Li. In situ Raman spectroscopic evidence for oxygen reduction reaction intermediates at platinum single-crystal surfaces. Nat. Energy, 2019, 4: 60-67.

[9] J. Y. Zhou, F. Tao, J. F. Zhu, S. W. Lin, Z. Y. Wang, X. Wang, J. Y. Ou, Y. Li, Q. H. Liu. Portable tumor biosensing of serum by plasmonic biochips in combination with nanoimprint and microfluidics. Nanophotonics, 2019, 8: 307-316.

[10] J. Zhu, Z. Wang, S. Lin, S. Jiang, X. Liu, S. Guo. Low-cost flexible plasmonic nanobump metasurfaces for label-free sensing of serum tumor marker. Biosens. Bioelectron., 2020, 150: 111905.

[11] L. R. Hirsch, R. J. Stafford, J. A. Bankson, S. R. Sershen, B. Rivera, R. E. Price, J. D. Hazle, N. J. Halas, J. L. West. Nanoshell-mediated near-infrared thermal therapy of tumors under magnetic resonance guidance. Proc. Natl. Acad. Sci. USA, 2003, 100: 13549-13554.

[12] H. A. Atwater, A. Polman. Plasmonics for improved photovoltaic devices. Nat. Mater., 2010, 9: 205-213.

[13] M. W. Knight, H. Sobhani, P. Nordlander, N. J. Halas. Photodetection with active optical antennas. Science, 2011, 332: 702-704.

[14] K. V. Sreekanth, Y. Alapan, M. ElKabbash, E. Ilker, M. Hinczewski, U. A. Gurkan, A. De Luca, G. Strangi. Extreme sensitivity biosensing platform based on hyperbolic metamaterials. Nat. Mater., 2016, 15: 621-627.

[15] Y. Shen, J. H. Zhou, T. R. Liu, Y. T. Tao, R. B. Jiang, M. X. Liu, G. H. Xiao, J. H. Zhu, Z. K. Zhou, X. H. Wang, C. J. Jin, J. F. Wang. Plasmonic gold mushroom arrays with refractive index sensing figures of merit approaching the theoretical limit. Nat. Commun., 2013, 4: 2381.

[16] C. Clavero. Plasmon-induced hot-electron generation at nanoparticle/metal-oxide interfaces for photovoltaic and photocatalytic devices. Nat. Photonics, 2014, 8: 95-103.

[17] D. Y. Lei, J. Li, A. I. Fernández-Domínguez, H. C. Ong, S. A. Maier. Geometry dependence of surface plasmon polariton lifetimes in nanohole arrays. ACS Nano, 2010, 4: 432-438.

[18] B. W. Liu, S. Chen, J. C. Zhang, X. Yao, J. H. Zhong, H. X. Lin, T. H. Huang, Z. L. Yang, J. F. Zhu, S. Liu, C. Lienau, L. Wang, B. Ren. A plasmonic sensor array with ultrahigh figures of merit and resonance linewidths down to 3  nm. Adv. Mater., 2018, 30: 1706031.

[19] J. Guo, Z. Li, H. Guo. Near perfect light trapping in a 2D gold nanotrench grating at oblique angles of incidence and its application for sensing. Opt. Express, 2016, 24: 17259-17271.

[20] A. Dmitriev, C. Hägglund, S. Chen, H. Fredriksson, T. Pakizeh, M. Käll, D. S. Sutherland. Enhanced nanoplasmonic optical sensors with reduced substrate effect. Nano Lett., 2008, 8: 3893-3898.

[21] N. A. Hatab, C.-H. Hsueh, A. L. Gaddis, S. T. Retterer, J.-H. Li, G. Eres, Z. Zhang, B. Gu. Free-standing optical gold bowtie nanoantenna with variable gap size for enhanced Raman spectroscopy. Nano Lett., 2010, 10: 4952-4955.

[22] F. Yesilkoy, E. R. Arvelo, Y. Jahani, M. Liu, A. Tittl, V. Cevher, Y. Kivshar, H. Altug. Ultrasensitive hyperspectral imaging and biodetection enabled by dielectric metasurfaces. Nat. Photonics, 2019, 13: 390-396.

[23] J. N. Anker, W. P. Hall, O. Lyandres, N. C. Shah, J. Zhao, R. P. Van Duyne. Biosensing with plasmonic nanosensors. Nat. Mater., 2008, 7: 442-453.

[24] D. Garoli, E. Calandrini, G. Giovannini, A. Hubarevich, V. Caligiuri, F. De Angelis. Nanoporous gold metamaterials for high sensitivity plasmonic sensing. Nanoscale Horiz., 2019, 4: 1153-1157.

[25] V. G. Kravets, F. Schedin, R. Jalil, L. Britnell, R. V. Gorbachev, D. Ansell, B. Thackray, K. S. Novoselov, A. K. Geim, A. V. Kabashin, A. N. Grigorenko. Singular phase nano-optics in plasmonic metamaterials for label-free single-molecule detection. Nat. Mater., 2013, 12: 304-309.

[26] S.-D. Liu, X. Qi, W.-C. Zhai, Z.-H. Chen, W.-J. Wang, J.-B. Han. Polarization state-based refractive index sensing with plasmonic nanostructures. Nanoscale, 2015, 7: 20171-20179.

[27] R. Verre, N. Maccaferri, K. Fleischer, M. Svedendahl, N. Odebo Länk, A. Dmitriev, P. Vavassori, I. V. Shvets, M. Käll. Polarization conversion-based molecular sensing using anisotropic plasmonic metasurfaces. Nanoscale, 2016, 8: 10576-10581.

[28] H.-H. Jeong, A. G. Mark, M. Alarcón-Correa, I. Kim, P. Oswald, T.-C. Lee, P. Fischer. Dispersion and shape engineered plasmonic nanosensors. Nat. Commun., 2016, 7: 11331.

[29] N. Maccaferri, K. E. Gregorczyk, T. V. A. G. de Oliveira, M. Kataja, S. van Dijken, Z. Pirzadeh, A. Dmitriev, J. Åkerman, M. Knez, P. Vavassori. Ultrasensitive and label-free molecular-level detection enabled by light phase control in magnetoplasmonic nanoantennas. Nat. Commun., 2015, 6: 6150.

[30] B. Caballero, A. García-Martín, J. C. Cuevas. Hybrid magnetoplasmonic crystals boost the performance of nanohole arrays as plasmonic sensors. ACS Photon., 2016, 3: 203-208.

[31] A. B. Evlyukhin, C. Reinhardt, A. Seidel, B. S. Luk’yanchuk, B. N. Chichkov. Optical response features of Si-nanoparticle arrays. Phys. Rev. B, 2010, 82: 045404.

[32] J. H. Yang, Q. Sun, K. Ueno, X. Shi, T. Oshikiri, H. Misawa, Q. H. Gong. Manipulation of the dephasing time by strong coupling between localized and propagating surface plasmon modes. Nat. Commun., 2018, 9: 4858.

[33] R. Ameling, H. Giessen. Cavity plasmonics: large normal mode splitting of electric and magnetic particle plasmons induced by a photonic microcavity. Nano Lett., 2010, 10: 4394-4398.

[34] S. Malynych, G. Chumanov. Light-induced coherent interactions between silver nanoparticles in two-dimensional arrays. J. Am. Chem. Soc., 2003, 125: 2896-2898.

[35] Y. Hua, A. K. Fumani, T. W. Odom. Tunable lattice plasmon resonances in 1D nanogratings. ACS Photon., 2019, 6: 322-326.

[36] D. Wang, W. Wang, M. P. Knudson, G. C. Schatz, T. W. Odom. Structural engineering in plasmon nanolasers. Chem. Rev., 2018, 118: 2865-2881.

[37] W. L. Barnes, T. W. Preist, S. C. Kitson, J. R. Sambles. Physical origin of photonic energy gaps in the propagation of surface plasmons on gratings. Phys. Rev. B, 1996, 54: 6227-6244.

[38] W. L. Barnes, A. Dereux, T. W. Ebbesen. Surface plasmon subwavelength optics. Nature, 2003, 424: 824-830.

[39] Z. L. Cao, H. C. Ong. Momentum-dependent group velocity of surface plasmon polaritons in two-dimensional metallic nanohole array. Opt. Express, 2016, 24: 12489-12500.

[40] Z. L. Cao, L. Y. Yiu, Z. Q. Zhang, C. T. Chan, H. C. Ong. Understanding the role of surface plasmon polaritons in two-dimensional achiral nanohole arrays for polarization conversion. Phys. Rev. B, 2017, 95: 155415.

[41] Z. L. Cao, H. C. Ong. Study of the momentum-resolved plasmonic field energy of Bloch-like surface plasmon polaritons from periodic nanohole array. Opt. Express, 2017, 25: 30626-30635.

[42] M. Lin, Z. L. Cao, H. C. Ong. Determination of the excitation rate of quantum dots mediated by momentum-resolved Bloch-like surface plasmon polaritons. Opt. Express, 2017, 25: 6092-6103.

[43] M. Gao, Y. He, Y. Chen, T. M. Shih, W. Yang, J. Wang, F. Zhao, M. D. Li, H. Chen, Z. Yang. Tunable surface plasmon polaritons and ultrafast dynamics in 2D nanohole arrays. Nanoscale, 2019, 11: 16428-16436.

[44] C. Genet, T. W. Ebbesen. Light in tiny holes. Nature, 2007, 445: 39-46.

[45] H. W. Gao, W. Zhou, T. W. Odom. Plasmonic crystals: a platform to catalog resonances from ultraviolet to near-infrared wavelengths in a plasmonic library. Adv. Funct. Mater., 2010, 20: 529-539.

[46] D. S. Kim, S. C. Hohng, V. Malyarchuk, Y. C. Yoon, Y. H. Ahn, K. J. Yee, J. W. Park, J. Kim, Q. H. Park, C. Lienau. Microscopic origin of surface-plasmon radiation in plasmonic band-gap nanostructures. Phys. Rev. Lett., 2003, 91: 143901.

[47] J. Zhu, X. Chen, Y. Xie, J.-Y. Ou, H. Chen, Q. H. Liu. Imprinted plasmonic measuring nanocylinders for nanoscale volumes of materials. Nanophotonics, 2020, 9: 167-176.

[48] J. Zheng, W. Yang, J. Wang, J. Zhu, L. Qian, Z. Yang. An ultranarrow SPR linewidth in the UV region for plasmonic sensing. Nanoscale, 2019, 11: 4061-4066.

[49] M. Gao, Y. He, Y. Chen, T.-M. Shih, W. Yang, H. Chen, Z. Yang, Z. Wang. Enhanced sum frequency generation for ultrasensitive characterization of plasmonic modes. Nanophotonics, 2020, 9: 815-822.

[50] A. B. Dahlin. Sensing applications based on plasmonic nanopores: the hole story. Analyst, 2015, 140: 4748-4759.

[51] D. Garoli, H. Yamazaki, N. Maccaferri, M. Wanunu. Plasmonic nanopores for single-molecule detection and manipulation: toward sequencing applications. Nano Lett., 2019, 19: 7553-7562.

[52] P. B. Johnson. Optical constants of the noble metals. Phys. Rev. B, 1972, 6: 4370-4379.

[53] C. Zhao, J. Chen, H. Li, T. Li, S. Zhu. Mode division multiplexed holography by out-of-plane scattering of plasmon/guided modes. Chin. Opt. Lett., 2018, 16: 070901.

[54] F. Gan, C. Sun, H. Li, Q. Gong, J. Chen. On-chip polarization splitter based on a multimode plasmonic waveguide. Photon. Res., 2018, 6: 47-53.

Min Gao, Weimin Yang, Zhengying Wang, Shaowei Lin, Jinfeng Zhu, Zhilin Yang. Plasmonic resonance-linewidth shrinkage to boost biosensing[J]. Photonics Research, 2020, 8(7): 07001226.


引用该论文: TXT   |   EndNote

相关论文

加载中...

关于本站 Cookie 的使用提示

中国光学期刊网使用基于 cookie 的技术来更好地为您提供各项服务,点击此处了解我们的隐私策略。 如您需继续使用本网站,请您授权我们使用本地 cookie 来保存部分信息。
全站搜索
您最值得信赖的光电行业旗舰网络服务平台!