激光与光电子学进展, 2019, 56 (5): 051404, 网络出版: 2019-07-31
基于热力耦合的激光熔覆数值模拟与实验研究  下载: 1609次
Numerical Simulation and Experimental Research of Laser Cladding Based on Thermo-Mechanical Coupling
图 & 表
图 1. 熔覆层横截面和网格划分。(a)熔覆层横截面;(b)网格划分
Fig. 1. Cross section of cladding layer and meshing. (a) Cross section of cladding layer; (b) meshing
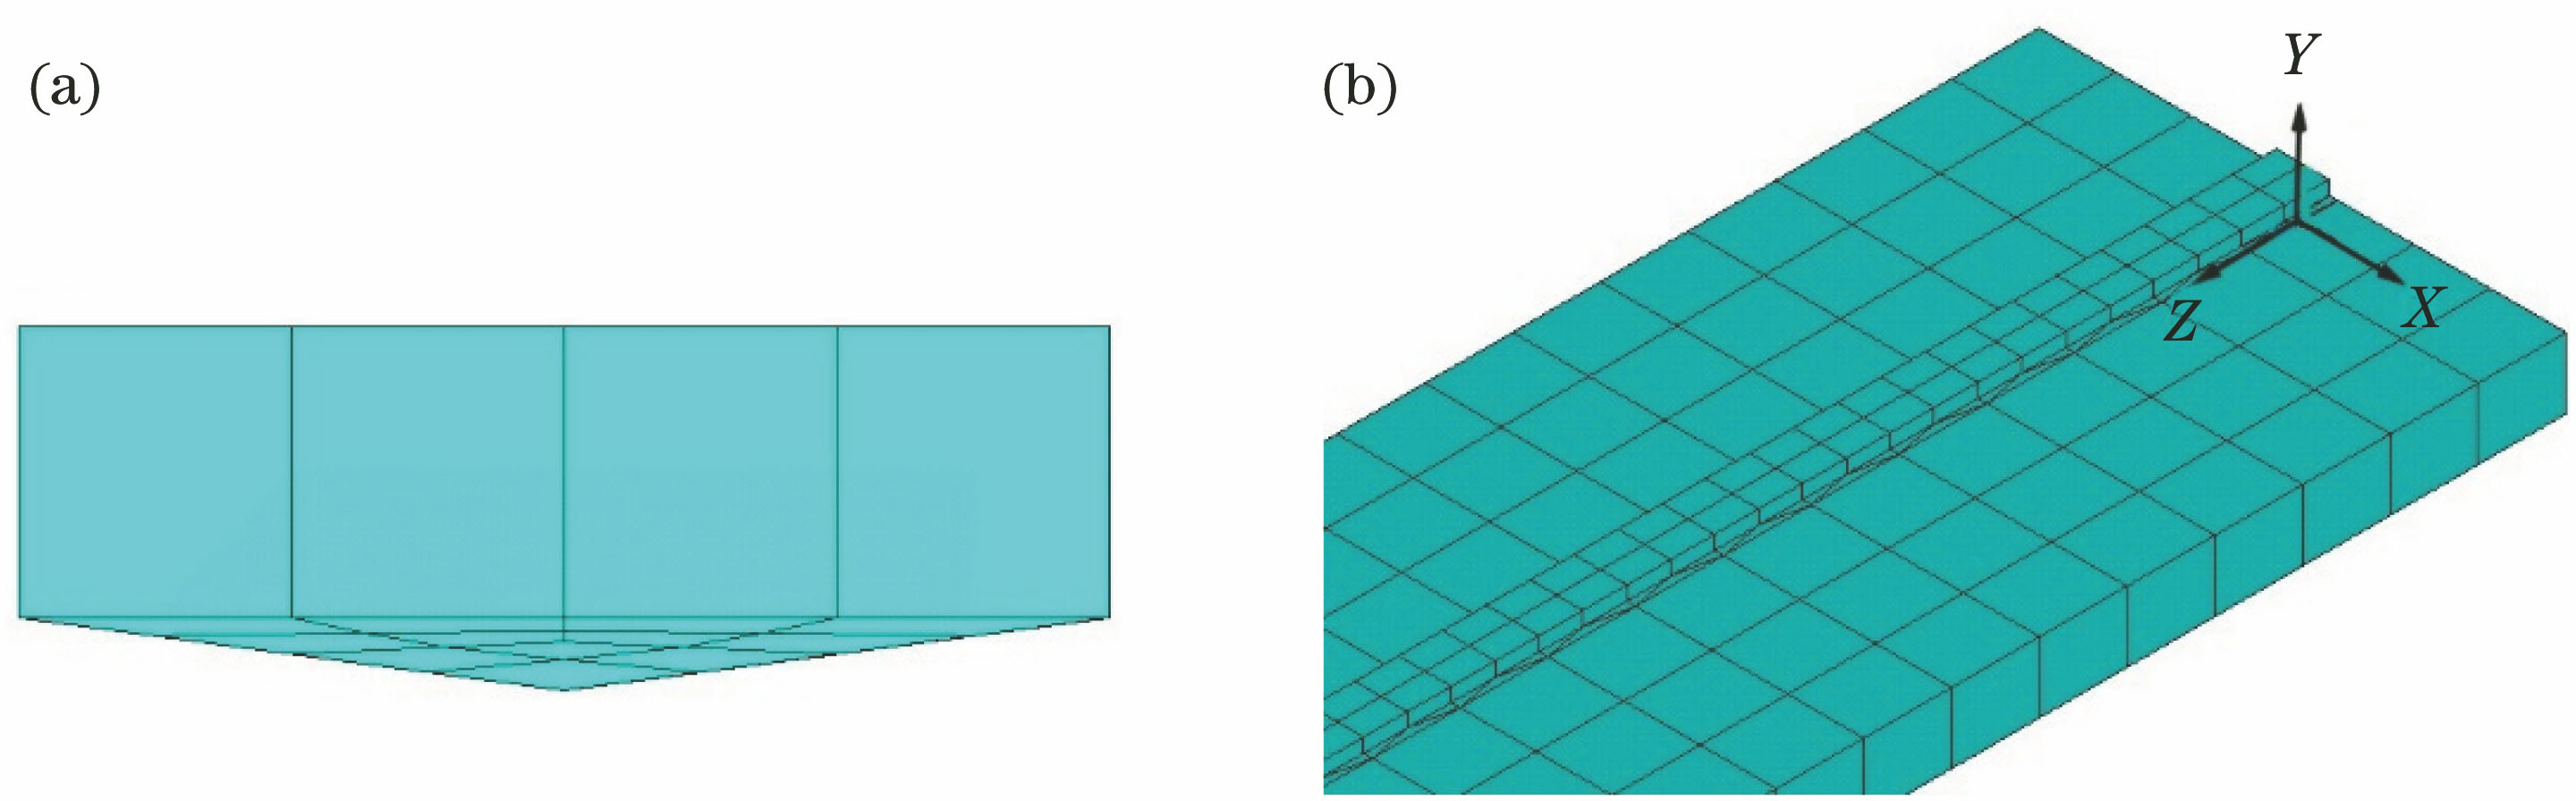
图 2. 总换热系数随温度的变化曲线
Fig. 2. Comprehensive coefficient of heat transfer varing with temperature
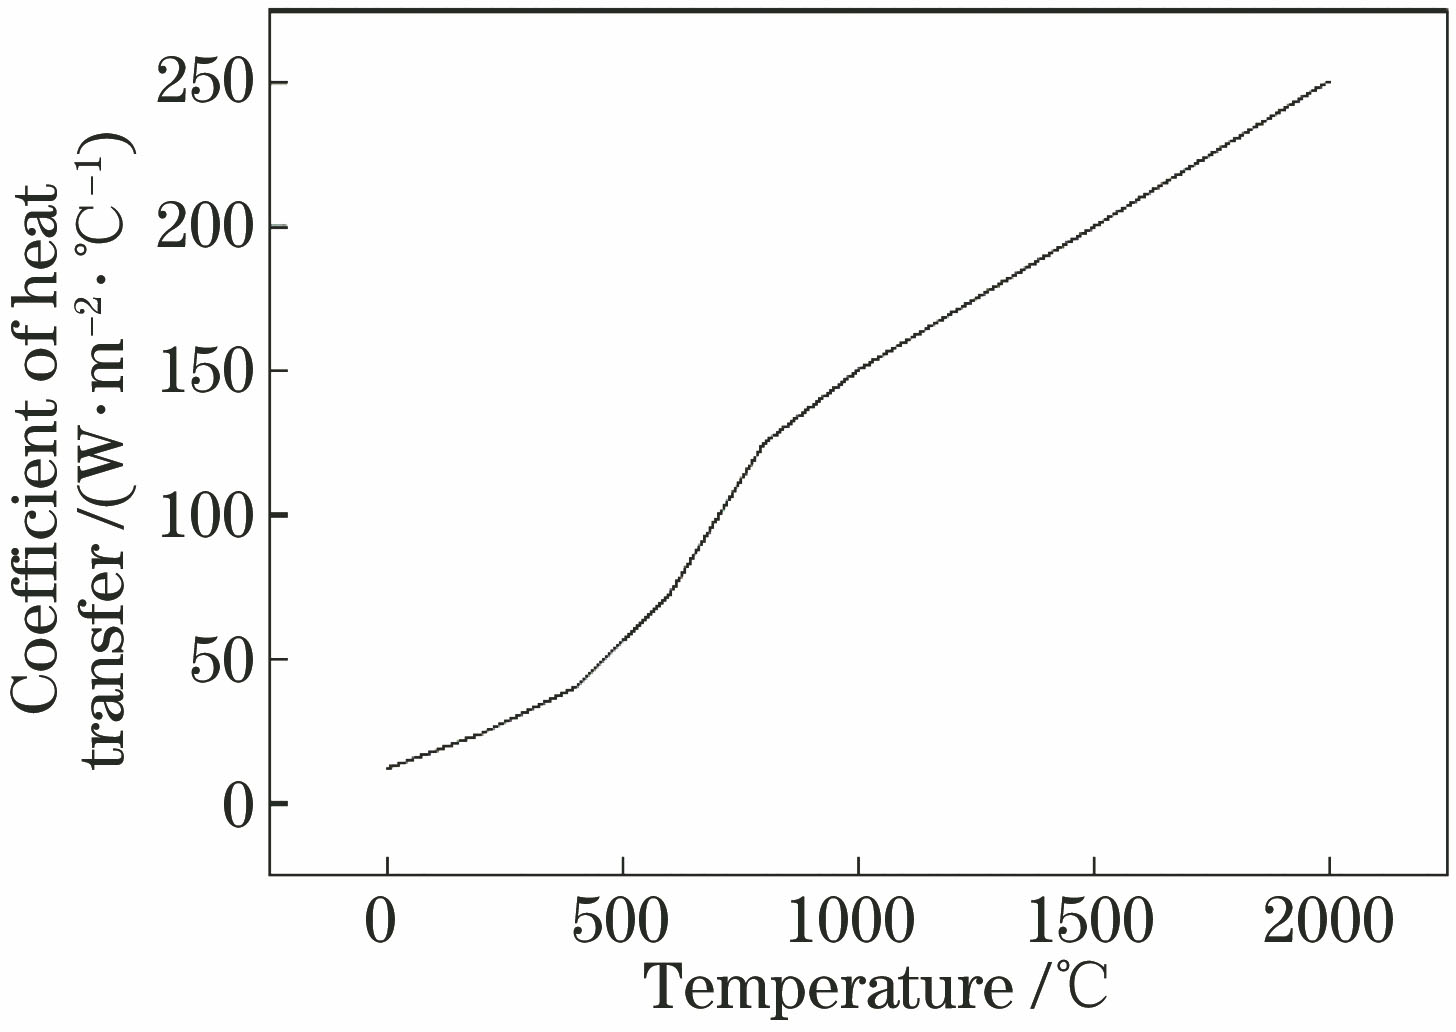
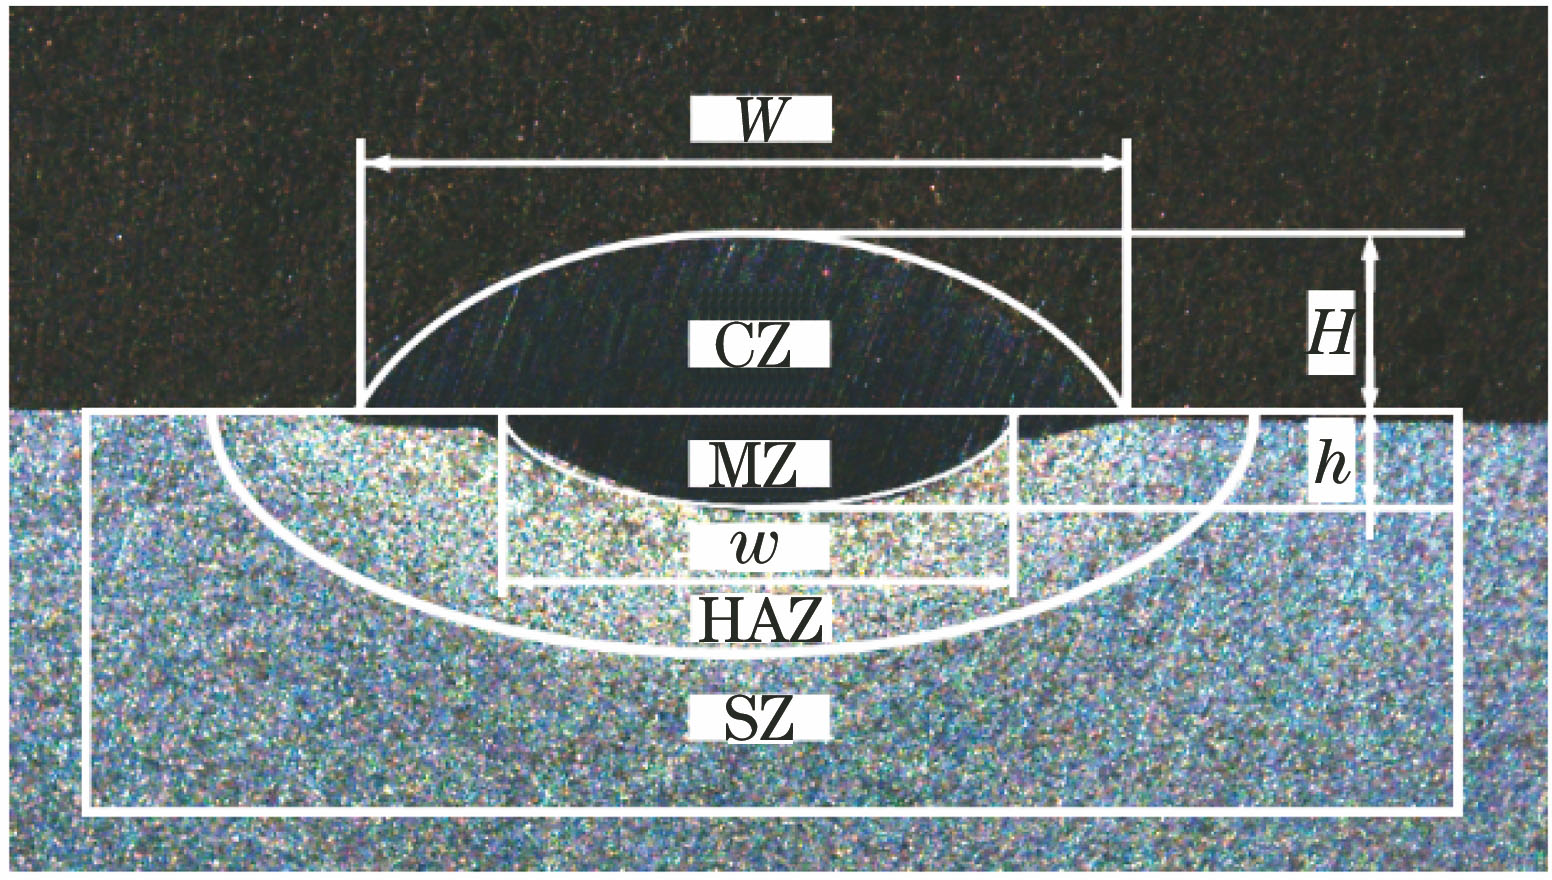
图 4. 温度场与试件金相组织形貌对比
Fig. 4. Comparison between temperature field and metallographic structure of test piece
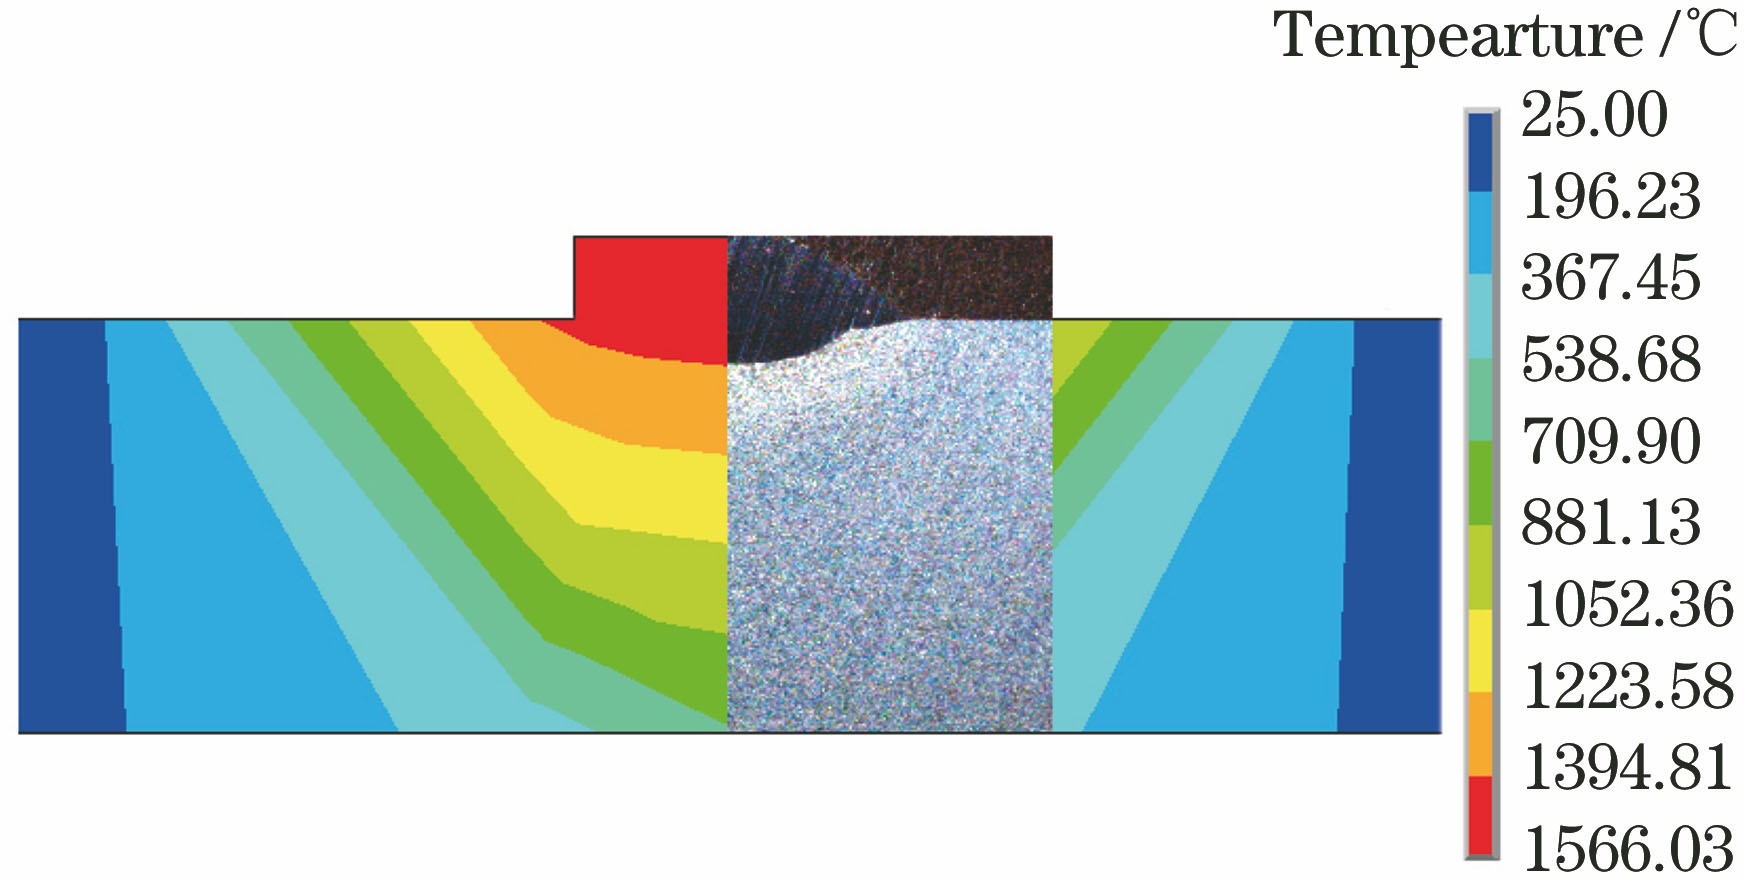
图 5. 激光熔覆温度场。(a)初始;(b)中间;(c)终点;(d)冷却20 s
Fig. 5. Temperature fields of laser cladding. (a) Initial; (b) middle; (c) final; (d) cooling after 20 s
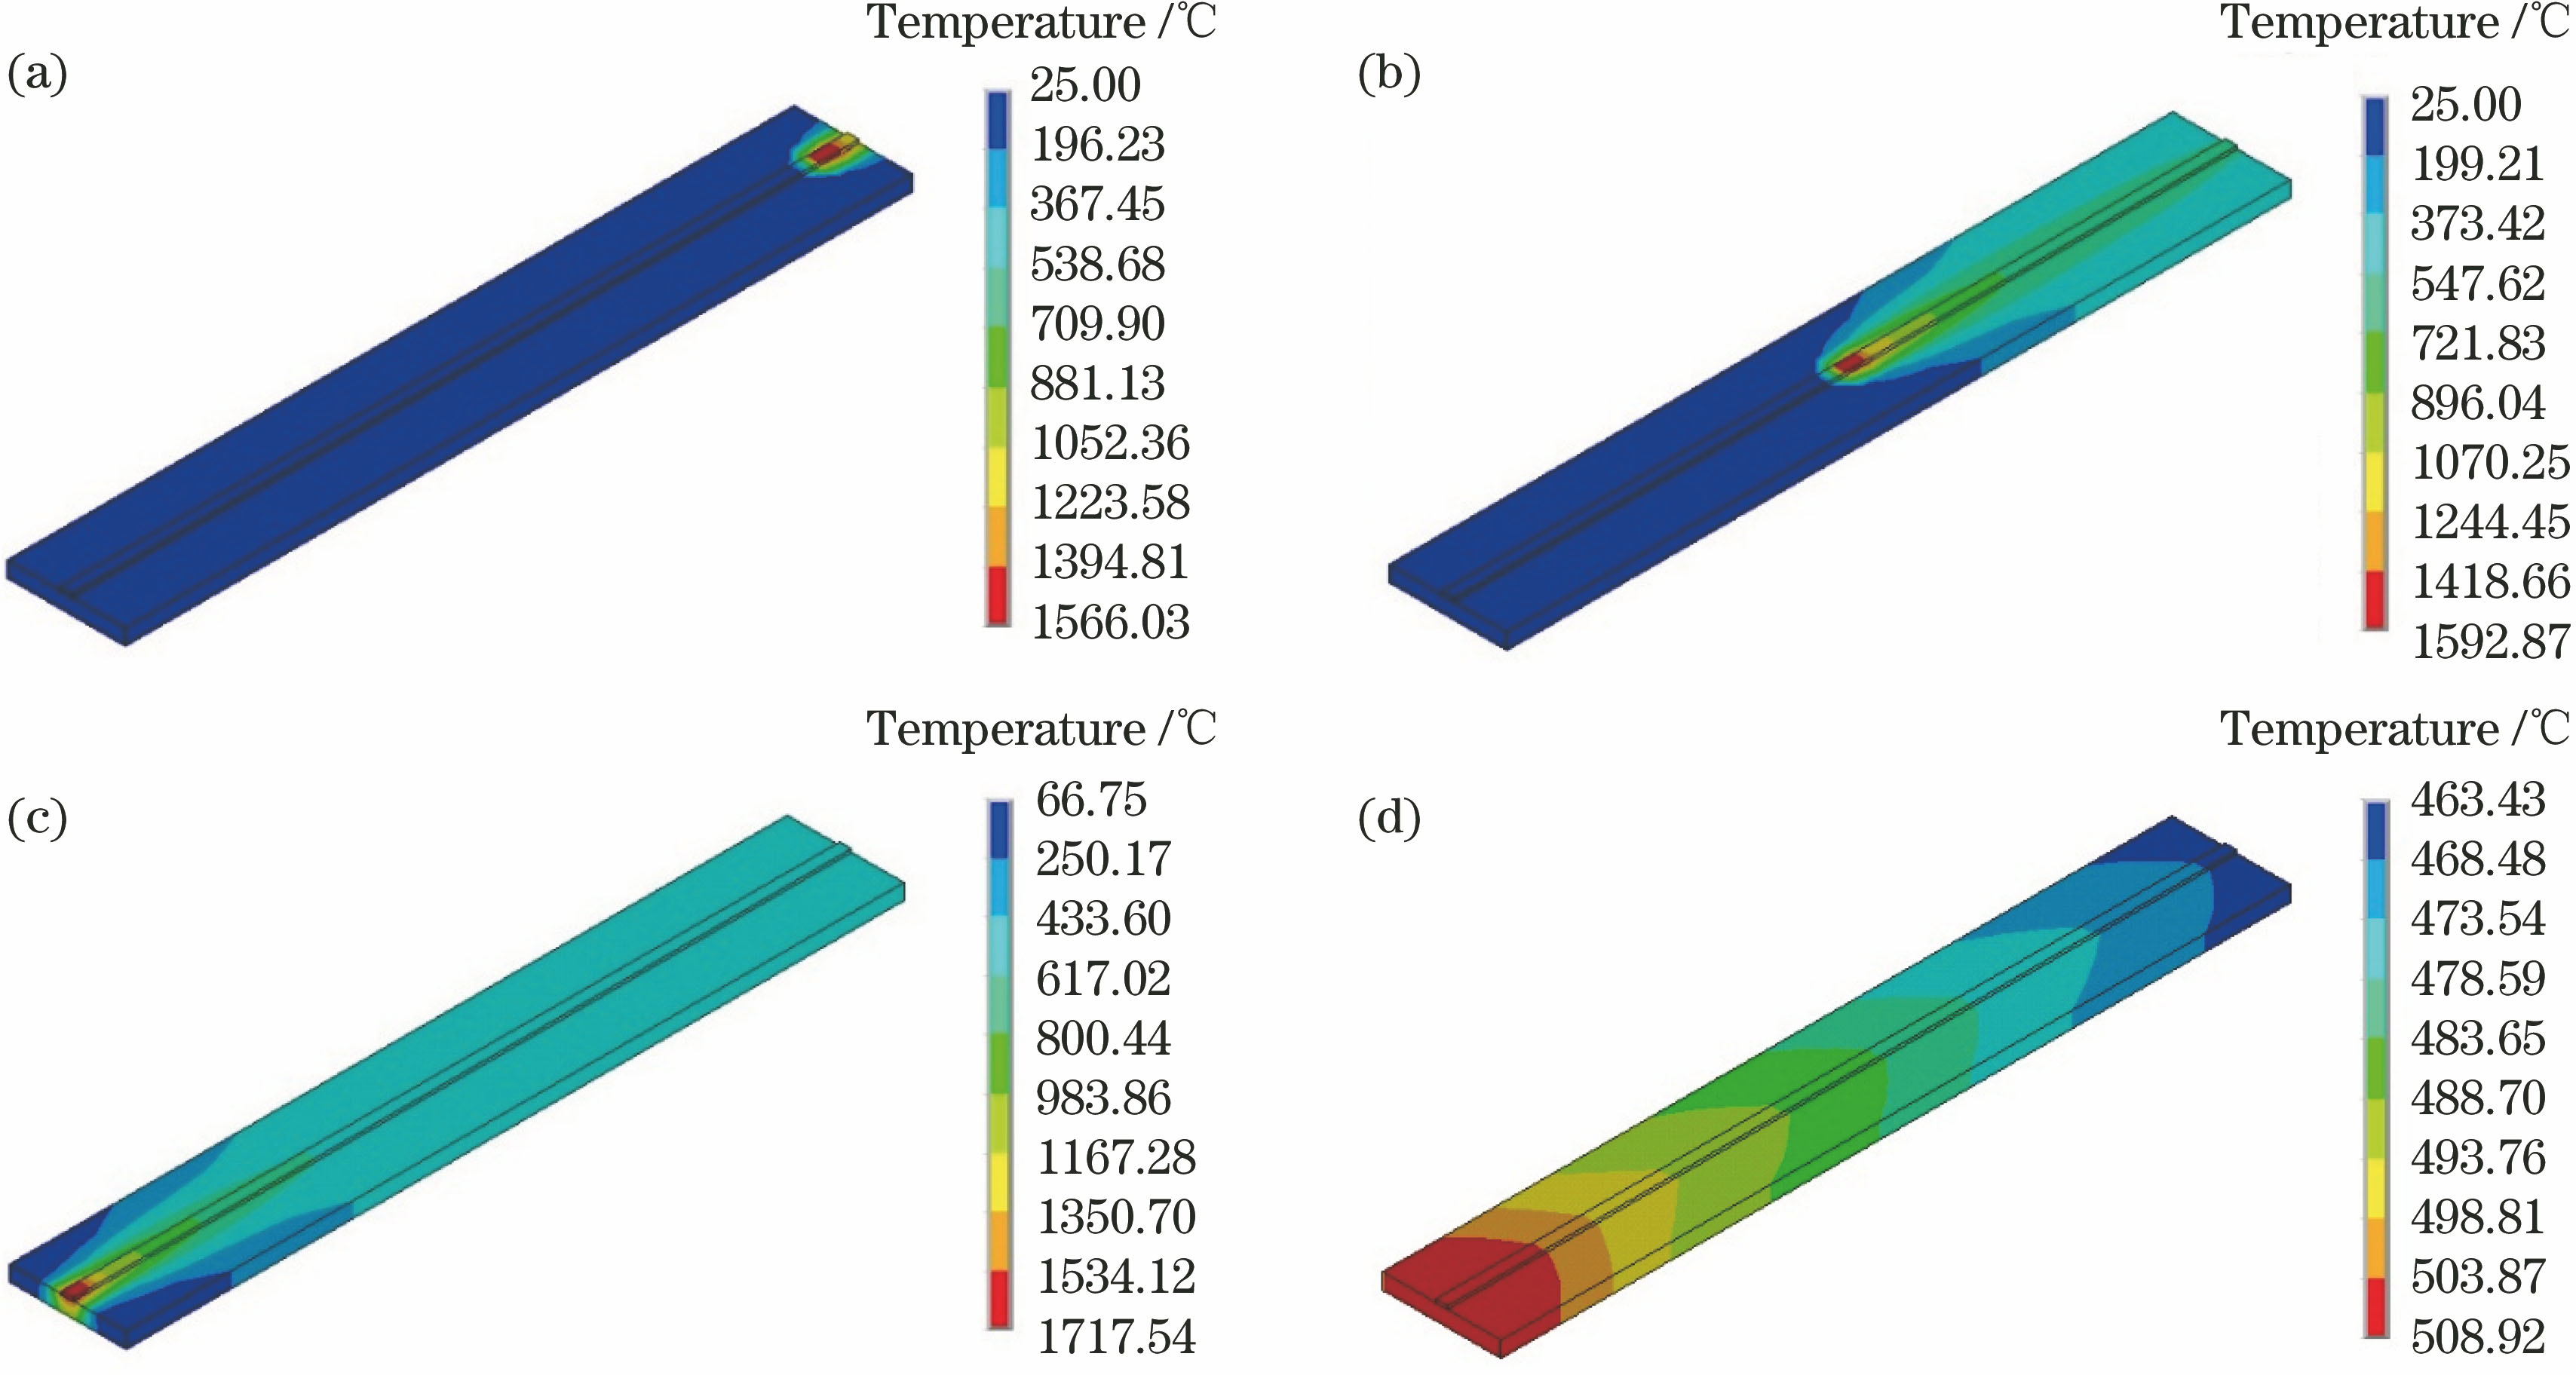
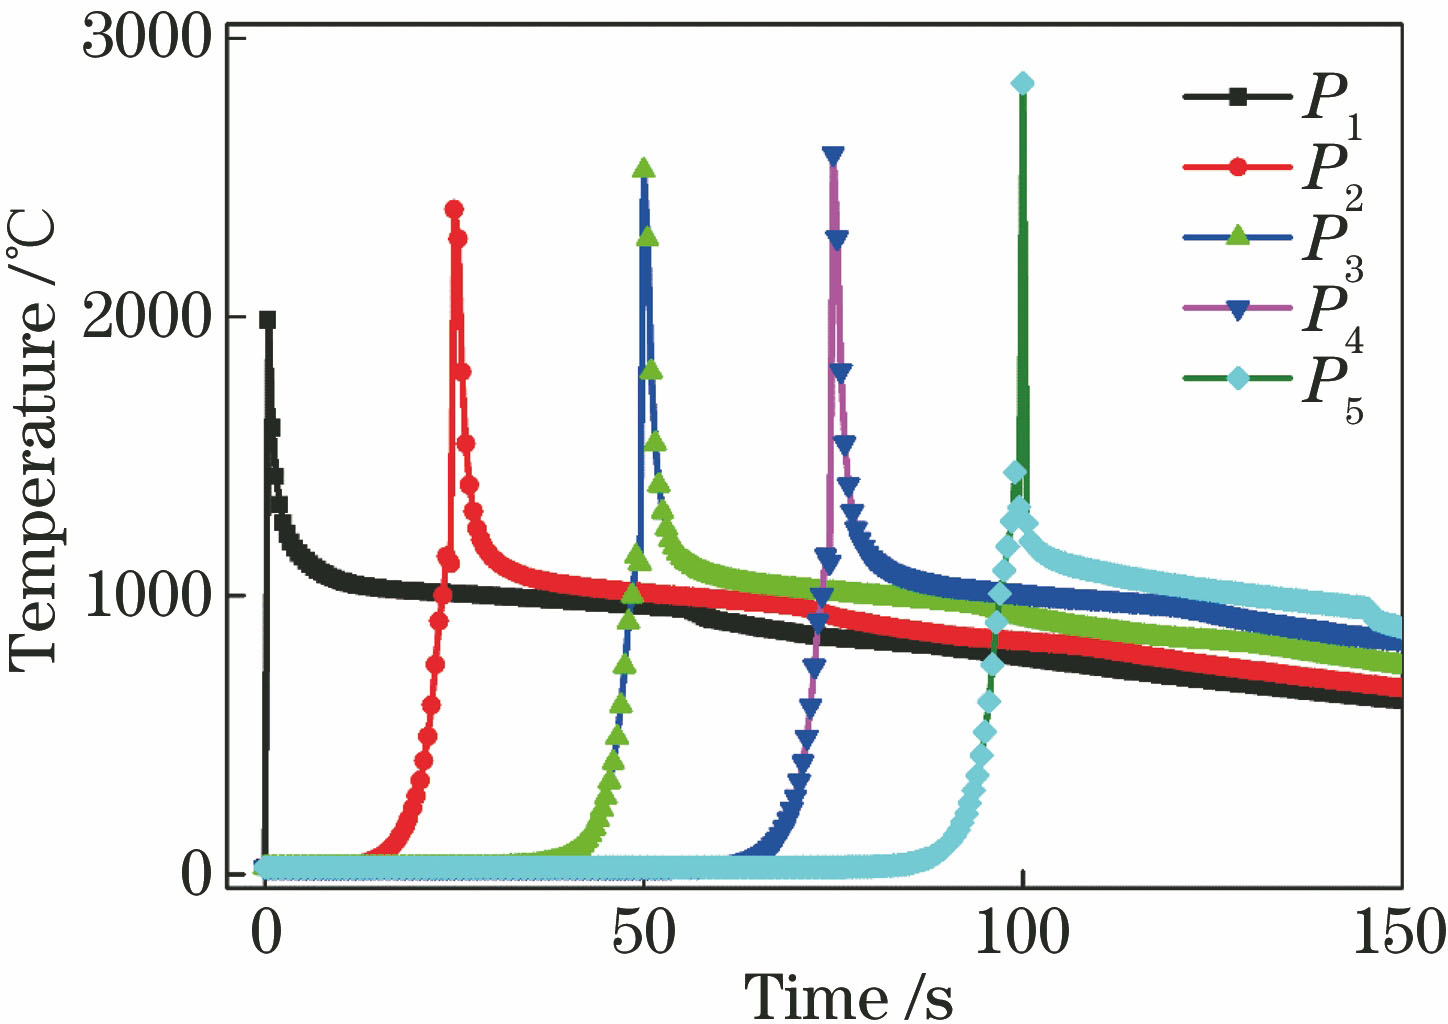
图 7. Von Mises应力云图和位移云图。(a) Von Mises应力;(b)位移
Fig. 7. Von Mises stress nephogram and displacement nephogram. (a) Von Mises stress; (b) displacement
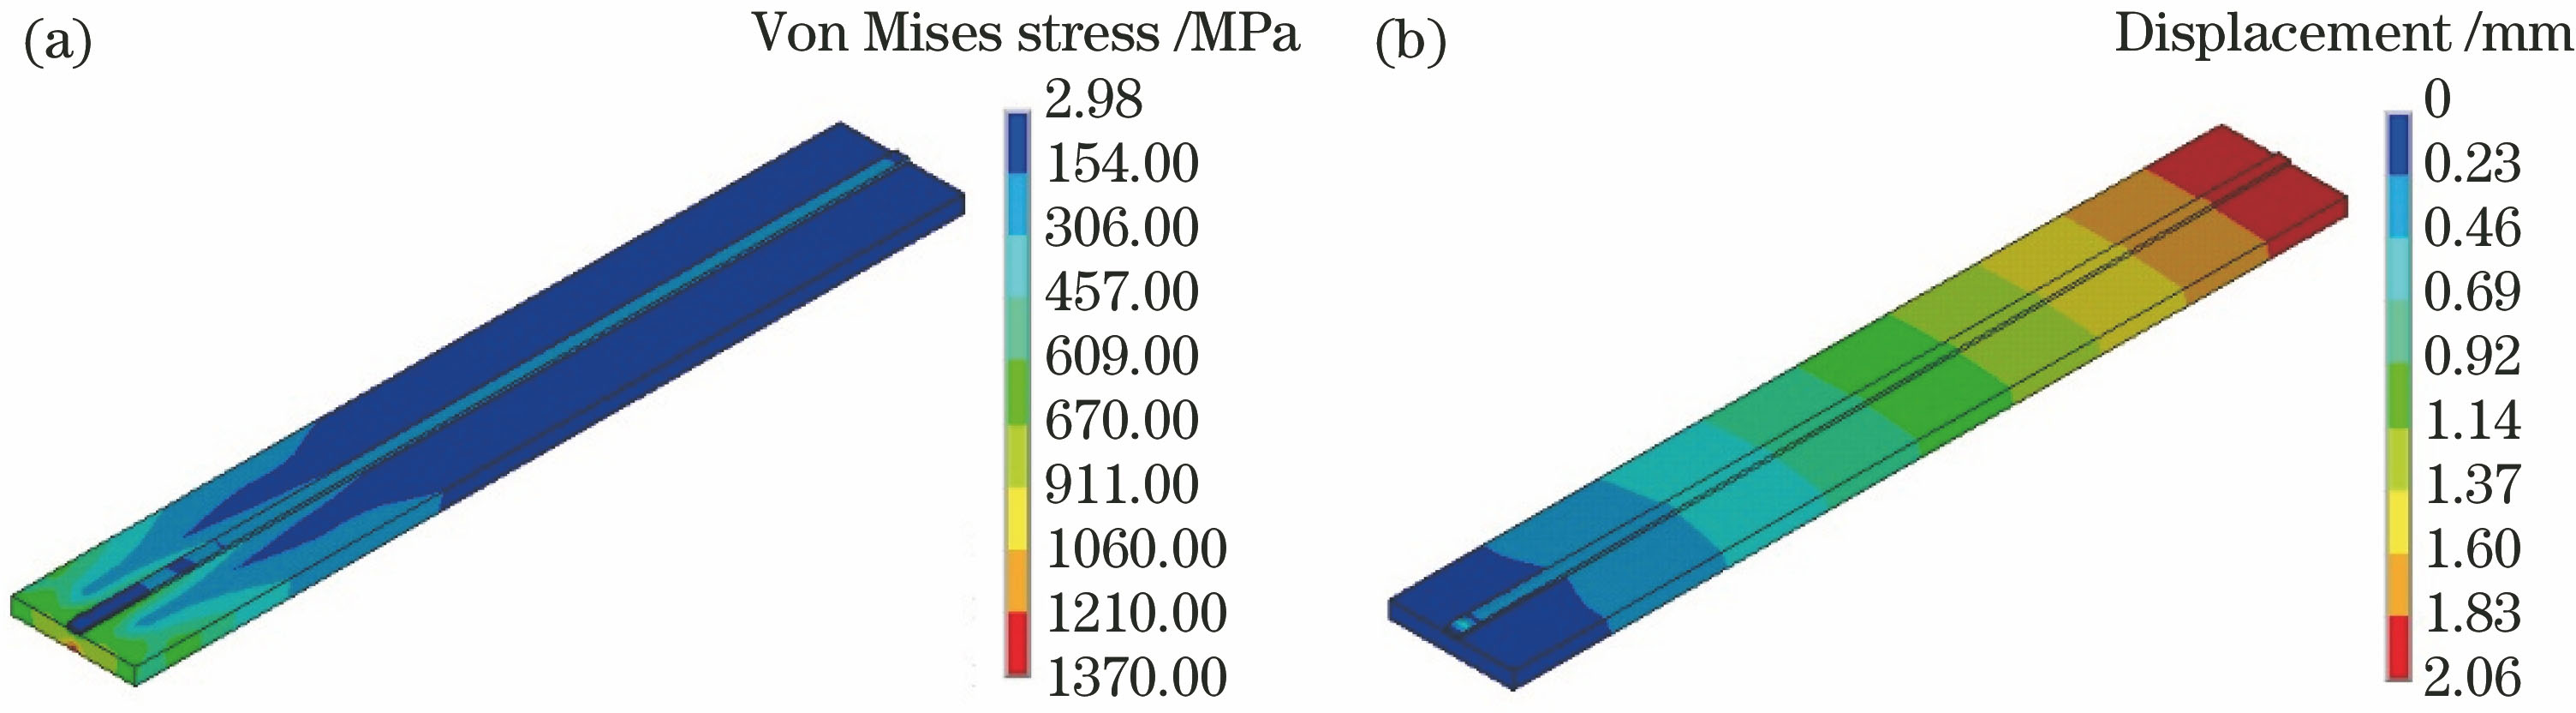
图 8. 不同路径的应力分布曲线。(a)熔覆层与基体结合面中部沿Z轴方向;(b)基底中部沿X轴方向;(c)自由端中部沿Y轴方向
Fig. 8. Stress distribution curves along different paths. (a) Along the Z axis in the middle of the bonding surface of the cladding layer and the matrix; (b) along the X axis in the middle of the matrix undersurface; (c) along the Y axis in the middle of the free end
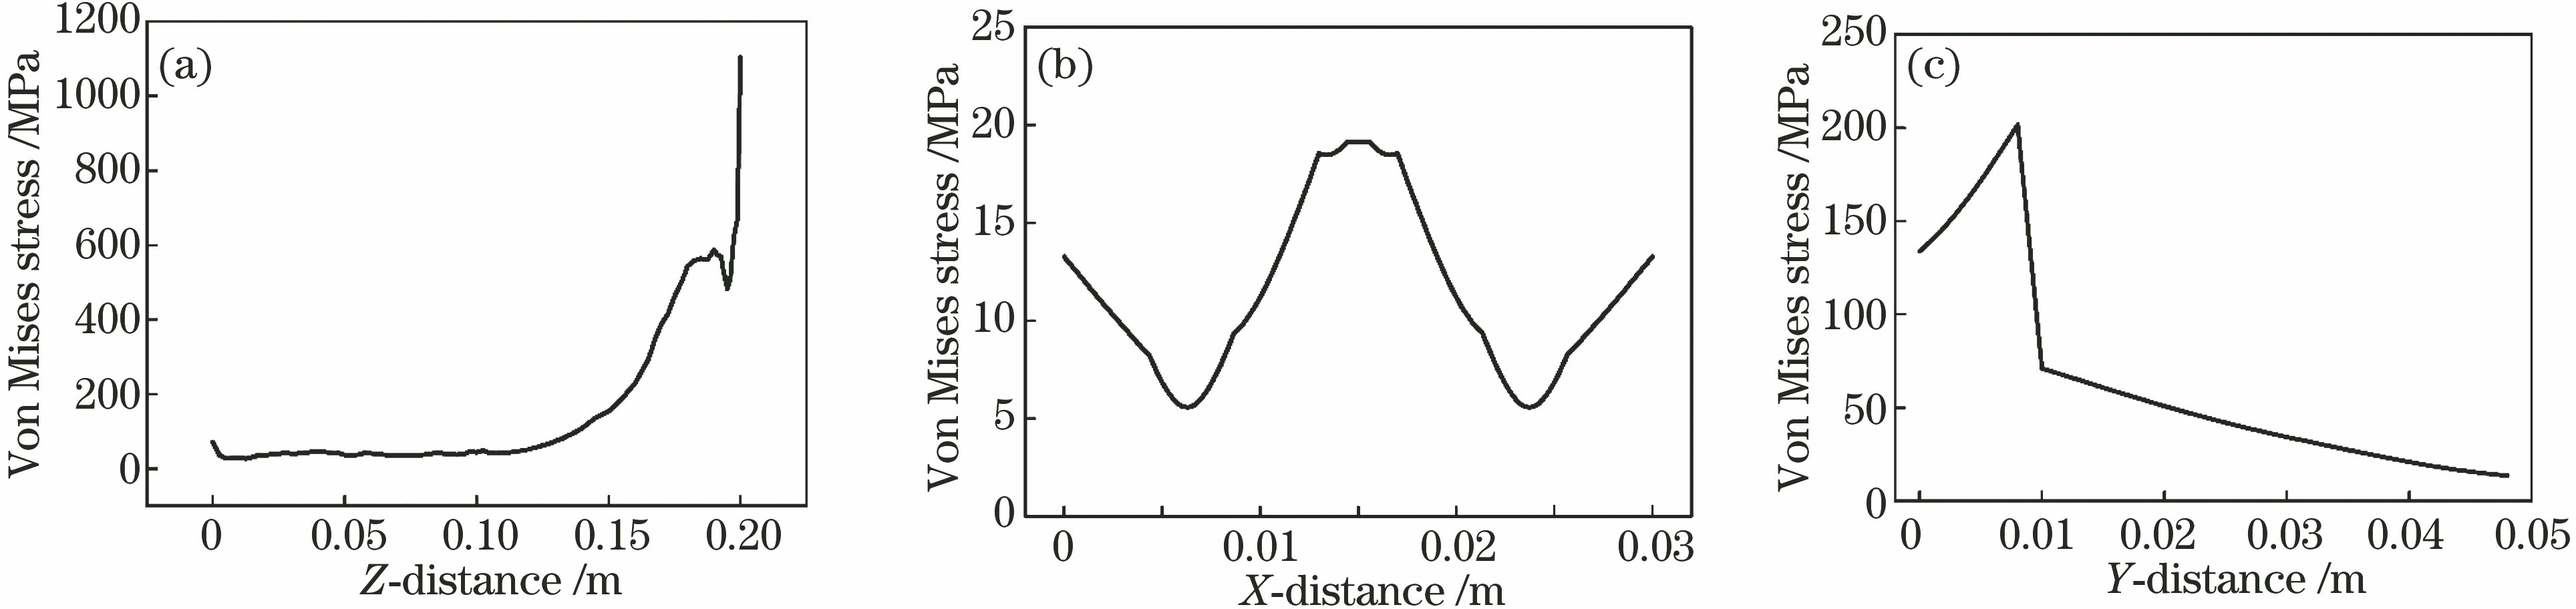
图 9. 不同激光工艺参数组合下的温度-时间曲线。(a) A组;(b) B组;(c) C组;(d) D组;(e) E组;(f) F组
Fig. 9. Temperature-time curves for different laser processing parameters. (a) Group A; (b) group B; (c) group C; (d) group D; (e) group E; (f) group F
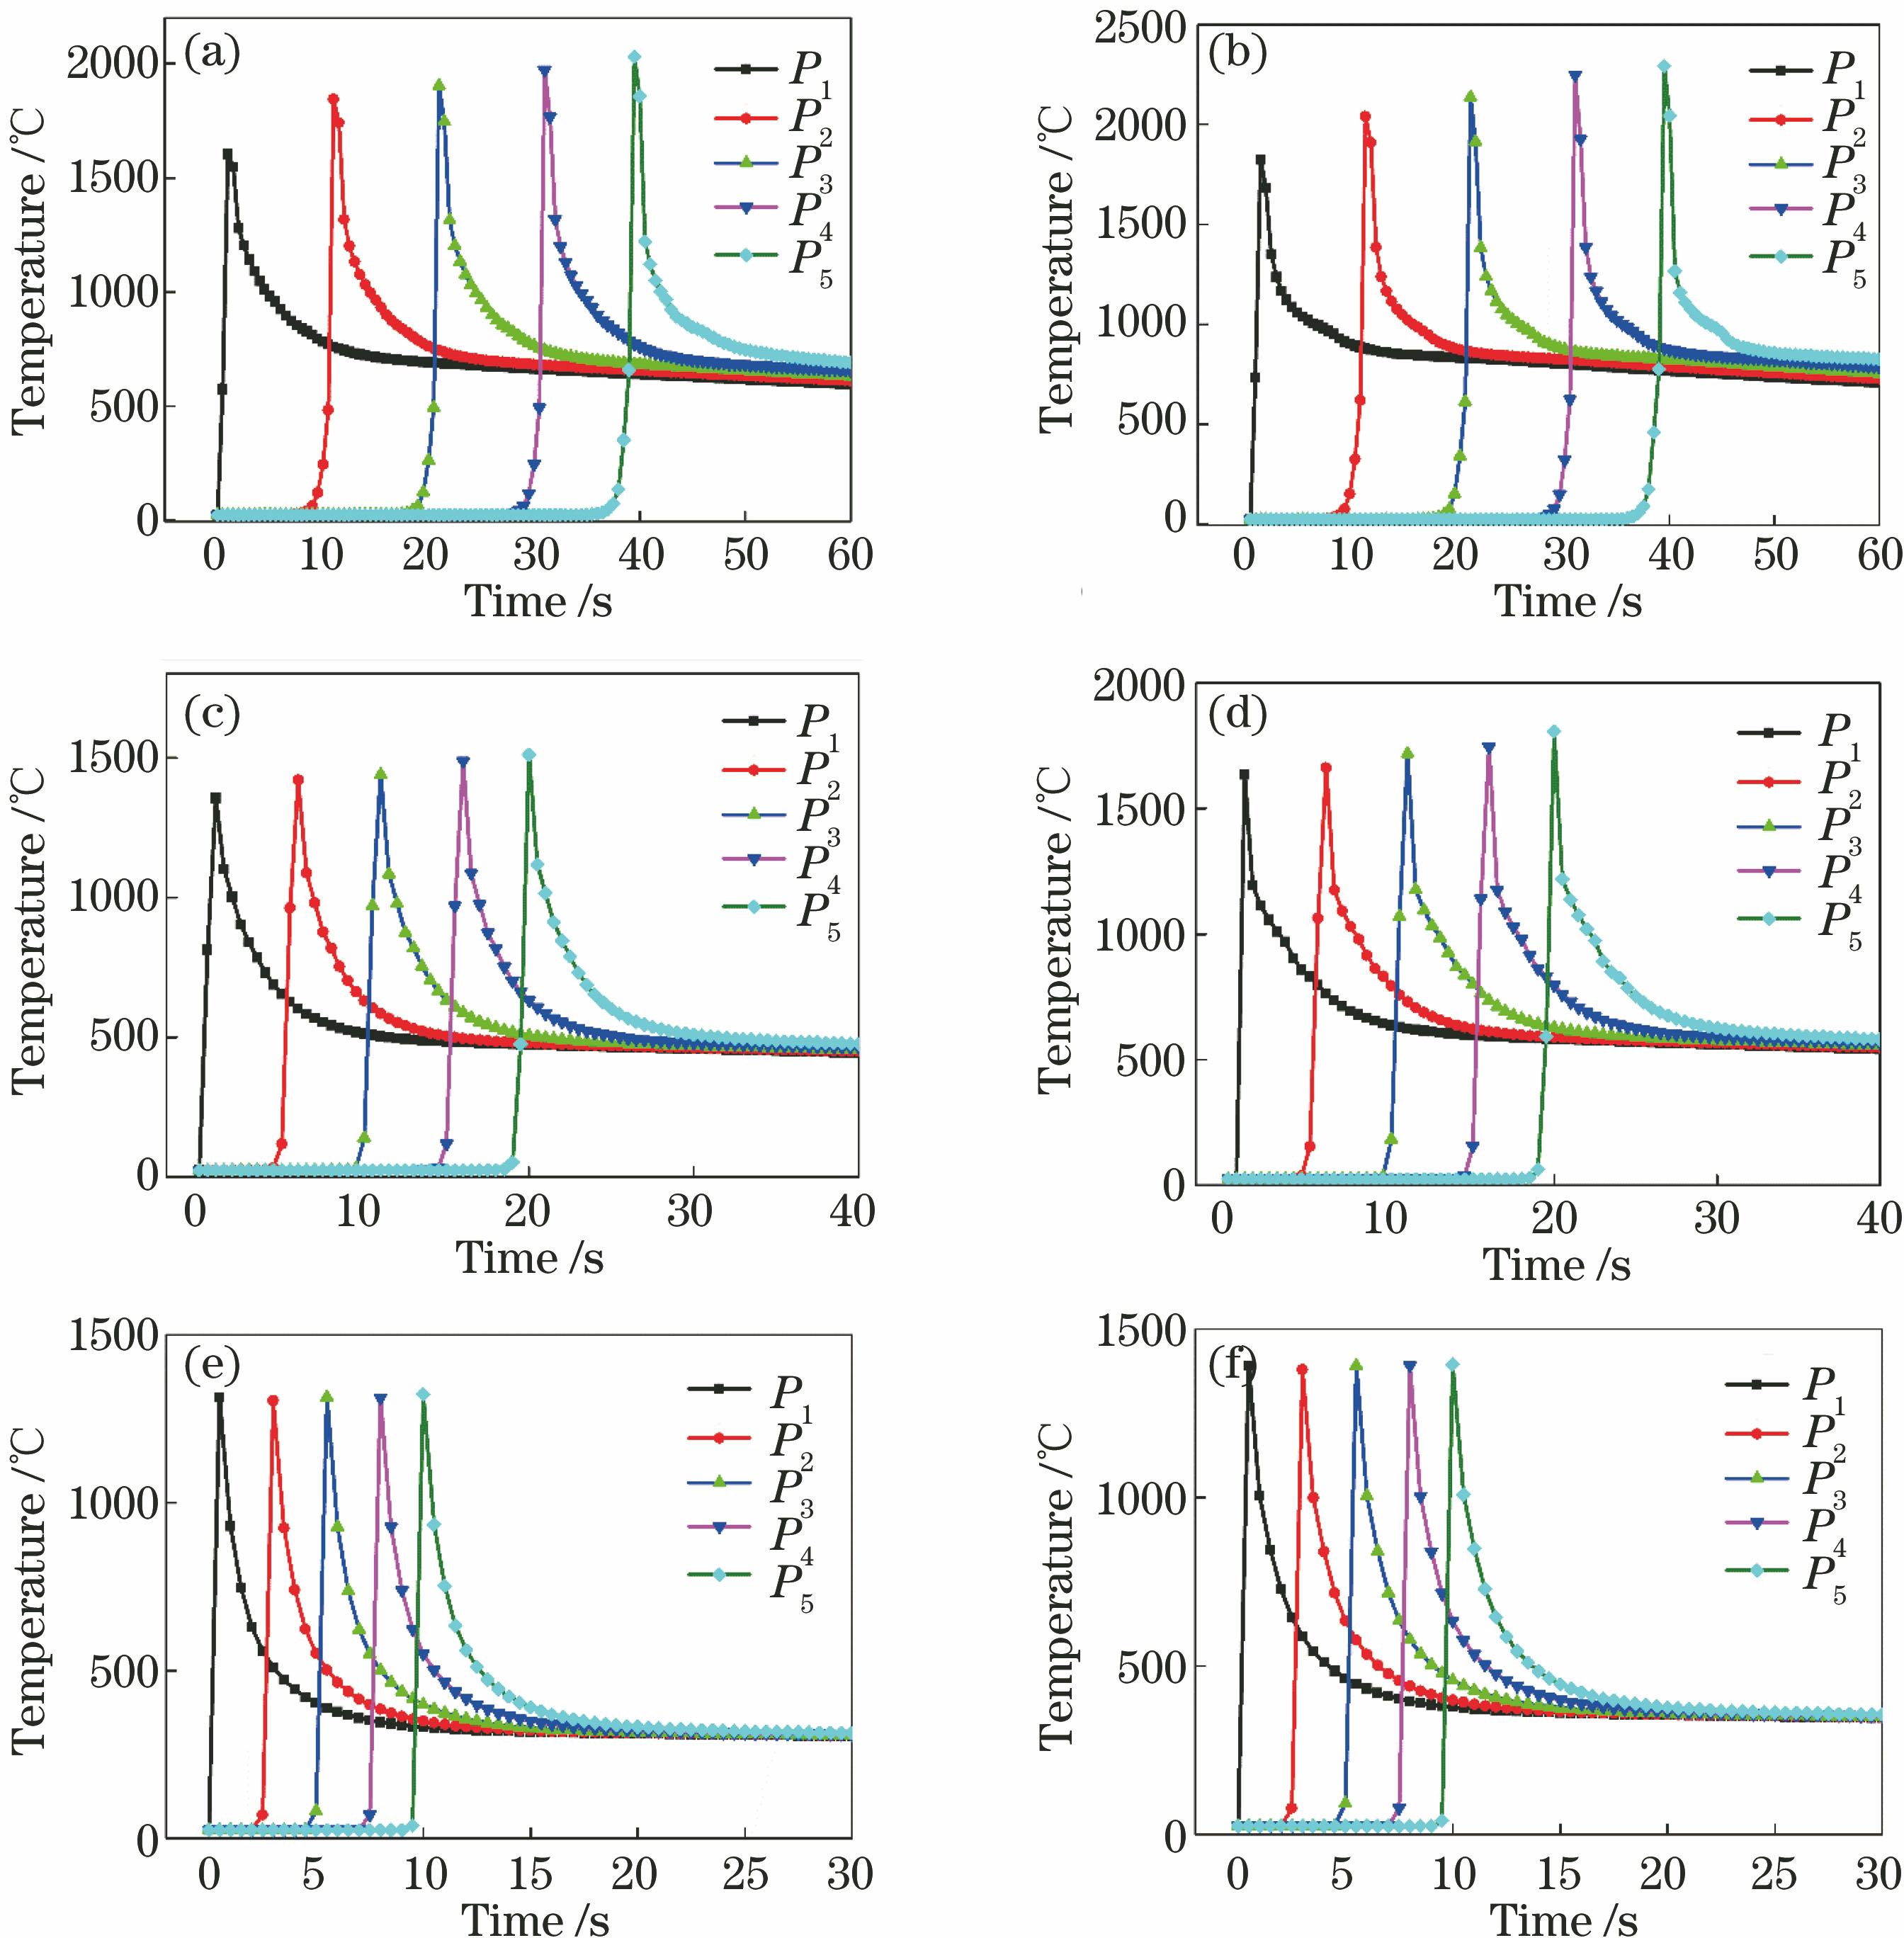
图 10. 不同激光工艺参数下沿路径1的应力分布曲线
Fig. 10. Stress distribution curves of different laser processing parameters along path 1
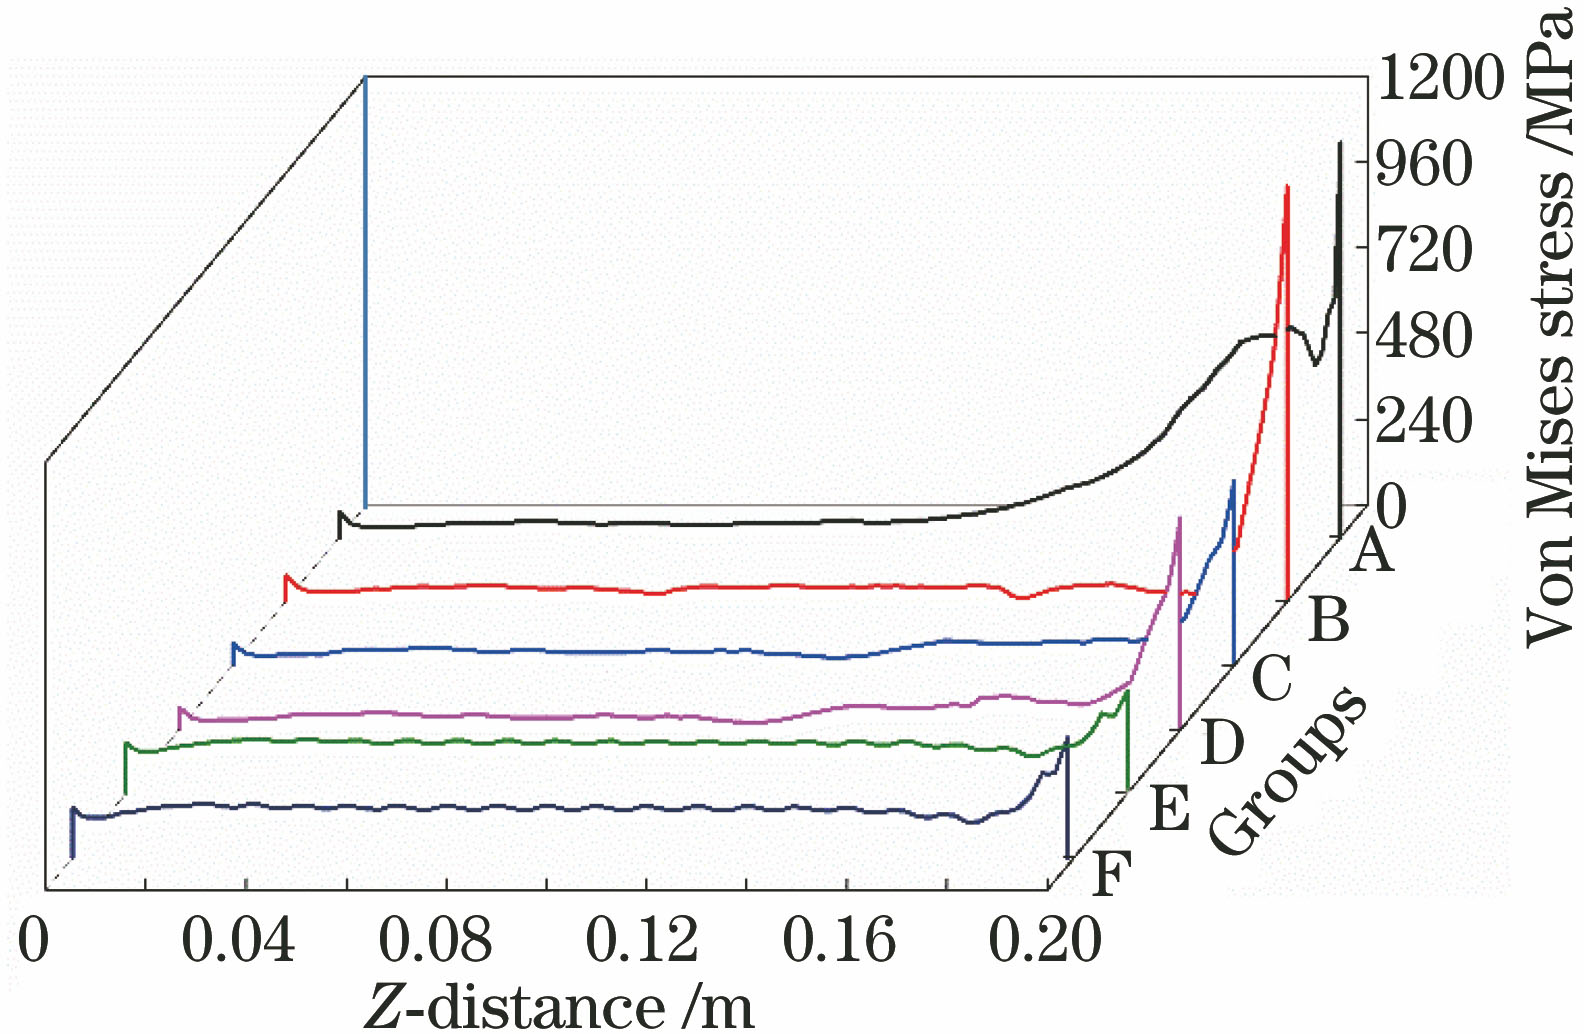
图 11. 熔覆试件形貌。(a)正面;(b)背面
Fig. 11. Morphology of laser cladding specimens. (a) Front; (b) back
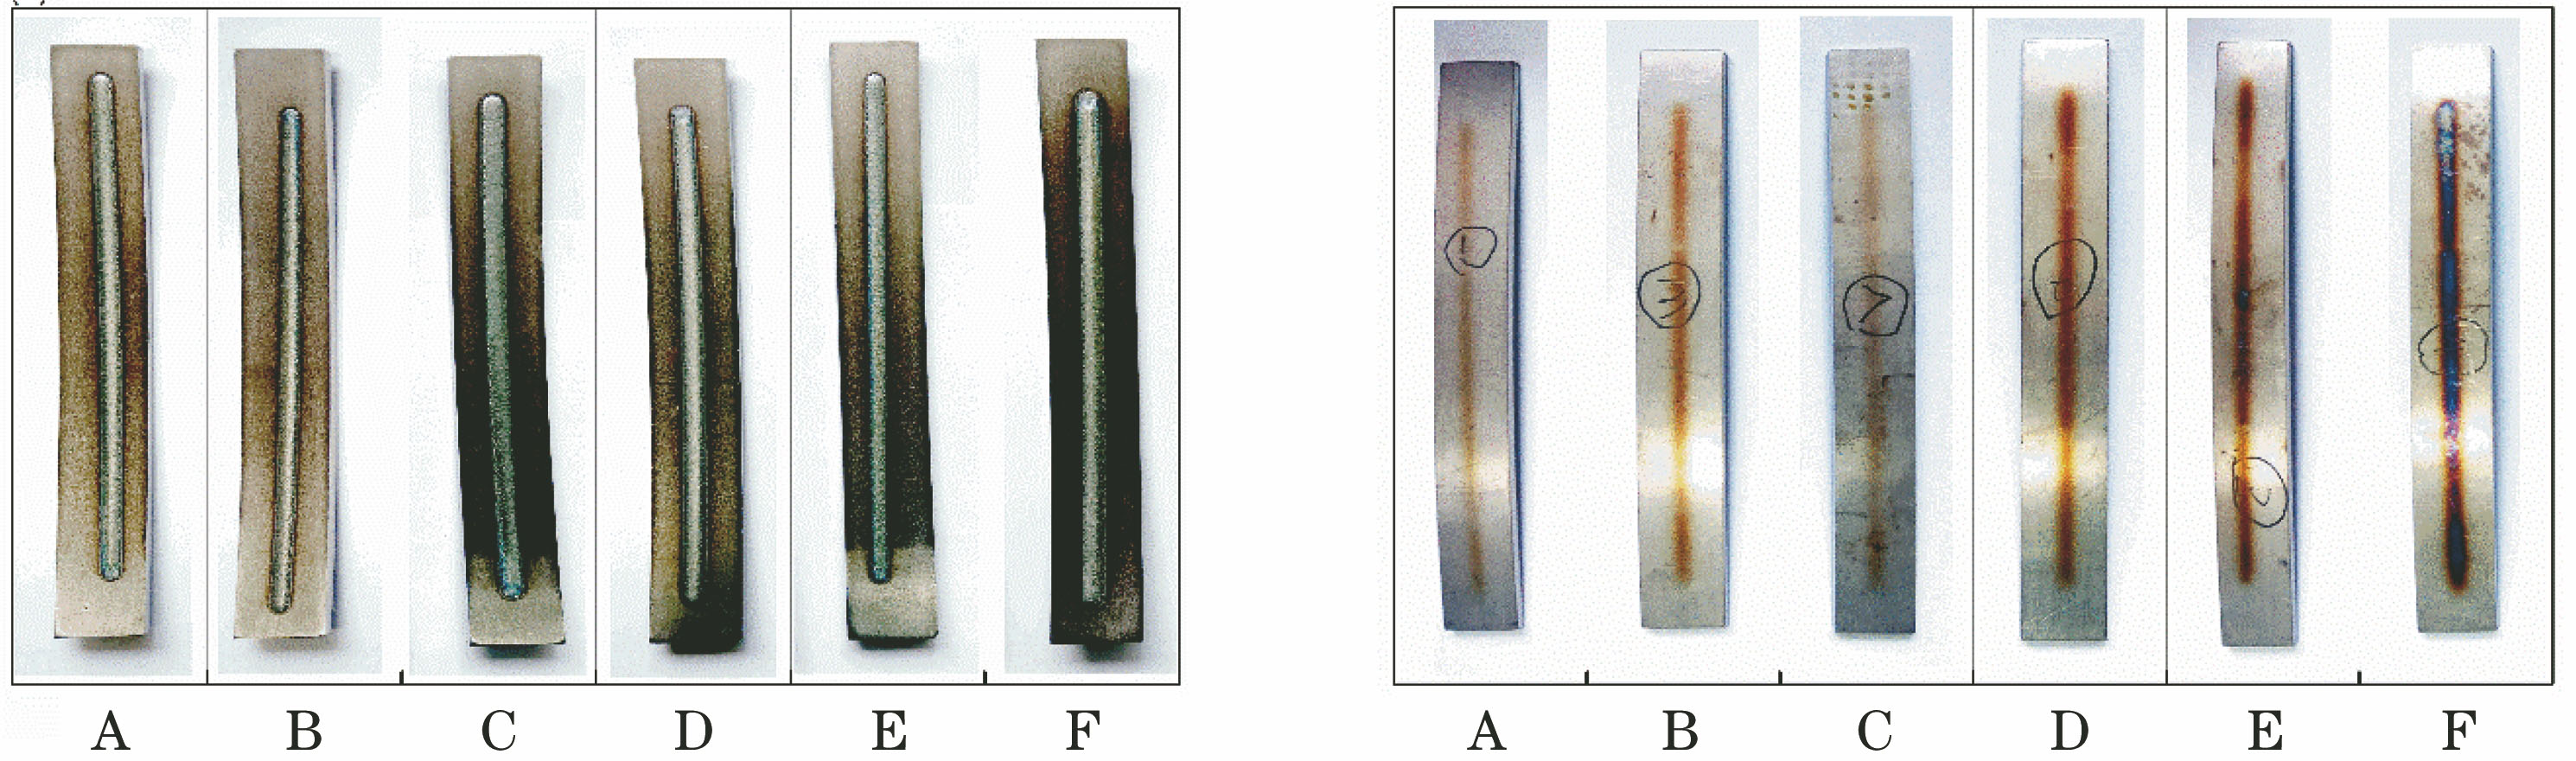
表 1不同网格划分下模型温度场的最高温度
Table1. The maximum temperature of model temperature field under different meshes
|
表 2激光工艺参数分组和计算结果
Table2. Grouping and calculation results of laser process parameters
|
任仲贺, 武美萍, 唐又红, 韩基泰, 龚玉玲. 基于热力耦合的激光熔覆数值模拟与实验研究[J]. 激光与光电子学进展, 2019, 56(5): 051404. Zhonghe Ren, Meiping Wu, Youhong Tang, Jitai Han, Yuling Gong. Numerical Simulation and Experimental Research of Laser Cladding Based on Thermo-Mechanical Coupling[J]. Laser & Optoelectronics Progress, 2019, 56(5): 051404.


 PDF全文
PDF全文

