Photonics Research, 2018, 6 (5): 05000346, Published Online: Jul. 18, 2018
Surface-enhanced Raman scattering on dielectric microspheres with whispering gallery mode resonance  Download: 681次
Figures & Tables
Fig. 1. Schematic of the experimental setup. Inset: top view (left) and side view (right) of a typical on-chip microsphere used in the experiment.
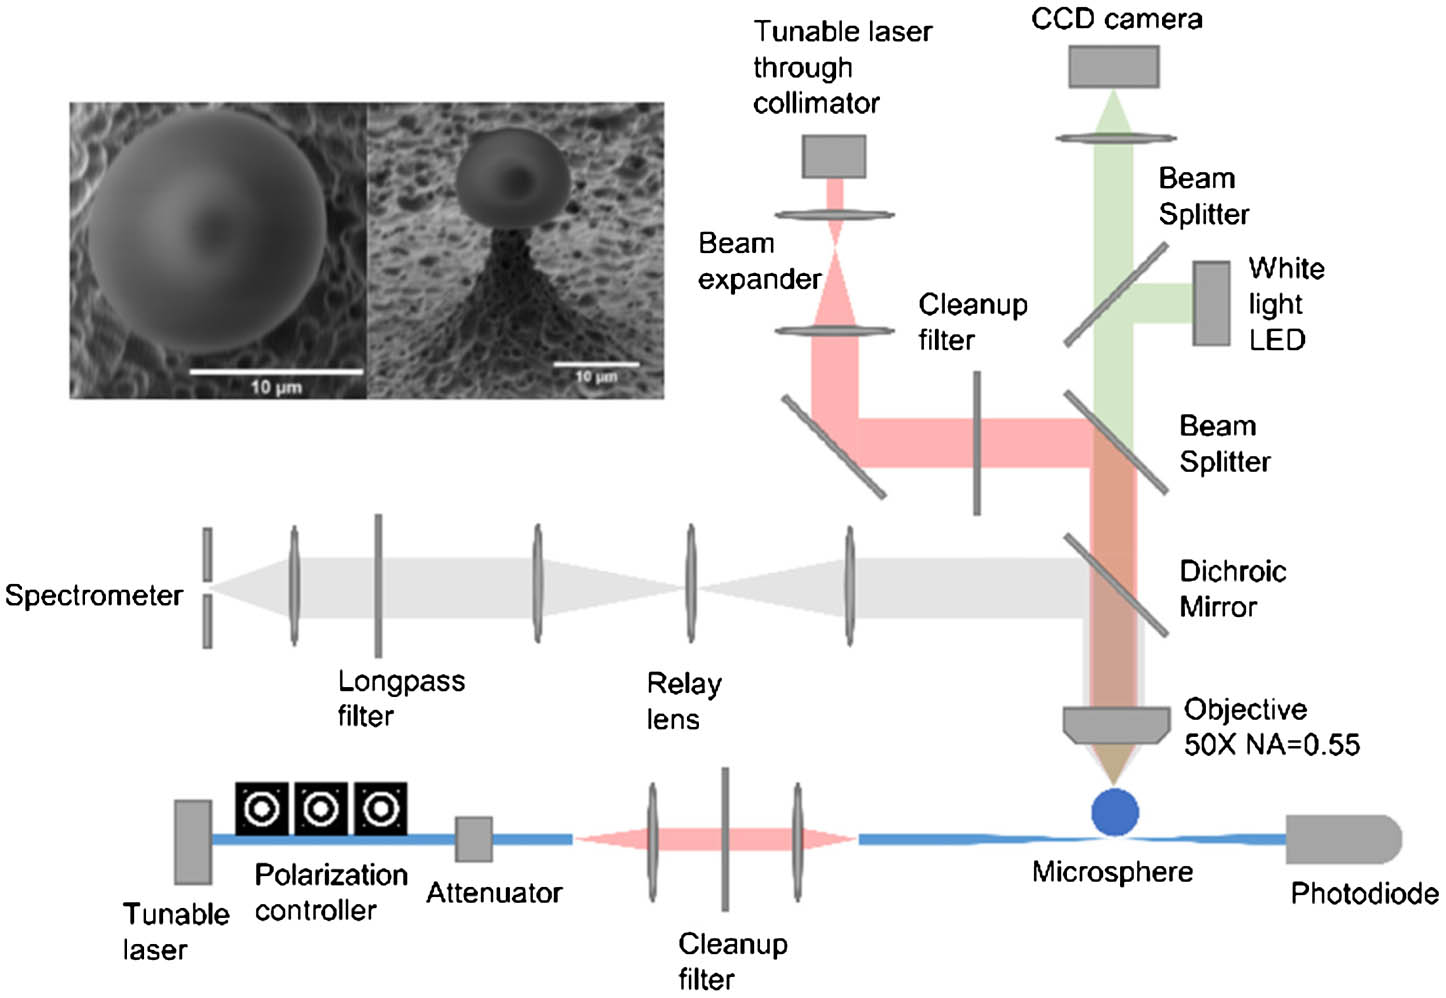
Fig. 2. Raman lasing and thermal effects in silica microspheres. (a) Raman intensity dependence on pump power for a bare silica microsphere. Inset shows the linear dependence of Raman intensity on pump power in the spontaneous Raman emission regime. (b) Measured transmission spectrum through the fiber taper coupler around a typical WGM resonance. Inset shows the transmission spectrum (blue curve) of the same modes at a higher power typically used for Raman pumping, with significant thermal broadening. The red triangular waveform corresponds to the scanning of the pump laser wavelength; the left half corresponds to a decreasing pump wavelength, while the right half corresponds to an increasing pump wavelength. The oscillation seen in the thermally broadened WGM is due to interference effect from reflection at fiber ends, which is unrelated to the WGM resonance.

Fig. 3. Raman emission from a bare silica microsphere. (a) Integrated Raman spectrum from a 13.8 μm silica microsphere. (b) Raman spectra from different positions in the microsphere. Red dotted circles in the inset indicate the positions from which the spectra were collected. (c) Measured Raman intensity dependence on pump detuning. Red curve shows a Lorentzian fit to the experimental data.

Fig. 4. Raman enhancement of rhodamine 6G through the silica microsphere. (a) Background subtracted Raman spectra of rhodamine 6G for tapered fiber coupler excitation (blue), free-space excitation on a microsphere (red), and free-space excitation on the substrate (green). The spectra for free-space excitation on the microsphere and substrate are scaled by 100 times for visibility. (b) Raman spectrum of rhodamine 6G around the 1510 cm − 1

Fig. 5. Dependence of Raman intensity on η pump η pump


Steven H. Huang, Xuefeng Jiang, Bo Peng, Corey Janisch, Alexander Cocking, Şahin Kaya Özdemir, Zhiwen Liu, Lan Yang. Surface-enhanced Raman scattering on dielectric microspheres with whispering gallery mode resonance[J]. Photonics Research, 2018, 6(5): 05000346.


 PDF全文
PDF全文

