Ultra-wide-dynamic-range gas sensing by optical pathlength multiplexed absorption spectroscopy  Download: 661次
1. INTRODUCTION
Gas detection is of increasing importance in various fields ranging from fundamental studies to industrial applications [1–11]. Compared with chemical gas sensors, laser spectroscopic gas sensors offer advantages of high specificity and high speed. In applications where the gas concentrations change in a wide range, the sensing dynamic range is particularly concerning [12,13]. Among the various laser spectroscopic methods, laser absorption spectroscopy (LAS) is most widely used due to its capability of accurate quantification and straightforward operation. However, for trace gas sensing, the LAS needs to resolve weak absorption, whereas for detection of high-concentration gases it has to avert over-absorption, which limits the dynamic range of LAS to about 4 orders of magnitude [14,15]. In general, the dynamic range of the LAS is at least an order of magnitude less than those of zero-background laser spectroscopic techniques such as photoacoustic spectroscopy (PAS) [16,17], photothermal spectroscopy (PTS) [18,19], Raman spectroscopy [20,21], and dispersion spectroscopy [22,23]. Recently, Zhao
In LAS, multipass cells (MPCs) and high-finesse Fabry–Perot (FP) cavities are widely used for trace gas analysis down to the ppt or parts per quadrillion (ppq) level [24,25]. However, improving the measurement sensitivity by increasing the optical pathlength (OPL) is completely ineffective for widening the dynamic range, because it would correspondingly reduce the upper detection limit (UDL) due to over-absorption. Consequently, the applicability of MPCs or FP cavities is restricted to weak absorption systems with the dynamic range limited to 3–4 orders of magnitude [24,26–28]. The combination of direct LAS with wavelength modulation or cavity enhanced techniques has been demonstrated to extend the dynamic range, achieving 4–5 orders of magnitude [29,30]. However, the combination of different techniques requiring different equipment inevitably increases the complexity and cost of the system.
In principle, according to the Beer–Lambert law, only two straightforward ways exist to extend the gas sensing dynamic range: selecting gas transition lines with different strengths or changing the OPL. Based on the former strategy, dynamic ranges up to 6 orders of magnitude have been achieved using two transition lines [31,32]. However, this two-line method requires not only the availability of the gas absorption line but also the wide tunablility of the laser source, which make it lack general applicability. Therefore, the latter strategy based on OPL variation has always gained more attention. In 2015, Pogány
In this paper, we propose a novel method called OPL multiplexed absorption spectroscopy (OPMAS) to realize large-dynamic-range gas sensing. The OPMAS method adopts a gas cell having multiple weak reflections inside that correspond to various short OPLs, and it operates at both the transmission and the reflection modes. The transmission mode works similarly to the conventional LAS, using the whole OPL of the gas cell for trace gas sensing. In the reflection mode, different short OPLs inside the gas cell are interrogated using frequency-modulated continuous-wave (FMCW) interferometry for analyzing high-concentration gases. The FMCW technique is traditionally widely employed in the field of light detection and ranging (LiDAR) [40,41]. Recently, we have mined its intrinsic capability for spectroscopic gas analysis, realizing simultaneous measurement of absorption spectra and OPLs in the MPC [42] and carrying out multi-point gas detection [43]. Here, using the OPMAS, we demonstrate OPL variation more than 2 orders of magnitude in a commercial MPC with pass number. Consequently, without any change of the MPC’s physical parameters and laser alignment, an extremely large dynamic range of more than 6 orders of magnitude is achieved, which surpasses 2–3 orders of magnitude of other LAS techniques.
2. BASIC PRINCIPLE
The basic principle and configuration of the proposed OPMAS method are schematically shown in Fig. 1. One key component is the gas cell that has several weak reflections inside corresponding to various OPLs. The OPMAS system operates simultaneously at two modes, the transmission and the reflection. The former is for trace gas analysis, while the latter is for high-concentration gas sensing. In the transmission mode, almost the same as the conventional LAS, the transmission spectrum of the gas sample is directly obtained from the detected light intensity of the frequency-swept laser beam transmitting through the gas cell. The configuration of the reflection mode is based on an FMCW interferometer, in which the gas cell is placed in the measurement arm. Part of the reflected light returns back to the interferometer and generates beat signals with the reference light. Due to the difference in delay time, the frequency-swept light from different reflection points would generate beat signals with different frequencies and thus can be distinguished by Fourier transformation (FT), as shown in the lower left of Fig. 1. Each reflection peak (RP) in the distance domain contains the corresponding absorption spectral information at this position, which can be retrieved by inverse FT (IFT). The detailed data processing procedure is described in Ref. [42]. The returned light from different reflection positions experiences different roundtrip OPLs, leading to different absorption depths. When the target gas concentration is so high that the transmitted light becomes optically thick or opaque, the reflection signals with short or medium OPLs are used for retrieving the gas concentration according to their absorption depths. On the other hand, for trace gas analysis, the transmission mode is selected, which is not only because of its long OPL for obtaining large absorption amplitude, but also due to the relatively low level of interference noise compared with the reflection mode. Hence, by multiplexing the OPLs of the gas cell, the dynamic range of gas detection can be significantly extended.

Fig. 1. Basic principle of OPMAS. The upper part is the basic configuration including an FMCW interferometer equipped with a gas cell having multiple internal reflections. The lower part is the procedure for the retrieval of spectral signals with different absorption pathlengths.
3. RESULTS
3.1 A. Simulations
To verify the feasibility of the OPMAS for large dynamic range gas detection, we simulate the retrieval of spectral signals corresponding to different OPLs in a gas cell filled with different concentrations of gas samples. In the simulation, the widely used MPC having multiple internal reflections is adopted. Since the reflection by the MPC’s mirror is actually diffuse reflection, part of the backward diffuse light returns back to the optical interferometer. The base length of the MPC is set to 18 cm, and the pass number is 232, yielding a transmission OPL of 41.76 m. Acetylene is chosen as the sample gas, which has abundant strong absorption lines in the near infrared telecom wavelength region. The laser frequency is linearly scanned from to (1519.79 nm to 1520.40 nm), which covers the strongest R(9) line at in the band of acetylene. The scan rate of the laser frequency is (). The data sampling rate is 1.96 MHz, resulting in data samples per scan.
The retrieval procedures of spectral signals of acetylene are simulated at three different concentrations: 60 ppm (parts per million by volume), 1000 ppm, and 16,000 ppm (1.6%). Figure 2(a) shows the original reflection-mode beat signals in the spectral (frequency) domain, in which, for clarity, only the results of 1000 ppm acetylene are presented. It clearly shows the absorption envelope, which results from combined absorptions corresponding to different reflection points inside the MPC. By applying discrete FT (DFT), the beat signals are transformed into the spatial (time) domain obtaining 233 RPs, which are shown in Fig. 2(b). Figure 2(c) zooms in on the beginning part of Fig. 2(b) corresponding to short OPLs. The RPs are denoted by arabic numerals. The first RP (No. 0) denoted as In corresponds to the entrance of the MPC. The data of RPs #1 and #15 are selected and transformed back into the spectral (frequency) domain, obtaining the spectral signals corresponding to round-trip OPLs of 0.36 m and 5.40 m, respectively. The width of the rectangular window for data selection is set to be the base length of the MPC (18 cm), which yields a spectral resolution of 0.83 GHz, according to the formula , where is the speed of light in vacuum, and is the refractive index of air. This spectral resolution is much less than the absorption linewidth of acetylene at atmospheric pressure () and is sufficient for accurate spectroscopic analysis. The retrieved spectral signals from RPs #1 and #15 for three different concentrations are shown in Figs. 2(d) and 2(e), respectively. Highly periodic oscillations in the spectral signals are mainly induced by spectral leakage, which can be efficiently suppressed using a Savitzky–Golay (SG) filter [43]. Figure 2(f) shows the transmission-mode spectral signals for the same three different concentrations. As can be clearly seen, for the 1.6% acetylene gas, in the transmission mode, it becomes opaque at the absorption line center, making the spectroscopic gas analysis nearly impossible. However, at RP #1 in the reflection mode, the 1.6% acetylene gas absorbs only about half of the light around the absorption line center, and thus accurate spectroscopic gas is still feasible. For the 60 ppm acetylene gas, the transmission mode is preferred to achieve a high signal-to-noise ratio (SNR), while for the 1000 ppm gas it is better to use RP #15 in the reflection mode that can provide a high SNR but avoid over-absorption. After intensity normalization, absorption spectra can be obtained. It is worth noting that, in principle, all of the RPs in the reflection mode can be used to analyze gases of different concentrations. However, a reflected signal with a high pass number would have relatively low amplitude and high optical interference noise; therefore, it is better to select the transmission mode for trace gas sensing.

Fig. 2. Simulation of spectral signal retrievals with different OPLs using an MPC. (a) Original reflection-mode beat signals in spectral domain for 1000 ppm acetylene gas. The inset shows the local details of the beat signal. (b) DFT results in spatial domain containing 233 RPs. (c) Enlargement of the beginning part of (b). (d), (e) Retrieved spectral signals from two RPs (#1 and #15) for three different gas concentrations (60 ppm, 1000 ppm, and 1.6%). (f) Simulated spectral signals in the transmission mode.
3.2 B. Experimental Setup
The experimental setup for OPMAS is schematically shown in Fig. 3. The apparatus comprises a tunable laser source (TLS), a Mach–Zehnder-type measurement interferometer, a Michelson-type auxiliary interferometer, and a data acquisition (DAQ) unit. The MPC is placed in the probe arm of the measurement interferometer. It has a nominal base length of about 18 cm and a pass number of 232, which can support a transmission OPL around 42 m. Acetylene is chosen as the sample gas and filled in the MPC at atmospheric pressure.
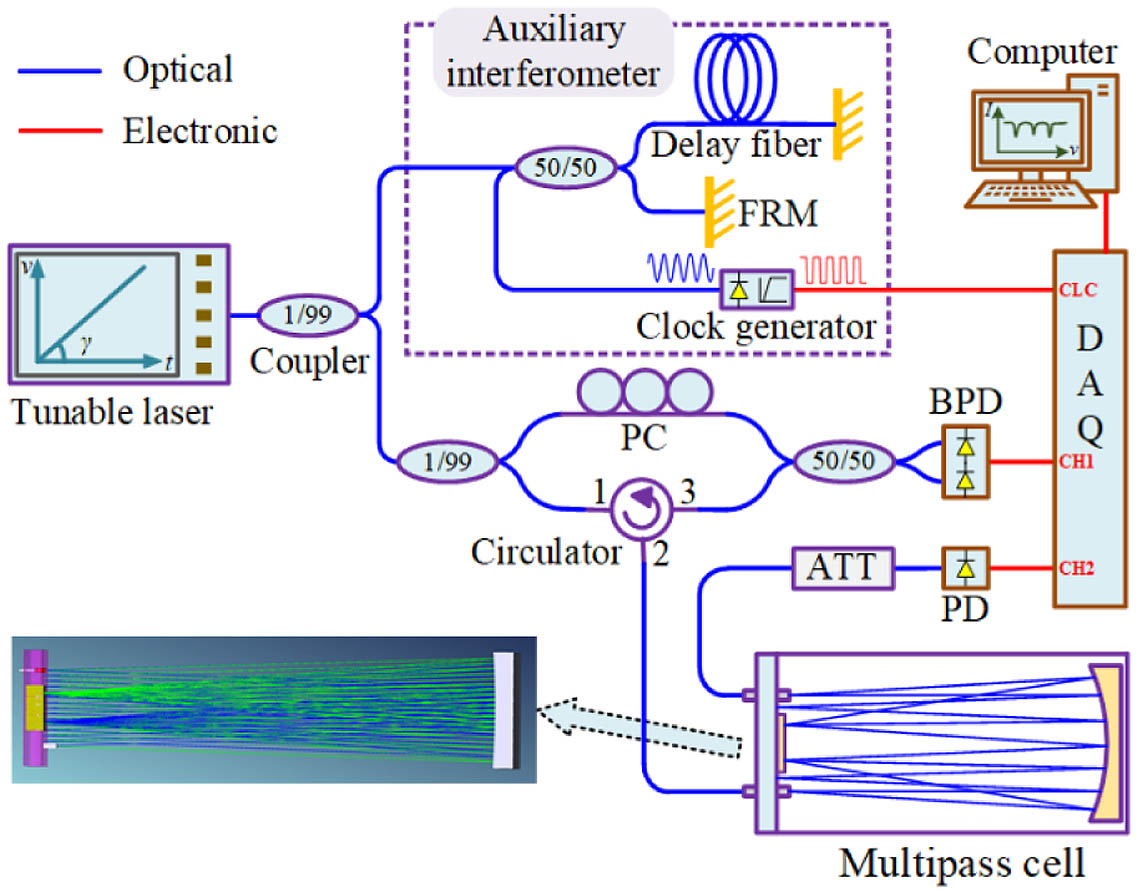
Fig. 3. Experimental setup of the OPMAS. FRM, Faraday rotation mirror; PC, polarization controller; BPD, balanced photodetector; ATT, optical attenuator; DAQ, data acquisition.
The TLS (Keysight, 81960A) is repeatedly swept from 1519.78 nm to 1520.39 nm (6577.26–6577.90 cm-1) at a scan rate of 10 nm/s, covering the strongest R(9) line in the band of acetylene. During the scan, the variation of the laser output power is less than 0.2 dB. The 0.61 nm wavelength tuning range yields a spatial resolution of 1.9 mm, according to the formula , where is the tuning range of the laser frequency. The laser output has an average power of with a linewidth of . About 98% of the laser power is allotted to the probe arm of the measurement interferometer, while the other 2% is assigned to the reference arm and the auxiliary interferometer. The reflected probe light is combined with the reference light to generate beat signals, which are detected using an AC-coupled balanced detector (Fsphotonics, PDB1008) and acquired by a DAQ card (ART, PCI8514). The transmitted light through the MPC is received using a separate photodiode, before which an optical attenuator is used to avoid detector saturation. The transmission signals are acquired via another channel of the DAQ unit. The auxiliary interferometer generates clock pulses at equally spaced laser frequencies to trigger the DAQ for correcting the nonlinearity of the laser tuning. The length of the optical fiber delay line is 154.3 m, which leads to a DAQ rate of 1.96 MHz.
3.3 C. Experimental Results in Reflection Mode
To experimentally verify the large dynamic range of the OPMAS, acetylene gases with five different concentrations spanning more than 4 orders of magnitude are measured, including 98,000 ppm (9.8%), 9250 ppm, 1120 ppm, 95 ppm, and 9.3 ppm. The former four concentrations are measured in the reflection mode, while the lowest 9.3 ppm is in the transmission mode. This section presents the measurement results in the reflection mode. As an example, Fig. 4 shows the retrieval procedure of the spectral signals for 9250 ppm acetylene. Figure 4(a) shows the recorded raw beat signals in the spectral domain, where the envelope of gas absorption is clearly presented. By applying DFT, the reflection signals from different positions in the probe arm are separated and unambiguously identified in the spatial domain, as shown in Fig. 4(b). The RPs include 233 reflection signals from the MPC as well as those from optical fiber connectors. The discrepancy in amplitude of the reflection signals from the MPC is mainly due to the difference of diffuse reflectivity and pass number. Figures 4(c) and 4(d) present horizontally enlarged views of the beginning and end parts of Fig. 4(b), showing that reflections at high pass numbers have relatively low amplitudes. The RPs denoted as In and Out correspond to the entrance and exit of the MPC, with their positions being at 3.8875 m and 45.8483 m, respectively, indicating a transmission OPL of 41.961 m inside the MPC. The 231 numbered RPs in between come from different reflection points on the MPC’s mirrors, which indicate a pass number of 232 in the MPC with each pass length of .
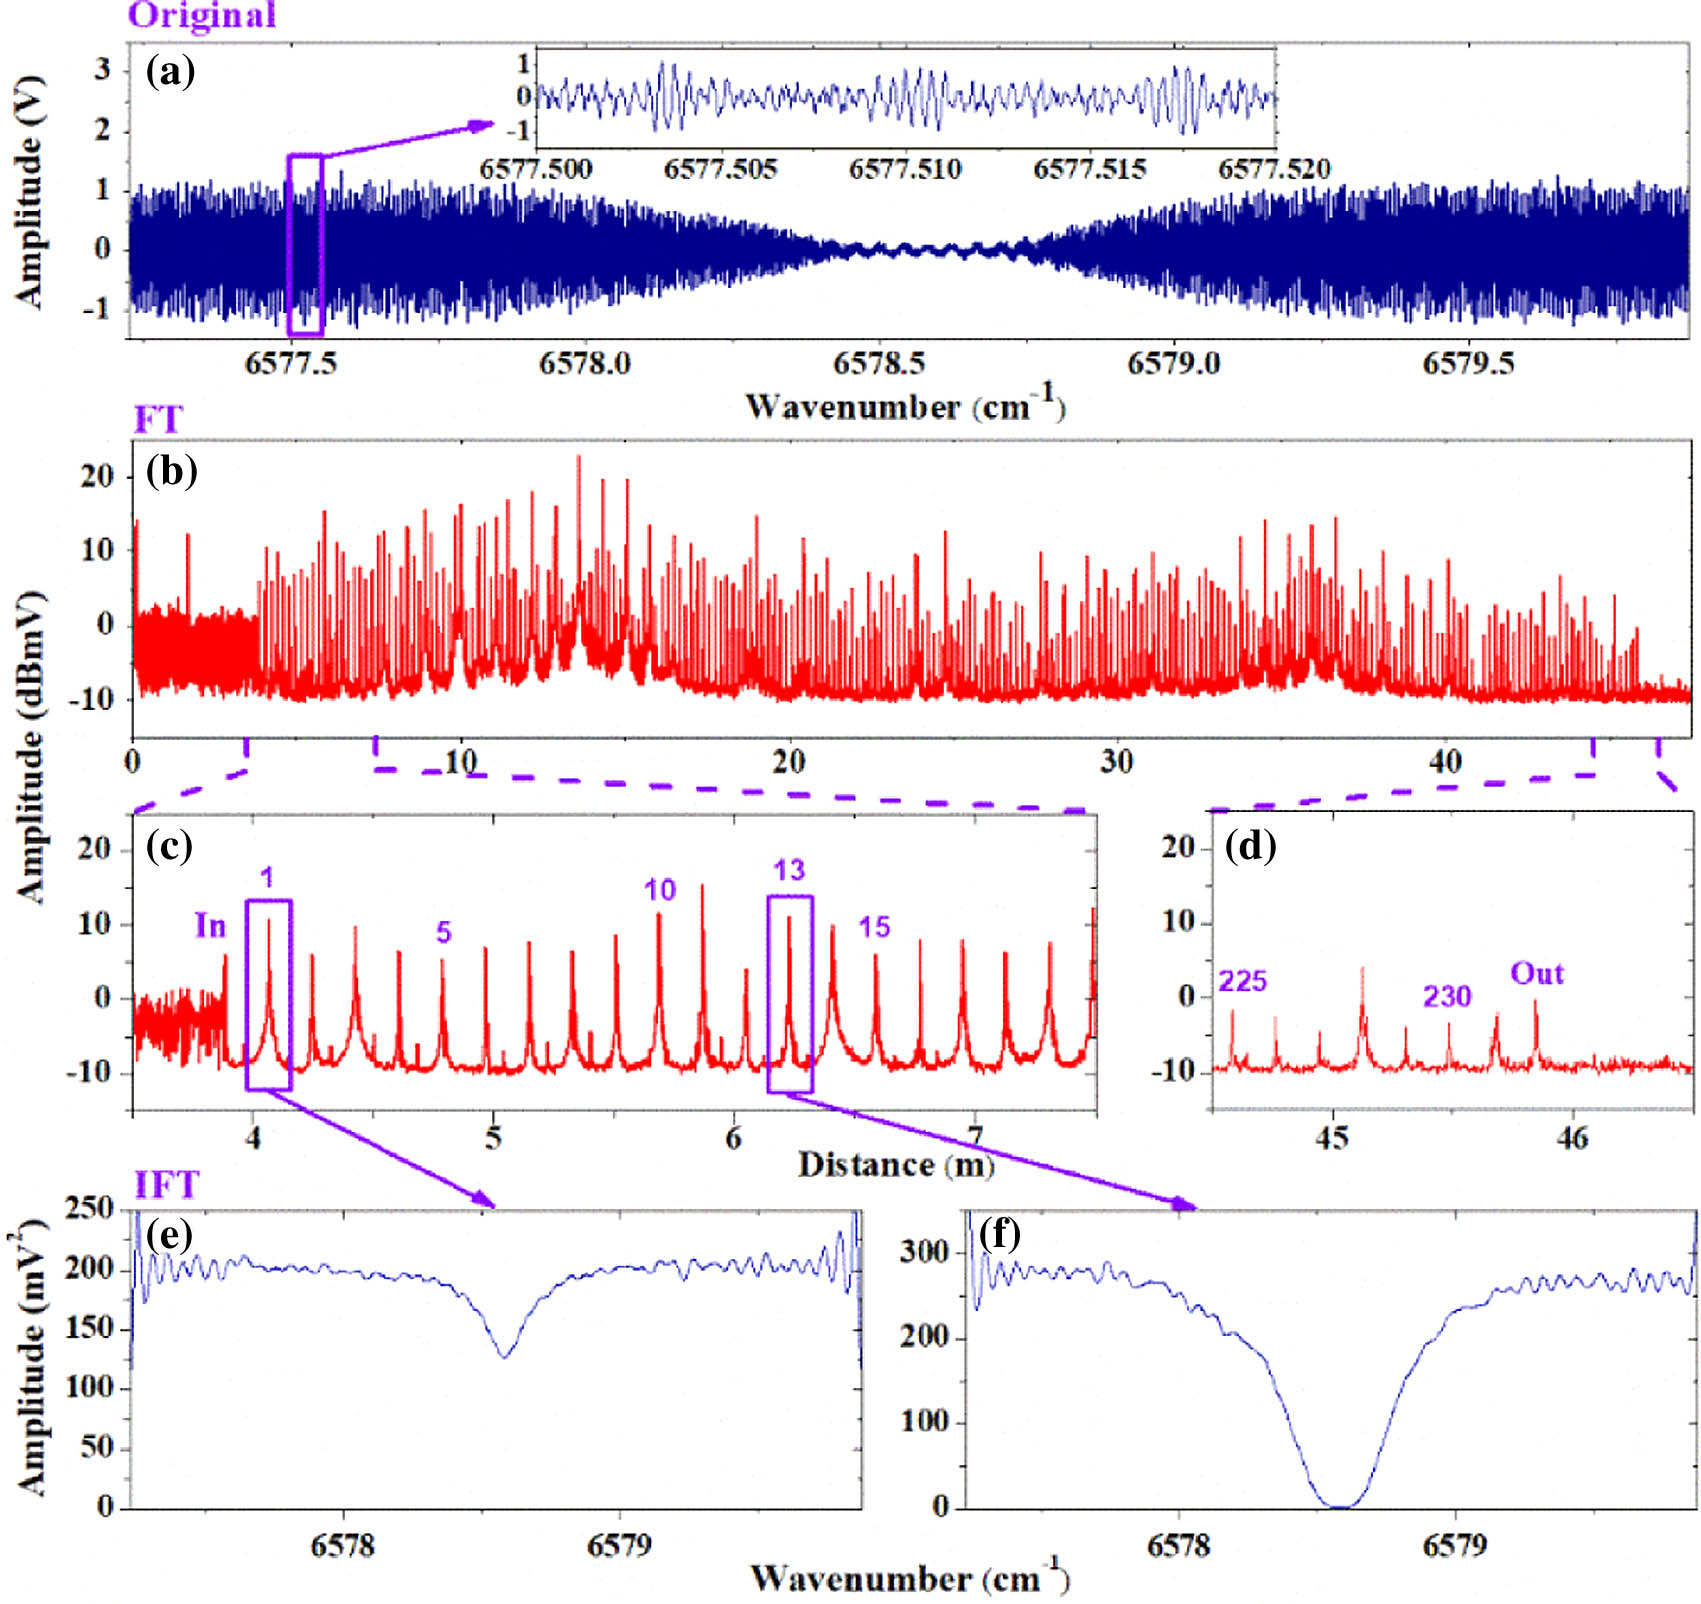
Fig. 4. Experimental results of spectral signal retrieval at different reflection points in the MPC filled with 9250 ppm acetylene. (a) Acquired raw beat signals. (b) DFT of the signals shown in (a) with 50 results averaged. (c), (d) Enlargements of the beginning and end parts of (b). (e), (f) Spectral signals retrieved by IDFT from the RPs #1 and #13 shown in (c).
Figures 4(e) and 4(f) show spectral signals retrieved by inverse DFT (IDFT) from RPs #1 and #13 inside the MPC, with the corresponding round-trip OPLs of 0.359 m and 4.680 m, respectively. The rectangular window width used to select the RP data is 18 cm, which yields a spectral resolution of 0.83 GHz. Figures 4(e) and 4(f) clearly show that due to the difference in absorption pathlength the spectral signals retrieved from different RPs present different degrees of absorption. For RP #13, the light is almost totally absorbed around the line center, which makes it difficult to perform spectroscopic analysis. However, for RP #1 with a short OPL, the light is only partially absorbed at the line center so that spectroscopic analysis is executable. The experimental results shown in Fig. 4 are consistent with the simulated results shown in Fig. 2, which initially verifies the efficacy of the proposed OPMAS method.
To obtain the round-trip transmission spectrum in the reflection mode, each retrieved spectral signal like that shown in Fig. 4(e) is further processed. First, the SG filter is applied to suppress the highly periodic noise induced by spectral leakage. Then, the 20% data at the staring and end parts of the transmission signal having relatively large noise are cut away. By simultaneously fitting a polynomial baseline and a Lorentz profile to the remaining data, the transmission spectrum is finally obtained. For retrieval of a certain concentration, the selected RP meets three criteria: first, the obtained transmittance should be (this criterion is further discussed in Section 3.E); second, the amplitude of the RP is high enough (more than half of the highest RP meeting the first criterion) to guarantee the SNR; third, among the multiple RPs meeting the previous two criteria and with the same high SNR, the RP that gives a transmittance closest to 50% is selected. Figure 5 shows the obtained transmission spectra for four different concentrations of acetylene with different absorption pathlengths. Also shown in Fig. 5 are simulated results based on the high-resolution transmission molecular absorption (HITRAN) database [44]. The exhibited high agreement between the experimental and the simulated results validates the accuracy of the retrieved transmission spectra. The standard deviation (SD) values of the residuals are on average less than 0.01. This low-level spectral noise guarantees the accuracy for spectroscopic gas analysis. The consistency of the concentration determination using different RPs is assessed. Also taking the measurement of 9250 ppm acetylene as an example, three RPs (RPs #1, #3, and #10) shown in Fig. 4(c) having relatively high amplitudes are chosen, with their OPLs of 0.359 m, 1.079 m, and 3.601 m, respectively. The retrieved transmittances are 0.637, 0.265, and 0.012, with concentrations of 9580 ppm, 9360 ppm, and 9310 ppm, respectively. These three retrieved concentrations from RPs with the OPL spanning an order of magnitude agree well within the measurement uncertainty, which verifies that the concentrations determined from different RPs are consistent. The transmission spectrum shown in Fig. 5(a) presents a much larger linewidth than those of the other three transmission spectra. The reason is that, according to the Beer–Lambert law, when the optical depth is so high that the transmittance at the line center is close to zero, the wings of the absorption profile make the major contribution to the attenuation of the transmitted light.
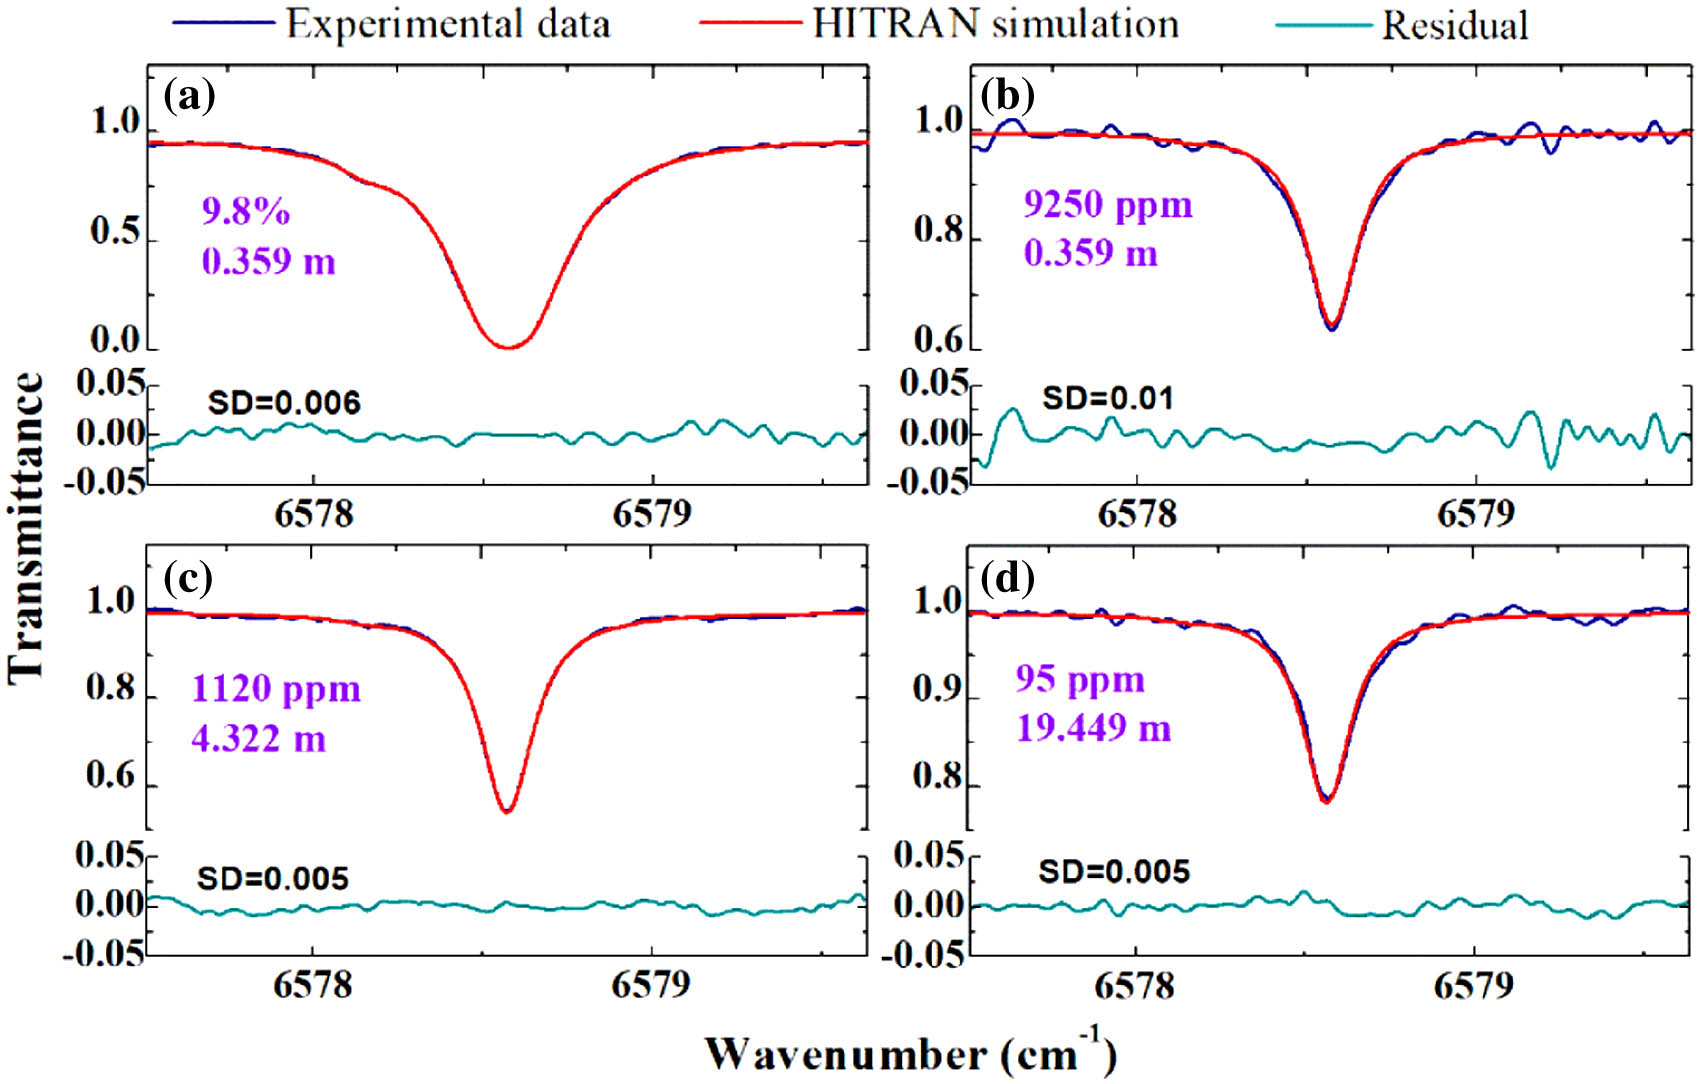
Fig. 5. Measured and simulated transmission spectra of acetylene at different concentrations with different absorption pathlengths. (a)–(d) For acetylene concentrations of 9.8%, 9250 ppm, 1120 ppm, and 95 ppm, with absorption pathlengths of 0.359 m, 0.359 m, 4.322 m, and 19.449 m, respectively.
3.4 D. Experimental Results in Transmission Mode
As the reflection mode suffers much from the optical interference noise, the achieved average noise equivalent absorption (NEA) (0.006) is about an order of magnitude worse than that of a typical LAS system. Therefore, the transmission mode is chosen for measuring the low-concentration (9.3 ppm) acetylene. Figure 6(a) shows the raw transmission signal acquired in one laser-frequency-scan period. The major highly periodic fringe is due to the optical interference between reflected light from different positions on the MPC mirrors, which is a common problem when using MPC. The major fringe period of corresponds to the reflection interval of , four times the base length (18 cm) of the MPC. This kind of highly period noise is efficiently suppressed by the SG filter. After baseline normalization, the transmission spectrum is obtained, which is shown in Fig. 6(b). For comparison, the simulated spectrum based on the HITRAN database is also shown. According to the SD of the residual, the NEA is estimated to be 0.0003, which improves by more than an order of magnitude compared with that in the reflection mode. The achieved NEA is limited by the residual fringe that has comparable frequency with the absorption linewidth and is difficult to filter out.
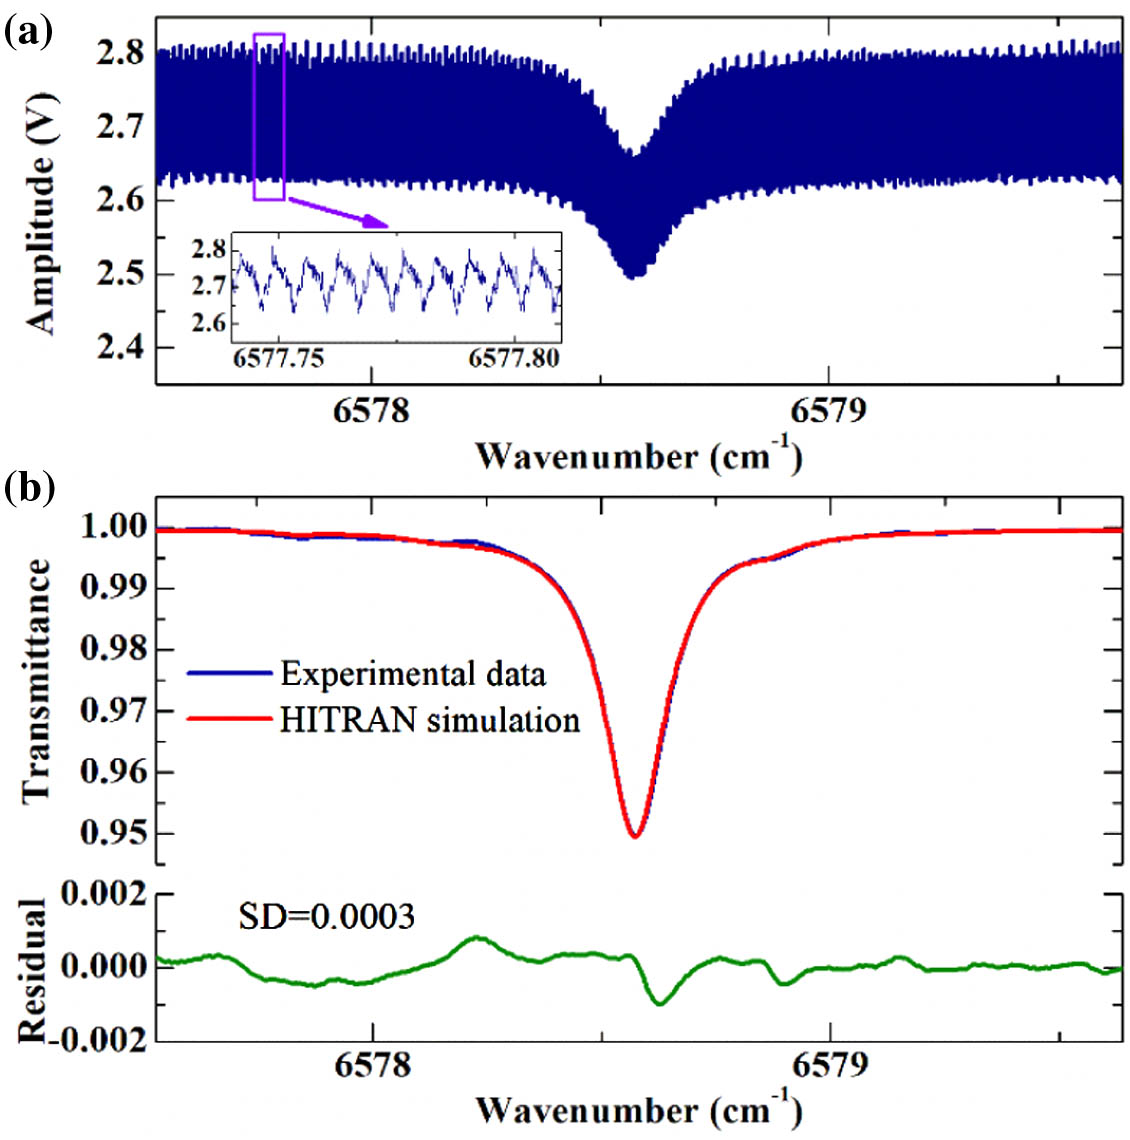
Fig. 6. Measurement results of 9.3 ppm acetylene in the transmission mode. (a) Original transmission signal acquired in one period of the laser scan. (b) Measured transmission spectrum with 10 scans averaged and the corresponding HITRAN-simulated result.
3.5 E. Evaluation of Sensing Dynamic Range
According to the Beer–Lambert law, the absorption amplitude is related to both gas concentration and absorption pathlength. Since the absorption amplitude has a nonlinear relationship with gas concentration, and the absorption pathlength in OPMAS is variable, we select the absorption coefficient, which is proportional to the gas concentration even at a large optical depth and independent of the absorption pathlength, as the optical parameter for analysis of the linear dynamic range of the system. The proportional relationship between the absorption coefficient and the gas number density is expressed as
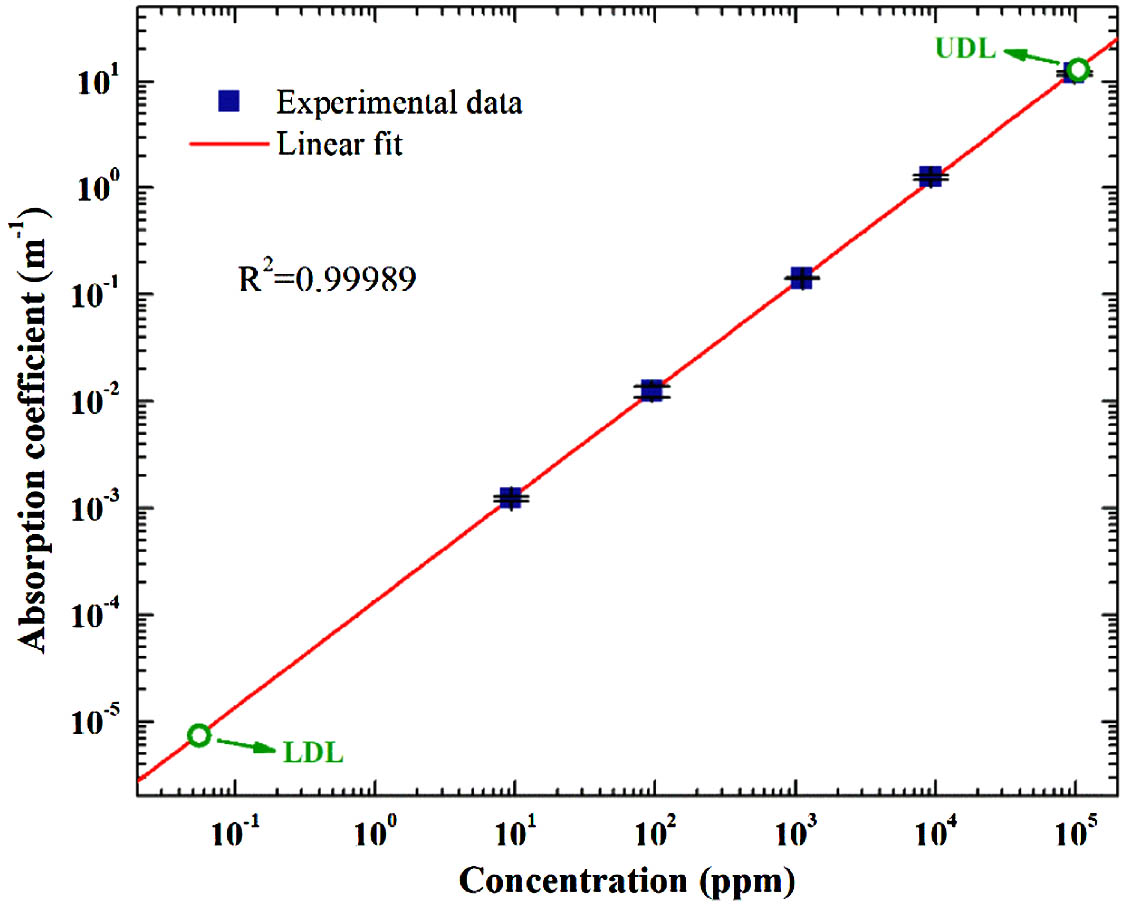
Fig. 7. Plot of
Table 1. Details of Experimental Data Used for Evaluating the Dynamic Range of Gas Sensing
|
In Fig. 7, the estimated lower detection limit (LDL) and UDL together that determine the dynamic range are also indicated. Here, the LDL is evaluated by the NEA in the transmission mode (0.0003), yielding 0.056 ppm. The UDL is evaluated based on the shortest achievable absorption pathlength of 0.359 m in the condition of 99% absorption or 1% transmittance. The estimated UDL is 10.53%, which is slightly higher than the highest concentration measured in the experiment, as shown in Fig. 5. The criterion for setting the transmittance value for the UDL evaluation is based on practical considerations. Typically, the electronic signal output from a photodetector is at the volt level. When the transmittance is less than 1%, the amplitude of the electronic signal may be below 10 mV, in which condition millivolt (mV)-level offset or drift of the detector output would significantly degrade the measurement accuracy. What is more important, in the condition of low transmittance, setting a much lower transmittance value brings only very limited increase of the UDL. For example, decreasing the transmittance by 2 orders of magnitude from 1% to 0.01%, the UDL is only doubled. The LDL and the UDL yield a dynamic range of for the present OPMAS system. It is worth noting that even for the sample gas with the highest concentration (9.8%), as presented in Table 1, the relative uncertainty of the measured absorption coefficient () is less than 1%, which indicates a high measurement accuracy.
4. DISCUSSION AND CONCLUSIONS
The dynamic range investigated in this work is especially the linear response range of a gas sensing system. Extension of the dynamic range by correction of the nonlinear response is out of scope, as this general routine could also be supplementary to the proposed OPMAS method. For a direct comparison, we list some state-of-the-art laser spectroscopic gas sensing techniques and their achieved dynamic ranges in Table 2. It is noted that for a gas sensing technique, the achievable dynamic range is independent of the measured gas. As presented in Table 2, the dynamic range achieved by the OPMAS method is 2–3 orders of magnitude larger than that of all other conventional absorption-based laser spectroscopic techniques. The OPMAS even surpasses most of the zero-background non-absorption-based methods other than the PTS sensor using a hollow-core optical fiber (HCF) as the gas cell. However, compared with the PTS, which requires complex pump–probe configurations and long, thin HCF gas cells, the absorption-based OPMAS technique has advantages of simplicity and fast response.
Table 2. Comparison of Typical State-of-the-Art Laser Spectroscopic Gas Sensors
|
One key for extending the dynamic range by OPMAS is to employ a gas cell with a high number of reflections, which determines the degree of OPL variability. In this work, the employed MPC has a pass number of 232, which makes the OPL changeable by more than 2 orders of magnitude. It can be reasonably expected that using an MPC with more pass numbers [45,46] would definitely further extend the dynamic range of the present OPMAS gas sensing system. Note that the embodiment of the multi-reflection gas cell can be other types, e.g., adopting a multi-segment HCF and using the internal connection points to achieve several weak reflections. Besides the multi-reflection scheme, OPL multiplexing may be realized by the multi-transmission scheme, e.g., placing the gas cell in a fiber loop with the light passing the gas cell multiple times.
Another aspect worth considering is that the strategy of OPL variation can be combined with the approach of using gas transition lines with different strengths. For the proposed OPMAS system, by employment of a widely wavelength-swept laser that can cover two absorption lines with the difference in line intensity more than 2 orders of magnitude, an unprecedented dynamic range at the level of can be expected. Therefore, we believe the proposed OPMAS method will pave the way for spectroscopic gas sensing in fundamental studies and industrial applications requiring a large dynamic range.
Article Outline
Xiutao Lou, Yabo Feng, Shunhu Yang, Yongkang Dong. Ultra-wide-dynamic-range gas sensing by optical pathlength multiplexed absorption spectroscopy[J]. Photonics Research, 2021, 9(2): 02000193.

