Photonics Research, 2019, 7 (11): 11000A56, Published Online: Oct. 30, 2019
Experimental test of error-disturbance uncertainty relation with continuous variables  Download: 591次
Figures & Tables
Fig. 1. (a) Principle of the test of EDR with continuous variables. A joint measurement apparatus implements the approximations of incompatible observables A B C D
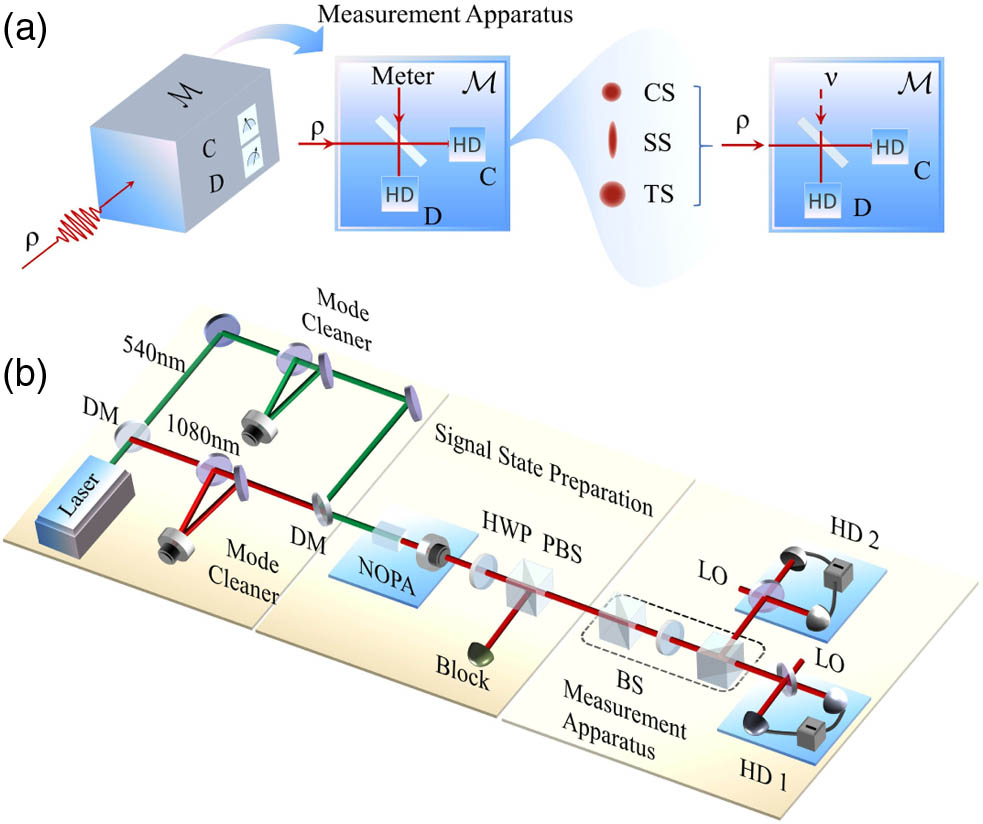
Fig. 2. Experimental results. (a), (b) and (c) Dependence of error (black curve) and disturbance (red curve) on the transmission efficiency of BS (T ) for coherent, squeezed, and thermal states, respectively. (d), (e) and (f) Lefthand sides of the EDRs with continuous variables for coherent, squeezed, and thermal states, respectively. Green curve, Heisenberg’s EDR; red curve, Ozawa’s EDR; blue curve, Branciard’s EDR. Black line, righthand side of the EDR. All experimental data agree well with the theoretical predictions. The error bars are obtained by RMS of measurements repeated ten times.

Fig. 3. Comparison of the lower bounds of EDRs for three Gaussian states. (a) Coherent state as signal mode. (b) Squeezed state as signal mode. (c) Thermal state as signal mode. Blue curve, Heisenberg bound; orange curve, Ozawa bound; green curve, Branciard bound. Black circles show experimental data. Black dotted curve shows the theoretical prediction for the experimental parameters.

Yang Liu, Haijun Kang, Dongmei Han, Xiaolong Su, Kunchi Peng. Experimental test of error-disturbance uncertainty relation with continuous variables[J]. Photonics Research, 2019, 7(11): 11000A56.


 PDF全文
PDF全文

