修正边界区域误差的共聚焦显微成像粗糙度测量  下载: 914次
Surface Roughness Measurement Using Laser Confocal Microscope with Boundary Area Correction
1 南昌大学机电工程学院, 江西 南昌 330031
2 中国科学院苏州生物医学工程技术研究所江苏省医用光学重点实验室, 江苏 苏州 215163
3 江苏省医疗器械检验所, 南京 210019
图 & 表
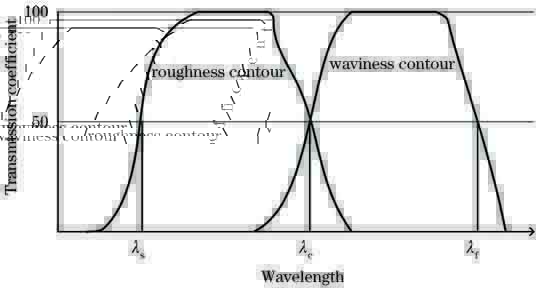
图 1. 粗糙度轮廓与波纹度轮廓的传输系数
Fig. 1. Transmission coefficients of roughness and waviness contours
下载图片 查看原文
图 2. 提取粗糙度轮廓的步骤
Fig. 2. Steps for extracting roughness contours
下载图片 查看原文
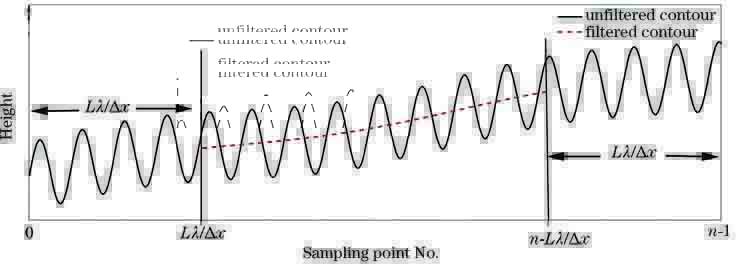
图 3. 未滤波轮廓和滤波后的轮廓
Fig. 3. Unfiltered contour and filtered contour
下载图片 查看原文
图 4. 延长后的原始轮廓与滤波后的轮廓
Fig. 4. Extended original contour and filtered contour
下载图片 查看原文
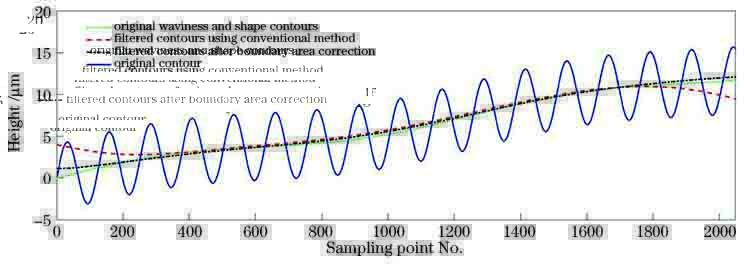
图 5. 原始轮廓及经不同方法处理后的滤波轮廓
Fig. 5. Original contour and filtered contours using different methods
下载图片 查看原文
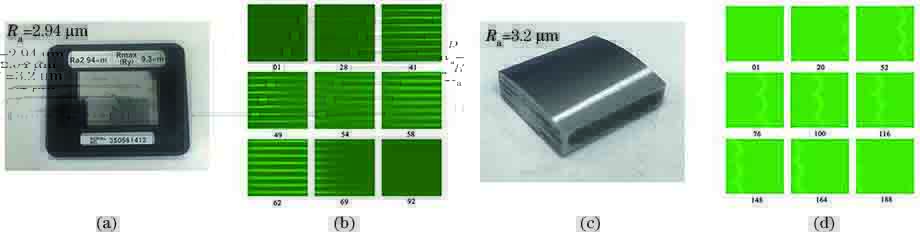
图 6. 样本图和逐层共聚焦成像结果。(a)(b)平缓样本;(c)(d)陡峭样本
Fig. 6. Sample map and layer-by-layer confocal imaging results. (a)(b) Gentle samples; (c)(d) steep samples
下载图片 查看原文
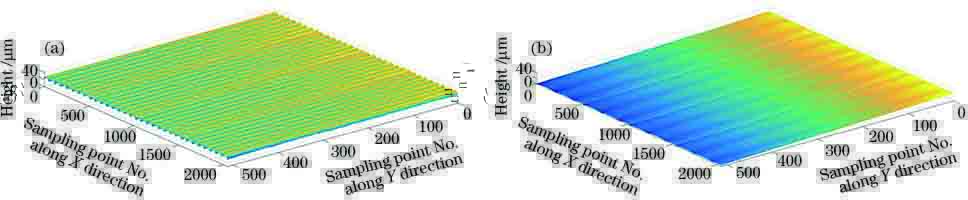
图 7. 样本的重建三维轮廓图。(a)平缓样本;(b)陡峭样本
Fig. 7. Reconstructed 3D contours of samples. (a) Smooth sample; (b) steep sample
下载图片 查看原文
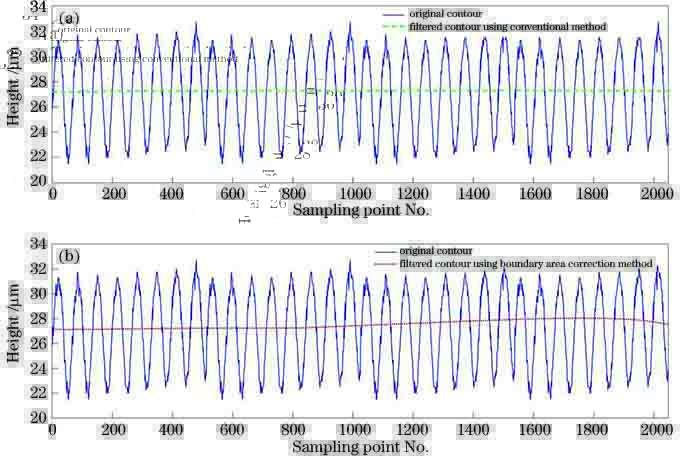
图 8. 平缓样本的实验结果。(a)常规方法;(b)修正边界区域方法
Fig. 8. Experimental results of smooth sample. (a) Conventional method; (b) boundary area correction method
下载图片 查看原文
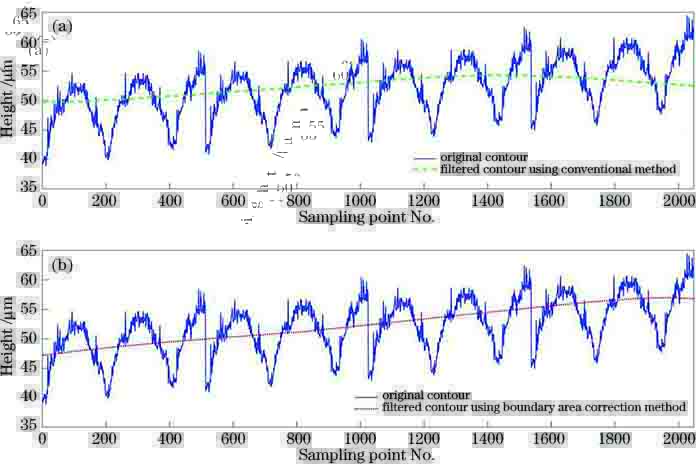
图 9. 陡峭样本的实验结果。(a)常规方法;(b)修正边界区域方法
Fig. 9. Experimental results of steep sample. (a) Conventional method; (b) boundary area correction method
下载图片 查看原文
表 1两种方法处理后的滤波轮廓与实际的轮廓的方差
Table1. Variance of actual contour and filtered contour treated by using two methods
| Method | Variance |
|---|
| Normal method | 1.1082 | | Improved method | 0.4231 |
|
查看原文
表 2取样长度lr的选取标准
Table2. Selection criteria for sampling length lr
| Roughness | lr /mm |
|---|
| 0.02 mm≤Ra<0.10 mm | 0.25 | | 0.10 mm≤Ra<2.00 mm | 0.80 | | 2.00 mm≤Ra<10.00 mm | 2.50 | | 10.00 mm≤Ra<80.00 mm | 8.00 |
|
查看原文
表 3截止波长的选取标准
Table3. Selection criteria for cut-off wavelength
| λc /mm | λs /μm |
|---|
| 0.25 | 2.5 | | 0.8 | 2.5 | | 2.5 | 8 | | 8.0 | 25 |
|
查看原文
表 4平缓样本的粗糙度值Ra
Table4. Roughness value Ra of smooth sample
| Method | Ra /μm | | | | Averagevalue /μm | Relativeerror /% | RMSE |
|---|
| 1 | 2 | 3 | 4 | 5 | 6 | 7 | 8 | |
|---|
| Normal method | 2.86 | 2.88 | 2.87 | 2.86 | 2.87 | 2.85 | 2.84 | 2.86 | 2.86 | 2.72 | 0.080 | | Improved method | 2.85 | 2.87 | 2.86 | 2.86 | 2.87 | 2.84 | 2.83 | 2.85 | 2.85 | 3.06 | 0.090 |
|
查看原文
表 5陡峭样本的粗糙度值Ra
Table5. Roughness value Ra of steep sample
| Method | Ra /μm | Averagevalue /μm | Relativeerror /% | RMSE |
|---|
| 1 | 2 | 3 | 4 | 5 | 6 | 7 | 8 |
|---|
| Normal method | 3.29 | 3.30 | 3.40 | 3.34 | 3.27 | 3.36 | 3.31 | 3.22 | 3.31 | 3.48 | 0.12 | | Improved method | 3.17 | 3.22 | 3.23 | 3.19 | 3.16 | 3.25 | 3.20 | 3.10 | 3.19 | 0.31 | 0.045 |
|
查看原文
叶寒, 翁祖昕, 张运海, 缪佳, 肖昀. 修正边界区域误差的共聚焦显微成像粗糙度测量[J]. 激光与光电子学进展, 2020, 57(21): 211203. Ye Han, Weng Zuxin, Zhang Yunhai, Miu Jia, Xiao Yun. Surface Roughness Measurement Using Laser Confocal Microscope with Boundary Area Correction[J]. Laser & Optoelectronics Progress, 2020, 57(21): 211203.


 PDF全文
PDF全文

