镍基合金激光焊凝固组织流体体积法‑相场法研究
Laser utilization as a heat source to connect nickel-based superalloys has been applied in aviation, aerospace, weapons manufacturing and other fields. Solidification behavior of the laser welding molten pool of nickel-based alloys, including the nucleation, growth, collision and movement of grains, and the diffusion, enrichment and segregation of alloying elements, directly affect nickel-based alloy laser weld performance. Therefore, in-depth research of the solidification behavior of the nickel-based alloy laser welding molten pool is of paramount significance, particularly for laser welding process optimization, welding defect formation control, and the improvement of laser weld mechanical properties.
The macroscopic heat and mass transfer coupling model alongside microstructure evolution is utilized to quantitatively simulate the macroscopic heat and mass transfer, and the microstructure evolution of a laser welded IN718 alloy. The fluid volume (VOF) method is used to simulate the molten pool morphology and temperature field distribution of the macroscopic heat transfer process, and the temperature field distribution replaces the solidification parameter variables relating to the phase field control equation and is brought into the phase field model for microstructure evolution process simulation.
The simulated and experimental microstructures are shown in Fig.6, where it can be observed that all tissues are columnar crystal structures with a consistent morphology. As shown in Fig.7(a), the solidification velocity R and temperature gradient G at different positions were extracted in the macroscopic simulation results. The solidification velocity R gradually decreased from top to bottom with the molten pool boundary, and the temperature gradient G gradually increased. The cooling rate G·R showed a decreasing trend, the dendrite spacing gradually increased, and the results are shown in Fig.7(b). Compared with the Hunt and Kurz et al. numerical models, the phase field model calculated results are more accurate and close to the experimental results, showing consistent regularity, as shown in Fig.8. The distribution of Nb elements perpendicular to the growth direction of columnar crystals in the simulation results is shown in Fig.9 (b), this shows obvious periodic changes, and the change period is closely related to the phase morphology, because the IN718 solute partition coefficient is less than 1. Solute elements tend to be segregated and enriched at the dendrite gap position. In the simulation results, the mass fraction of Nb elements inside the solid-phase dendrite is significantly reduced, and the lowest mass fraction occurs at the columnar center owing to segregation caused by solute redistribution during solidification. The mass fraction of Nb element increased significantly at the liquid phase position of columnar crystal gap, and the mass fraction of Nb element in the position was relatively higher than that closer to the bottom of the columnar crystal. From Fig.10, the Laves phase enriched by the Nb element precipitated from the IN718 molten pool after solidification is distributed in the γ phase matrix in the shape of droplets. The Laves phase morphology and distribution are approximately consistent with the simulated distribution of Nb elements. The SEM results are shown in Fig.11(b), the EDS spot scan analysis is performed on the illustrated position, with the test results shown in Figs.11(a) and (c). The mass fraction of Nb element in the matrix γ is approximately 4.7%. The mass fraction of Nb element in the Laves phase is approximately 9.8%, and the Nb element mass fraction in Laves phase is significantly higher than that in matrix γ. This proves the accuracy and reliability of the simulation results.
The results demonstrate that the simulated microstructure grows in a columnar crystal structure. The solidification rate R of the molten pool gradually decreases from top to bottom, the temperature gradient G gradually increases, the cooling rate G*R decreases continuously, and the primary dendrite arm spacing increases with the decrease in cooling rate, from 4.52 to 7.12 μm, which is consistent with the experimental results. The mass fraction of Nb elements in the columnar crystal spacing increased significantly, and this mass fraction was relatively higher near the bottom of the columnar crystals in the liquid phase. The Nb elements are finally distributed in the shape of droplets and approximately consistent with the Laves phase in morphology and distribution, which is also consistent with the experimental results. The microstructure transformation process and elemental segregation behavior of IN718 in laser welding are examined, and the solidification theory of the laser welding molten pool of nickel-based alloys is enriched. Finally, this research provides a foundation for a numerical solution of the defect formation process for laser welding IN718 cracks and pores.
1 引言
镍基合金具有良好的高温性能、抗氧化性和抗燃气腐蚀能力,已被广泛用来制造航空喷气发动机和各种工业燃气轮机的热端部件[1-2],具有“超合金”的美誉。目前,在航空、航天、兵器制造等领域[3-4],激光焊接技术已成为镍基合金的主要连接手段之一。由于激光焊接熔池结晶速度快,镍基合金激光焊接过程容易产生偏析、气孔、裂纹等问题,直接影响了镍基合金激光焊缝的性能[5]。因此,深入研究镍基合金激光焊接熔池的微观结构和偏析行为,对于控制焊接缺陷的形成和提高激光焊缝的力学性能具有重要意义。激光焊接熔池的凝固过程是一个快速加热后的冷却过程,具有熔池体积小、冷却速度快、液态金属过热等特点,通过传统的实验手段难以对熔池的凝固过程进行实时的完全检测[6]。
对比其他组织模拟方法,蒙特卡罗法虽然模拟效率高,但缺乏物理基础,难以准确真实地模拟合金的凝固过程[7]。元胞自动机方法在模拟凝固过程中的晶粒竞争和形态转变方面具有一定优势[8],但计算结果不够精确,难以对凝固组织的演化过程进行定量计算。相场(PF)法在熔池凝固微观组织演变过程的定量模拟方面有着突出优势,PF模型可以直接模拟熔池中的凝固行为以及微观结构的演变,例如形貌、枝晶间距和元素偏析等,同时它还定量地考虑了固液界面曲率、生长动力学、各向异性等对枝晶生长的影响,在焊接、增材制造等加工过程的凝固微观组织模拟中得到了广泛应用[9]。Wang等[10]通过PF模型模拟了激光焊接过程中不同焊接条件下柱状晶粒的生长,对柱状晶粒的形貌、枝晶间距和生长方向进行了分析。Radhakrishnan等[11]使用PF模型预测了激光粉末床熔融镍基合金过程中晶粒的生长,发现晶粒形貌与枝晶间距有关:当枝晶间距小于临界值时,柱状微观结构持续增长;当枝晶间距大于临界值时,柱状结构通过形成次级臂演变成柱状树枝状结构。Mi等[12]使用二维PF模型研究了Al-Cu合金激光焊接过程中不同取向晶粒之间的竞争生长行为,发现横向生长、偏转角和侧边枝晶对枝晶宽度有影响。耿韶宁[13]采用多尺度数值模拟对铝合金薄板激光焊接过程中的熔池传热和流动行为、凝固参数分布、凝固微观组织演化进行了研究。PF模型的最大问题在于效率低,一般适用于二元合金,而且多集中于研究较小的局部区域。
笔者以IN718合金激光焊接熔池的凝固过程为研究对象,通过建立宏观传热传质模型与微观组织演变的宏-微观耦合模型,计算了激光焊接的宏观传热过程,提取得到了熔池温度历史、凝固速度等熔池凝固条件。利用PF模型耦合熔池凝固条件,对激光焊接IN718熔池的凝固行为进行定量数值模拟,分析了柱状晶演变、形貌、间距、元素扩散与偏析等重要的凝固过程数据。利用高速摄像技术、扫描电子显微镜技术(SEM)、能谱(EDS)分析等,验证了激光焊接宏-微观模拟结果的准确性。
2 模型和实验
2.1 宏观传热模型
根据参考文献[14],激光焊接宏观传热与熔体流动满足连续性方程、动量守恒方程、能量守恒方程。
激光焊接匙孔、熔池自由表面的瞬态变形由流体体积(VOF)模型跟踪,焊接驱动力、边界条件以及基本假设条件参考文献[15]。
激光焊接过程中,由金属蒸气引起的反冲压力的表达式为
式中:A为调整系数,取0.55;B0为调整常数,取1.78×10¹⁰;Tw为匙孔壁面温度;Ma为原子质量;Hv为蒸发潜热;NA为阿伏伽德罗常数;kb为斯蒂芬-玻尔兹曼常数。
表面张力的表达式为
式中:Tm为熔点;T为某时刻的温度;
根据Boussinesq近似,密度梯度变化引起的浮力值的表达式为
式中:Tl为液相线温度;ρ0为Boussinesq参考密度项;g为重力加速度的大小;β为热膨胀系数。
对于匙孔壁面,将激光吸收、热吸收、辐射及蒸发的一系列热边界条件作为能量方程的源项,其表达式为
式中:
热源模型如
式中:Q0是热源上表面的热流峰值,

图 1. 热源模型示意图以及网格模型。(a)热源模型示意图;(b)网格模型
Fig. 1. Schematic of heat source model and grid model. (a) Schematic of heat source model; (b) grid model
根据激光焊接IN718合金实验数据建立激光焊接网格模型,如
2.2 微观PF模型
本文使用的PF模型的详细推导和验证可参考文献[17]。单相二元合金凝固过程中的PF控制方程表示为
其中,
式中:z表示枝晶界面位置;w为界面厚度;Γ为Gibbs-Thomson系数;k为平衡分配系数;c∞为溶质的初始质量分数;
浓度场演化方程表示为
式中:φ为引入的相场参量,φ=-1时为液相,φ=+1时为固相;ϕ为相场参量;q(ϕ)=(1-ϕ)/2。
用过饱和场U来表示溶质偏析过程,过饱和场
在忽略潜热和对流的影响后,为得到与温度场分布相关的相场控制方程,采用焊接过程中所谓的“冻结温度近似”假设,得到温度表达式[18]为
式中:
耦合方程(11)、(15)可以得到
为了考虑动态变化的凝固速度R和温度梯度G 的非线性变化,本文将这两个控制条件分别表达成与时间相关的函数。与温度场分布相关的PF控制方程为
PF模拟的计算域尺寸为
IN718合金的物理化学性能[19]见
表 1. IN718的材料参数[19]
Table 1. Material properties of the IN718 alloy[19]
|
2.3 实验方法
实验装置如
3 模拟结果分析
3.1 宏观传热模拟结果
熔池呈椭球状拖尾形貌,其前端可见激光焊接匙孔,如

图 3. 温度场模拟结果。(a)激光匙孔;(b)熔池上表面;(c)熔池的横截面;(d)熔池的纵向截面
Fig. 3. Temperature field simulation results. (a) Laser keyhole; (b) upper surface of the molten pool; (c) cross-section of the molten pool; (d) longitudinal cross-section of the molten pool
3.2 微观模拟结果
3.2.1 枝晶形貌

图 5. 微观结构演变过程。(a)平面晶推进;(b)界面失稳;(c)竞争生长;(d)稳定生长
Fig. 5. Microstructure evolution process. (a) Planar crystal propulsion; (b) interface instability; (c) competitive growth; (d) stable growth
3.2.2 枝晶间距
模拟熔池中1~4位置点的熔池凝固条件,并将测得的枝晶间距与模拟结果进行对比。模拟微观组织与实验微观组织如
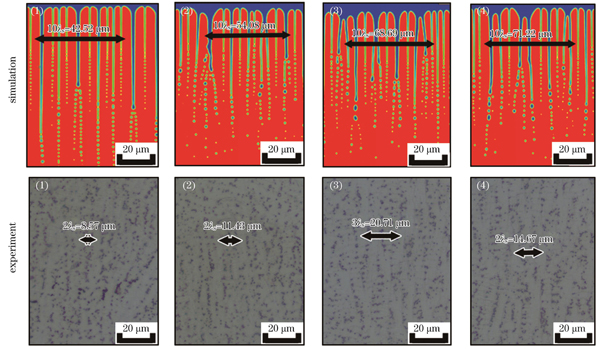
图 6. 模拟与实验微观组织的枝晶间距对比
Fig. 6. Comparisons of primary dendrite arm spacing for simulated and experimental microstructures
在宏观模拟结果中提取不同位置的凝固速度R和温度梯度G,沿着熔池边界自上而下,凝固速度R由6.7 mm/s逐渐减小到3.1 mm/s,温度梯度G由410 K/mm逐渐增大到673 K/mm,结果如
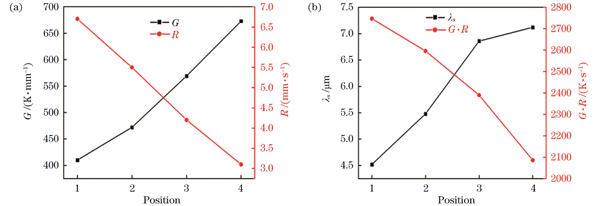
图 7. 不同位置处的参数。(a)提取的凝固参数;(b)枝晶间距与冷却速率
Fig. 7. Parameters in different positions. (a) Extracted solidification parameters; (b) the primary dendrite arm spacing and cooling rate
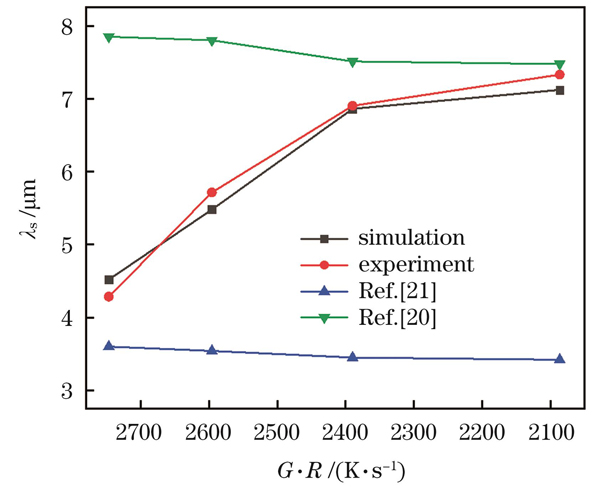
图 8. 实验与模拟的枝晶间距对比
Fig. 8. Comparison of simulated and experimental primary dendrite arm spacings
3.2.3 Nb元素偏析
分析熔池凝固过程中Nb元素的偏析行为有助于控制析出相的生成与分布,从而进一步改善组织和力学性能。在熔池凝固过程中,随着柱状枝晶生长,固相中溶解度较低的Nb元素不断通过固液界面向液相中扩散。沿着枝晶生长方向,位置点2处柱状晶轴线上Nb元素的分布如
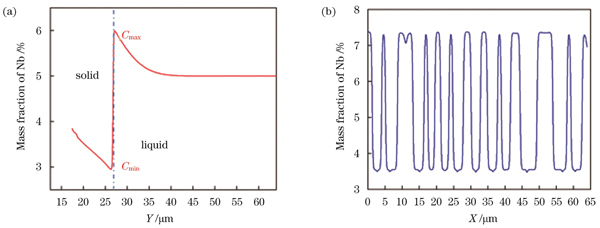
图 9. Nb元素分布。(a)沿枝晶生长方向的Nb元素分布;(b)垂直于枝晶生长方向的Nb元素分布
Fig. 9. Nb element distribution. (a) Distribution of Nb element along the dendrite growth direction; (b) distribution of Nb element perpendicular to the dendrite growth direction
模拟所得的柱状晶组织与Nb元素分布如

图 10. 实验结果与溶质场模拟结果对比
Fig. 10. Comparison of experimental and solute field simulated results
SEM扫描结果如

图 11. SEM和EDS分析结果。(a)Laves相的EDS分析结果;(b)SEM图;(c)基体的EDS分析结果
Fig. 11. SEM and EDS analysis. (a) EDS result of Laves phase; (b) SEM image; (c) EDS result of the matrix
4 结论
本文建立了宏观传热传质与微观组织演变的宏-微观耦合模型,对IN718合金激光焊接熔池宏观传热以及微观组织的动态凝固过程进行了模拟研究,得到如下结论:
1)宏观模拟所得熔池形貌、尺寸与实验结果一致。数据显示,从熔池顶部到底部,凝固速度R由6.7 mm/s逐渐减小到3.1 mm/s,温度梯度G由410 K/mm逐渐增大到673 K/mm,对应冷却速率G·R由2747 K/s逐渐下降到2086.3 K/s。
2)PF模拟结果表明,微观组织呈明显的柱状晶结构,枝晶间距从熔池顶部的4.52 μm增大到熔池底部的7.12 μm,比Kurz等[20]和Hunt等[21]的模型更加贴近实验测量结果。
3)模拟结果表明,Nb主要在枝晶间隙富集偏析,呈液滴状分布在基体中,而且越靠近柱状晶底部含量相对越高,与实验结果一致。
本文研究了激光焊接IN718合金微观组织转变过程与元素偏析行为,丰富了镍基合金激光焊接熔池凝固理论,为激光焊接IN718合金中裂纹、气孔等缺陷形成过程的数值求解奠定了基础。
[1] 张杰, 张群莉, 姚建华, 等. 激光熔覆IN718合金工艺优化及界面组织性能分析[J]. 中国激光, 2022, 49(16): 1602021.
[2] 王予, 黄延禄, 杨永强. 同轴送粉激光定向能量沉积IN718的数值模拟[J]. 中国激光, 2021, 48(6): 0602115.
[3] 李旺, 杨立军, 黄一鸣, 等. TC4钛合金激光焊接等离子体电信号熔透特征研究[J]. 中国激光, 2022, 49(22): 2202018.
[4] 黄嘉森, 蔡创, 刘致杰, 等. Inconel690镍基合金/SUS304不锈钢激光焊接接头组织与力学性能[J]. 光学学报, 2023, 43(10): 1014001.
[5] Asta M, Beckermann C, Karma A, et al. Solidification microstructures and solid-state parallels: recent developments, future directions[J]. Acta Materialia, 2009, 57(4): 941-971.
[6] 王磊. 2A14铝合金激光焊接熔池微观组织演变相场法研究[D]. 南京: 南京航空航天大学, 2018.
WangL. Study on microstructure evolution of molten pool in laser welding of 2A14 aluminum alloy by phase field method[D]. Nanjing: Nanjing University of Aeronautics and Astronautics, 2018.
[7] 刘芸. 铝锂合金激光焊接熔池凝固过程微观组织建模与仿真研究[D]. 南京: 南京航空航天大学, 2018.
LiuY. Modeling and simulation of microstructure in solidification process of Al-Li alloy laser welding pool[D]. Nanjing: Nanjing University of Aeronautics and Astronautics, 2018.
[8] Yin H, Felicelli S D. Dendrite growth simulation during solidification in the LENS process[J]. Acta Materialia, 2010, 58(4): 1455-1465.
[9] Yu F Y, Wei Y H, Liu X B. The evolution of polycrystalline solidification in the entire weld: a phase-field investigation[J]. International Journal of Heat and Mass Transfer, 2019, 142: 118450.
[10] Wang L, Wei Y H, Chen J C, et al. Macro-micro modeling and simulation on columnar grains growth in the laser welding pool of aluminum alloy[J]. International Journal of Heat and Mass Transfer, 2018, 123: 826-838.
[11] Radhakrishnan B, Gorti S B, Turner J A, et al. Phase field simulations of microstructure evolution in IN718 using a surrogate Ni–Fe–Nb alloy during laser powder bed fusion[J]. Metals, 2018, 9(1): 14.
[12] Mi G Y, Xiong L D, Wang C M, et al. Two-dimensional phase-field simulations of competitive dendritic growth during laser welding[J]. Materials & Design, 2019, 181: 107980.
[13] 耿韶宁. 铝合金薄板激光焊接熔池凝固组织演变的多尺度模拟研究[D]. 武汉: 华中科技大学, 2020. 10.1016/j.ijheatmasstransfer.2019.119252
GengS N. Multi-scale simulation study on solidification structure evolution of molten pool in laser welding of aluminum alloy sheet[D]. Wuhan: Huazhong University of Science and Technology, 2020.
[14] Chang B H, Allen C, Blackburn J, et al. Fluid flow characteristics and porosity behavior in full penetration laser welding of a titanium alloy[J]. Metallurgical and Materials Transactions B, 2015, 46(2): 906-918.
[15] 庞盛永. 激光深熔焊接瞬态小孔和运动熔池行为及相关机理研究[D]. 武汉: 华中科技大学, 2011.
PangS Y. Study on transient keyhole and moving molten pool behavior and related mechanism in laser deep penetration welding[D]. Wuhan: Huazhong University of Science and Technology, 2011.
[16] 胥国祥. 激光+GMAW-P复合热源焊焊缝成形的数值模拟[D]. 济南: 山东大学, 2009. 10.3321/j.issn:0412-1961.2009.01.018
XuG X. Numerical simulation of weld formation in laser +GMAW-P hybrid heat source welding[D]. Jinan: Shandong University, 2009.
[17] Zheng W J, Dong Z B, Wei Y H, et al. Phase field investigation of dendrite growth in the welding pool of aluminum alloy 2A14 under transient conditions[J]. Computational Materials Science, 2014, 82: 525-530.
[18] 余枫怡. 铝铜合金TIG焊熔池凝固过程组织演化的相场法模拟[D]. 南京: 南京航空航天大学, 2018.
YuF Y. Simulation of microstructure evolution during solidification of molten pool in aluminum-copper alloy TIG welding by phase field method[D]. Nanjing: Nanjing University of Aeronautics and Astronautics, 2018.
[19] Wang L, Li H, Song Y, et al. Investigation of dendrite growth, Nb segregation during laser IN718 deposition via volume of fluid-phase field modeling[J]. Journal of Materials Research and Technology, 2022, 21: 404-415.
[20] Kurz W, Fisher D J. Dendrite growth at the limit of stability: tip radius and spacing[J]. Acta Metallurgica, 1981, 29(1): 11-20.
[21] Hunt J D, Lu S Z. Numerical modeling of cellular/dendritic array growth: spacing and structure predictions[J]. Metallurgical and Materials Transactions A, 1996, 27(3): 611-623.
[22] MaguireM C, MichaelJ R. Weldability of alloy 718, 625 and variants ]∥Loria E A. Superalloys 718, 625, 706 and Various Derivatives (1994). [S.l.: s.n.], 1994.
[23] DuPont J N, Notis M R, Marder A R, et al. Solidification of Nb-bearing superalloys: part I. reaction sequences[J]. Metallurgical and Materials Transactions A, 1998, 29(11): 2785-2796.
Article Outline
李奕辰, 王磊, 李赫, 彭勇, 蔡润欢, 王克鸿. 镍基合金激光焊凝固组织流体体积法‑相场法研究[J]. 中国激光, 2024, 51(12): 1202102. Yichen Li, Lei Wang, He Li, Yong Peng, Runhuan Cai, Kehong Wang. Solidification Microstructure Volume of Fluid Phase Field Model for Laser Welding Nickel‑Based Alloys[J]. Chinese Journal of Lasers, 2024, 51(12): 1202102.
