空间约束对激光诱导等离子体演化和光谱的影响
Laser-induced breakdown spectroscopy (LIBS) is a valuable element analysis method that has been widely applied in many fields including biomedical, industrial, and environmental analysis. It uses a pulsed laser beam to interact with the sample and produces a plasma plume above the sample surface. The emission spectra of the specific elements can be obtained from the plasma, and element compositions and contents of the sample can be gained by spectral analysis. The properties of plasma and sample analysis depend on the related parameters of the LIBS system, which includes the laser pulse and physical situation of the sample. Related works have been carried out to describe the effects of such conditions on laser-induced plasma through numerical simulation. Spatial confinement is an effective method to enhance LIBS signals. The plasma evolution, including its morphological characteristics, is affected by the presence of the cavity. The plasma confined by the cavity is physically modified, with its morphology changed, because of its interaction with the cavity walls. In this work, the effects of spatial confinement on plasma evolution and spectra in LIBS are investigated by the model. The laser-induced plasma plume of Al with or without the cavity is analyzed, and numerical information on the plasma particles is acquired during the expansion of plasma. In addition, the distributions of electron number density and electron temperature are studied. According to the plasma evolution data, the specific spectral signal intensities of the cases with different cavity widths are calculated. Under the same conditions as the simulation, experiments are performed to show the enhancement effect on signal intensity with the presence of the cavity and make a comparison with the simulation.
In this study, Al is employed as the sample material for the laser-induced plasma. Firstly, the initial conditions of the simulation process are determined, including relevant parameters of the incident laser, the spatial state of the sample (cavities with different sizes), and the boundary conditions of the simulation region. Given the state equation of the plasma evolution process and the simulation program FLASH, relevant data of the plasma can be obtained, including the plasma morphology and the spatial and temporal distributions of electron number density and electron temperature. Then, through the Saha equation and Boltzmann equation, the electron distribution information on the specific energy level can be further calculated. On the basis of the electron transition probability and absorption coefficient equation, the spectral intensity per unit can be acquired. After that, the overall spectral signal intensity is gained by the integration of the spectral signal of the acquisition region. In addition, experiments are conducted according to the parameters of the simulation, and the spectral signal intensities under different cavity widths are collected for further analysis combined with the simulation.
The plasma evolution is significantly different in the case with or without the cavity. When the cavity exists, the expansion of plasma is affected by cavity walls, and the plasma morphology varies (Fig. 3). At the position of 1.0 cm above the Al surface, both the electron temperature and electron number density are enhanced (Fig. 5). This is because the shock wave produced by the laser-induced plasma is reflected by the wall, and then the reflected shock wave acts on the plasma and raises collision probabilities of particles in the plasma, which increases the electron number density and electron temperature and eventually leads to improvement of the spectral signal. The spatial confinement effect on plasma also contributes to the increase in the spectral signal intensity, the enhancement effect depends heavily on cavity width, and the maximum signal intensity is obtained at the width of 1.4 cm (Fig. 8). In addition, the tendency of the spectral signal intensity collected by the experiments is in good agreement with the simulation, which demonstrates good reliability of the simulation (Fig. 9).
In the present study, a two-dimension thermal model for nanosecond pulsed laser ablation of Al is developed to investigate the effect of spatial confinement on plasma evolution. The simulation yields numerical information on the spatial and temporal distributions of the plasma affected by cavities with different sizes. It can provide a reference for selecting the appropriate optical signal acquisition time and location in the experiments and a credible interpretation of the experimental data. When a cavity is present, the temperature and density of the plasma are enhanced, and the enhancement degrades as the cavity enlarges. The spatial and temporal distributions of electron temperature and electron number density are also studied for the calculation of signal intensity. Compared with the situation without the cavity, the signal intensity is significantly improved when a proper cavity exists. The maximum signal intensity is obtained at the cavity width of 1.4 cm, and this value is drastically improved compared to the case without the cavity. The variation trend of signal intensity with cavity widths obtained by the experiments matches well with the simulation. Moreover, it is shown that the presence of a cavity does not improve the signal intensity in all cases. A larger cavity width leads to weaker enhancement of plasma temperature and density, and signal acquisition is slightly affected by the presence of the walls. Both the simulation and experimental results suggest that the intensity is lower than that of the situation without a cavity when the cavity width is set to 2.0 cm.
1 引言
激光诱导击穿光谱(LIBS)是一种有价值的元素分析方法,已被广泛应用于生物医学[1-3]、工业[4-5]和环境[6-7]分析等诸多领域中。它利用脉冲激光束与样品相互作用在样品表面上方产生等离子体羽流,从等离子体辐射中可以得到特定元素的发射光谱。通过光谱分析可以得到样品的元素组成和含量。LIBS是一种方便、高效的检测方式,具有检测快速、无需或只需简单的样品制备和对样品损伤小等优点。同时,光谱信号的采集分析过程易受基体效应、自吸收效应和周围空气环境等多种因素影响[8-10]。
一般来说,等离子体性质和样品分析取决于LIBS系统相关参数,包括激光脉冲和样品物理状况[11-12]。已有许多相关工作通过数值模拟描述了这些条件对激光诱导等离子体的影响。Hirayama等[13]和Aghaei等[14]分别建立了飞秒和纳秒时间尺度脉冲激光烧蚀Cu的热模型,显示了不同等离子体的内部特性,如电子温度和数密度。此外,研究表明在真空环境中等离子体的温度和密度较大气环境得到了很好的提高和维持,两种等离子体羽流的形态特征也有很大的不同[15]。虽然等离子体的形态特征主要取决于等离子体的内部特征,但是在光谱信号采集过程中,分析等离子体的空间分布特性并设置合理的收集角度也是提高光谱信号的可能办法[16-17]。
空间约束是增强LIBS信号的有效手段[18-19]。等离子体的演化会因腔体的存在而受到影响,包括其形态特征。由于等离子体与空腔壁的相互作用,等离子体在空腔中的演化过程受到调制,故其形态发生变化。这一过程限制了等离子体羽流的膨胀,并导致羽流内部粒子的碰撞,为羽流提供了额外的能量,增强了等离子体的光谱发射[20]。本文利用激光诱导铝等离子体的动态模型研究了空间约束对激光诱导击穿光谱中等离子体演化和光谱信号的影响,对有无空腔情况下的激光诱导铝等离子体羽流进行了分析,得到了等离子体膨胀过程中粒子的数值信息,并进一步研究了电子数密度和温度的分布特性。根据等离子体演化过程中的数值信息,计算了不同空腔宽度情况下的特定光谱信号强度。在与仿真相同的参数条件下,通过实验验证了空腔的存在对信号强度的增强效果,并与仿真结果进行了对比。
2 理论
激光作用于物质激发等离子体,产生了离子、中性粒子和自由电子。等离子体的这些组分可以发生相互作用并伴随着能量交换。等离子体的这一演化过程可以用辐射气体动力学来描述,并通过欧拉方程给出其内部特性[20-21],即
式中:
通过求解式(
在LTE条件下,不同电离态下铝的数密度由Saha方程得到,即
式中:
铝不同电离态的布居数服从玻尔兹曼分布
式中:
由此可以推导出谱线的积分强度(波长为
式中:
3 仿真与分析
为了研究空间约束效应对等离子体演化的影响,模型考虑了空腔的存在。仿真选用金属铝作为材料,并设置了不同尺寸的空腔。激光诱导等离子体的膨胀被限制在10 cm×6 cm大小的模拟区域内,区域的底部是具有特定尺寸的空腔,垂直入射的激光脉冲聚焦在空腔中心材料的表面,区域的其他部分填充氦气(作为环境气体)。入射激光的参数为单脉冲激光能量为60 mJ、脉冲宽度为6 ns和激光波长为1064 nm,出射光斑直径为6 mm,聚焦后光斑直径为30 μm。激光垂直样品表面入射,光谱探测角度与入射激光成30°夹角。主要研究了空腔宽度变化对等离子体的影响,将空腔的高度设置为固定值(1.0 cm),宽度变化范围为1.0~2.0 cm,间隔为0.2 cm。
3.1 等离子演化

图 1. 存在空腔(空腔宽度为1.4 cm)时等离子体温度随时间的变化
Fig. 1. Plasma temperature varying with time in presence of cavity (cavity width of 1.4 cm)

图 2. 存在空腔(空腔宽度为1.4 cm)时等离子体密度随时间的变化
Fig. 2. Plasma density varying with time in presence of cavity (cavity width of 1.4 cm)

图 3. 时间为1000 ns时有无腔体条件下等离子体的温度和密度。(a)温度;(b)密度
Fig. 3. Temperature and density of plasma with or without cavity at simulation time of 1000 ns. (a) Temperature; (b) density
当时间到达1400 ns时,增强效应开始减弱,等离子体继续在腔体上方膨胀。腔内等离子体冷却,电子温度显著降低。因此,应考虑合适的信号采集时间,以避免等离子体冷却导致光谱辐射的过度衰减,进而造成最终获得的光谱信号强度降低。
3.2 电子的空间分布
腔体对等离子体演化的影响如3.1节所述,腔壁的存在对等离子体的空间膨胀过程会造成很大的影响。

图 4. 铝板表面上方不同位置处电子温度随时间的变化
Fig. 4. Electron temperature varying with time at different positions above Al surface

图 5. 铝板表面上方不同位置处电子数密度随时间的变化
Fig. 5. Electron number density varying with time at different positions above Al surface
3.3 腔体对电子温度和电子数密度的影响
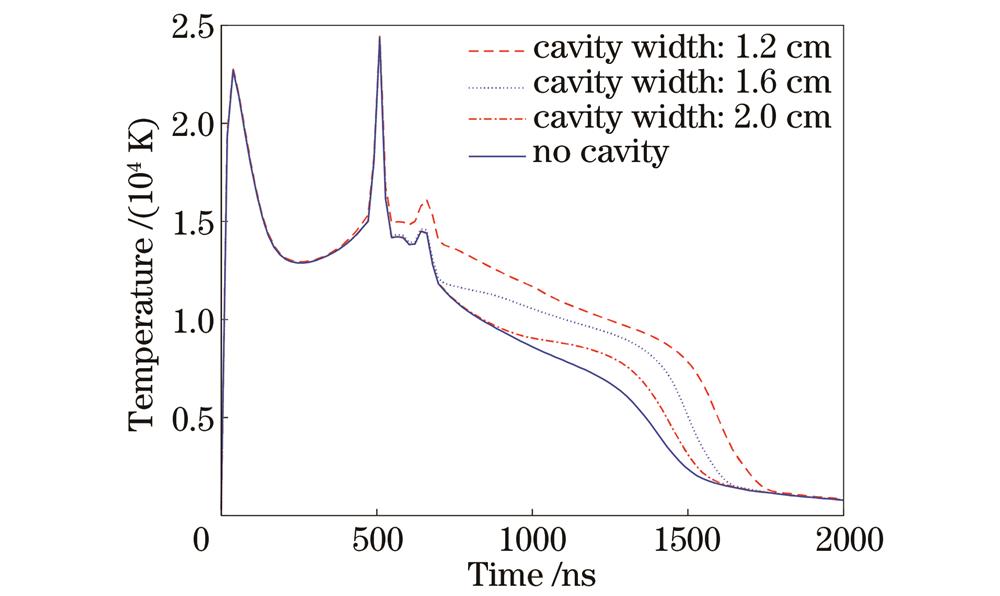
图 6. 有无空腔的情况下铝板表面上方1 cm处电子温度随时间的变化
Fig. 6. Electron temperature varying with time at 1 cm above Al surface with or without cavity
另一方面,如
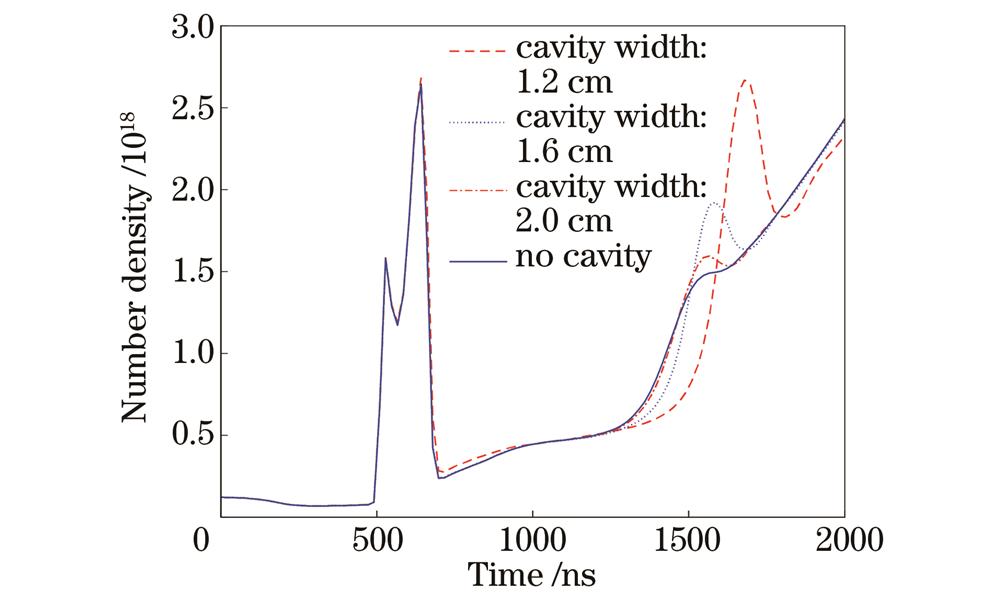
图 7. 有无空腔的情况下铝板表面上方1 cm电子数密度随时间的变化
Fig. 7. Electron number density varying with time at 1 cm above Al surface with or without cavity
3.4 光谱信号强度
根据电子的温度、电子的数密度和式(
式中:
式中:z为铝元素的电离度;
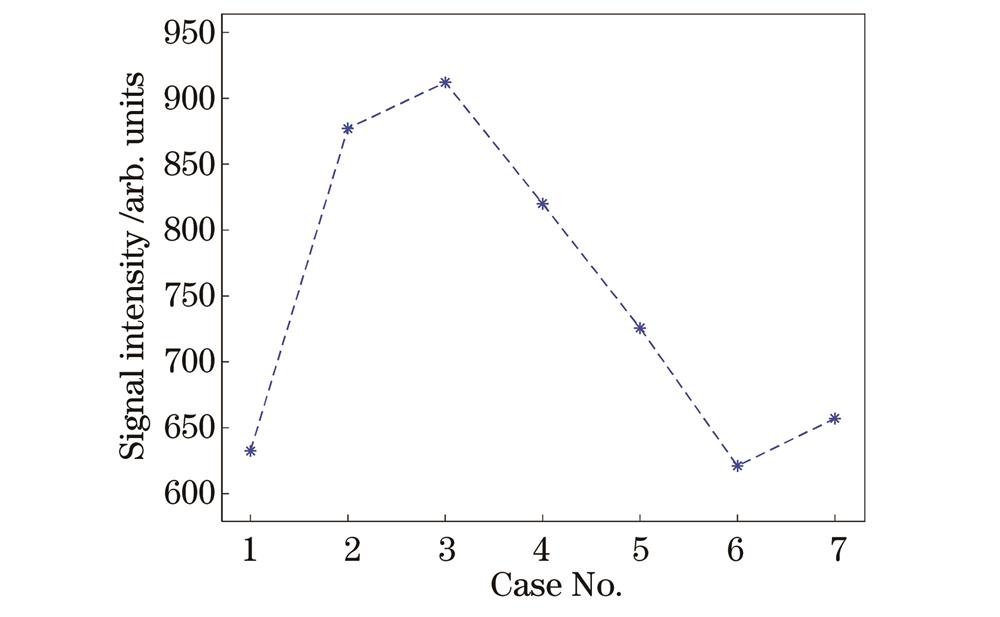
图 8. 仿真得到的铝在396.15 nm波长处的光谱信号强度
Fig. 8. Spectral signal intensity of Al at wavelength of 396.15 nm obtained by simulation
4 实验
实验配置同仿真参数一致,包括调Q Nd∶YAG激光器(Quantel 公司,Q-Smart 450),工作波长为1064 nm,重复频率为10 Hz,光束直径为6.5 mm,脉冲持续时间为6 ns和脉冲能量为60 mJ。激光束经镜面反射后利用显微物镜将其聚焦到样品表面。样品表面激光光斑直径约为30 μm。通过准直透镜在与激光束轴成30°角处收集发射光谱,再将其耦合到光纤中。该光纤将光谱发射送入一个Czerny-Turner光谱仪(Andor公司,Shamrock 750-D2)中。该光谱仪配备了增强电荷耦合装置(ICCD,Andor公司,iStar DH334T-18F-E3)来记录光谱,光谱仪采集信号的延迟时间为1 μs,积分门宽为0.5 ms,实验在常规的大气条件下进行。光谱仪的分辨率为0.03 nm,光栅的栅线密度为1800
实验结果如
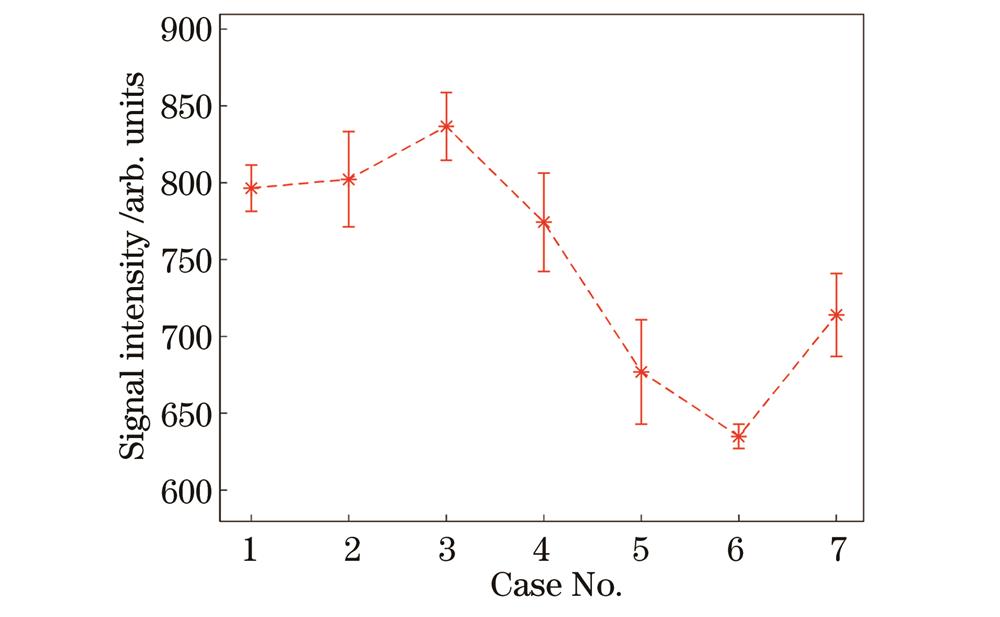
图 9. 实验得到的铝在396.15 nm波长处的光谱信号强度
Fig. 9. Spectral signal intensity of Al at wavelength of 396.15 nm obtained by experiment
5 结论
建立了纳秒脉冲激光烧蚀铝的二维模型,研究了空间约束对等离子体演化的影响。模拟结果为不同尺寸空腔影响下等离子体的时空分布提供了数值信息,为实验中选择合适的光信号采集时间和位置提供了有效参考,并为实验数据提供了一种可信的解释。当腔体存在时,等离子体的温度和密度都有所提高,但随着腔体尺寸的增大,这种提高程度有所减弱。为计算信号强度,还研究了电子温度和电子数密度的时空分布。与没有空腔的情况相比,当合适的空腔存在时,信号强度明显提高。1.4 cm空腔宽度处得到了最大的信号强度,与没有空腔的情况相比显著增加。实验得到的信号强度随不同宽度的变化趋势与仿真结果吻合得较好。结果还表明,并非所有的空腔尺寸都能够增强信号强度,即空腔宽度越大,其对等离子体温度和密度的增强作用越弱,腔壁的存在也会轻微影响信号的采集过程。仿真和实验结果均表明,当空腔宽度为2.0 cm时,光谱信号强度甚至低于无空腔时的信号强度。
[1] Alsharnoubi J, Nassef Y, Fahmy R F, et al. Using LIBS as a diagnostic tool in pediatrics beta-thalassemia[J]. Lasers in Medical Science, 2021, 36(5): 957-963.
[2] Rehse S J. A review of the use of laser-induced breakdown spectroscopy for bacterial classification, quantification, and identification[J]. Spectrochimica Acta Part B: Atomic Spectroscopy, 2019, 154: 50-69.
[3] Wei H Y, Zhao Z, Lin Q Y, et al. Study on the molecular mechanisms against human breast cancer from insight of elemental distribution in tissue based on laser-induced breakdown spectroscopy (LIBS)[J]. Biological Trace Element Research, 2021, 199(5): 1686-1692.
[4] Lu P, Zhuo Z, Zhang W H, et al. Determination of calorific value in coal by LIBS coupled with acoustic normalization[J]. Applied Physics B, 2021, 127(6): 82.
[5] 邱苏玲, 李安, 王宪双, 等. 基于激光诱导击穿光谱的矿石中铁含量的高准确度定量分析[J]. 中国激光, 2021, 48(16): 1611002.
[6] Zhang Y, Zhang T, Li H. Application of laser-induced breakdown spectroscopy (LIBS) in environmental monitoring[J]. Spectrochimica Acta Part B: Atomic Spectroscopy, 2021, 181: 106218.
[7] Živković S, Botto A, Campanella B, et al. Laser-induced breakdown spectroscopy elemental mapping of the construction material from the Smederevo Fortress (Republic of Serbia)[J]. Spectrochimica Acta Part B: Atomic Spectroscopy, 2021, 181: 106219.
[8] Hou Z Y, Wang Z, Yuan T B, et al. A hybrid quantification model and its application for coal analysis using laser induced breakdown spectroscopy[J]. Journal of Analytical Atomic Spectrometry, 2016, 31(3): 722-736.
[9] Lepore K H, Fassett C I, Breves E A, et al. Matrix effects in quantitative analysis of laser-induced breakdown spectroscopy (LIBS) of rock powders doped with Cr, Mn, Ni, Zn, and Co[J]. Applied Spectroscopy, 2017, 71(4): 600-626.
[10] 龚停停, 田野, 陈倩, 等. 不同颗粒度铁屑LIBS光谱的基体效应及定量分析研究[J]. 光谱学与光谱分析, 2020, 40(4): 1207-1213.
[11] Rauschenbach I, Lazic V, Pavlov S G, et al. Laser induced breakdown spectroscopy on soils and rocks: influence of the sample temperature, moisture and roughness[J]. Spectrochimica Acta Part B: Atomic Spectroscopy, 2008, 63(10): 1205-1215.
[12] 朱志峰, 李博, 高强, 等. 多次放电的激光诱导击穿光谱信号增强[J]. 光谱学与光谱分析, 2021, 41(8): 2633-2637.
[13] Hirayama Y, Obara M. Heat-affected zone and ablation rate of copper ablated with femtosecond laser[J]. Journal of Applied Physics, 2005, 97(6): 064903.
[14] Aghaei M, Mehrabian S, Tavassoli S H. Simulation of nanosecond pulsed laser ablation of copper samples: a focus on laser induced plasma radiation[J]. Journal of Applied Physics, 2008, 104(5): 053303.
[15] Freeman J R, Harilal S S, Diwakar P K, et al. Comparison of optical emission from nanosecond and femtosecond laser produced plasma in atmosphere and vacuum conditions[J]. Spectrochimica Acta Part B: Atomic Spectroscopy, 2013, 87: 43-50.
[16] Verhoff B, Harilal S S, Hassanein A. Angular emission of ions and mass deposition from femtosecond and nanosecond laser-produced plasmas[J]. Journal of Applied Physics, 2012, 111(12): 123304.
[17] 孙晨薇, 步扬, 王远航, 等. 激光诱导等离子体光谱空间分布特性[J]. 光学学报, 2021, 41(21): 2130001.
[18] Li X W, Yang Z F, Wu J, et al. Spatial confinement in laser-induced breakdown spectroscopy[J]. Journal of Physics D, 2017, 50(1): 015203.
[19] Hou Z Y, Wang Z, Liu J M, et al. Signal quality improvement using cylindrical confinement for laser induced breakdown spectroscopy[J]. Optics Express, 2013, 21(13): 15974-15979.
[20] Li X W, Wang Z, Mao X L, et al. Spatially and temporally resolved spectral emission of laser-induced plasmas confined by cylindrical cavities[J]. Journal of Analytical Atomic Spectrometry, 2014, 29(11): 2127-2135.
[22] Ho J R, Grigoropoulos C P, Humphrey J A C. Gas dynamics and radiation heat transfer in the vapor plume produced by pulsed laser irradiation of aluminum[J]. Journal of Applied Physics, 1996, 79(9): 7205-7215.
[23] KoschützkeO. Laser induced breakdown spectroscopy (LIBS)[M]. Cambridge University Press, 2006: 123-135.
[24] Li C, Wang J, Wang X. Shock wave confinement-induced plume temperature increase in laser-induced breakdown spectroscopy[J]. Physics Letters A, 2014, 378(45): 3319-3325.
[25] Shabanov S V, Gornushkin I B, Winefordner J B. Radiation from asymmetric laser-induced plasmas collected by a lens or optical fiber[J]. Applied Optics, 2008, 47(11): 1745-1756.
[26] Shabanov S V, Gornushkin I B. Two-dimensional axisymmetric models of laser induced plasmas relevant to laser induced breakdown spectroscopy[J]. Spectrochimica Acta Part B: Atomic Spectroscopy, 2014, 100: 147-172.
蔡亚超, 步扬, 王远航, 吴芳, 阎晓娜. 空间约束对激光诱导等离子体演化和光谱的影响[J]. 光学学报, 2023, 43(7): 0730001. Yachao Cai, Yang Bu, Yuanhang Wang, Fang Wu, Xiaona Yan. Effect of Spatial Confinement on Plasma Evolution and Spectrum in Laser-Induced Breakdown Spectroscopy[J]. Acta Optica Sinica, 2023, 43(7): 0730001.
