非线性系统中双频光栅相位测量
1 Introduction
Phase measurement is very important in optics shape measurement. For its non-contact operation, high precision, high speed and other measurement advantages, it is widely used in production, national defense, scientific research and other fields[1-6]. Numerous scholars have studied phase measurement and obtained good results[1-3]. For example, in 2020, to better measure isolated targets with complex surfaces, Cai et al. improved the measurement method of the absolute phase by using half-cycle correction and proposed a new gray coding method[1]. In 2021, in order to optimize phase measurement, Peng et al. proposed a sine fringe generation technique for three-dimensional shape measurement[2]. In 2022, to improve the reliability of tri-frequency time phase unwrapping, Hou et al. proposed a method using spatiotemporal tri-frequency time phase unwrapping[3].
Due to the nonlinear effect of the measurement system, phase measurement will be adversely affected. To reduce or even eliminate the nonlinear effect influence and improve measurement accuracy, some scholars have studied it and made some good achievements[7-11]. In 2013, to correct the system’s gamma nonlinearity, Xiao et al. presented a single orthogonal sinusoidal grating used in phase measurement, where the fringe gained by projecting the grating has good sinusoidal properties and can decrease the phase sinusoidal error[7]. In 2015, to decrease the phase measurement error induced by the system’s gamma nonlinearity, Xu et al. corrected the fringe using the system response function[8]. In 2021, for the three-step phase-shifting profilometry based nonlinear effect, Yang et al. proposed a method to reduce phase error with a three-to-three deep learning framework[9].
In this paper, the causes of the nonlinear effect influencing fringe intensity in the measurement system and its influence are analyzed in detail. After the nonlinear effect is reduced, the advantages of the dual-frequency grating method are used to gain better phase information of the measured object fringe image, and analyze its principle. To verify the principle analysis, a computer simulation and a practical experiment are executed, whose results show that the principle is correct.
2 Principle analysis
2.1 Nonlinear effect of system in phase measurement
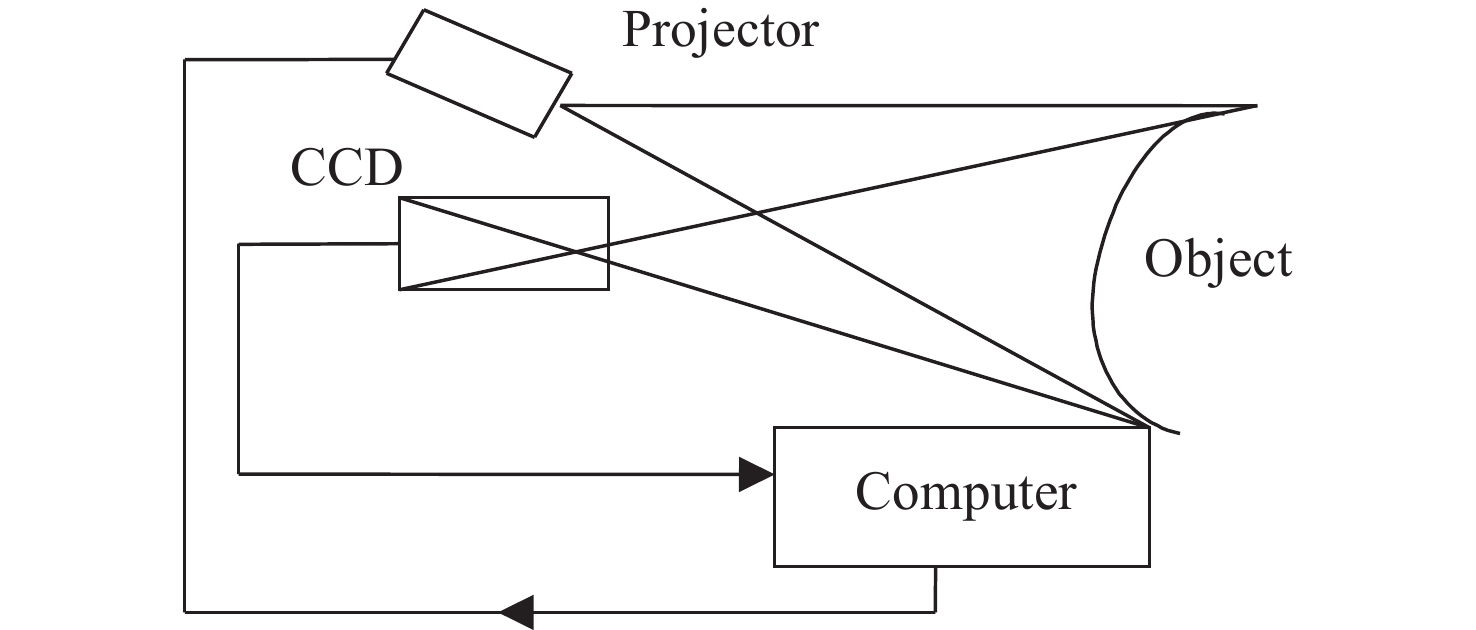
Phase measurement is very common in optics shape measurement. A diagram of the system’s structure and its corresponding parameters are described in Fig. 1 of the literature [12].
In ideal conditions, the light intensity of deformed fringe outputed from the projector system and that inputed to CCD[13] is linear. The light intensity image of the sinusoidal fringe from the projector system output is gained by CCD, as shown in the following expression:
where
Fourier transform is executed to the light intensity of the fringe along the
where
By filtering the fundamental frequency component of Eq. (2) and performing an inverse Fourier transform,
However, owing to the effects of light illumination, external noise and so on, in real situations, the light intensities of the deformed fringes of the projector systems and that of the CCD input is nonlinear, so the light intensity of the deformed fringe passing through the nonlinear projection system is:
where
A Fourier transform is executed with Eq. (4). Similarly, after eliminating the zero-order spectrum components in the frequency domain by using the
It can be seen that when there is a nonlinear relationship in the system, there are higher-order spectra components in the frequency domain of the deformed fringe after the Fourier transform. Mixing the fundamental frequency with higher-order spectra components easily leads to spectra overlapping, which affects the phase measurement accuracy.
The phase information is contained in the fundamental frequency part
2.2 Phase measurement with dual-frequency grating
After the system nonlinear effect is nearly eliminated, the n-th sinusoidal fringe light intensity image outputted by the measurement system is gained through a CCD as follows:
where
Using the n-step phase-shift method, the phase gained can be described as
where
As
where
The phase is easy to unwrap by using the low-frequency grating, but this has low phase accuracy. One will gain high phase accuracy by using a high-frequency grating, but the phase is then difficult to unwrap. A dual-frequency grating can make full use of both advantages, so a high-precision recovery phase can be achieved[16].
When a dual-frequency grating is used to measure phase, Eq. (9) can be further changed into the following expression:
where “
By further changing Eq. (10), it can evolve to Eq. (11) as follows:
where
So
3 Computer simulation and experiment
3.1 Computer simulation
Supposing that the geometric parameters relationship of the phase measurement system is
There is a nonlinear effect in the system, assuming that
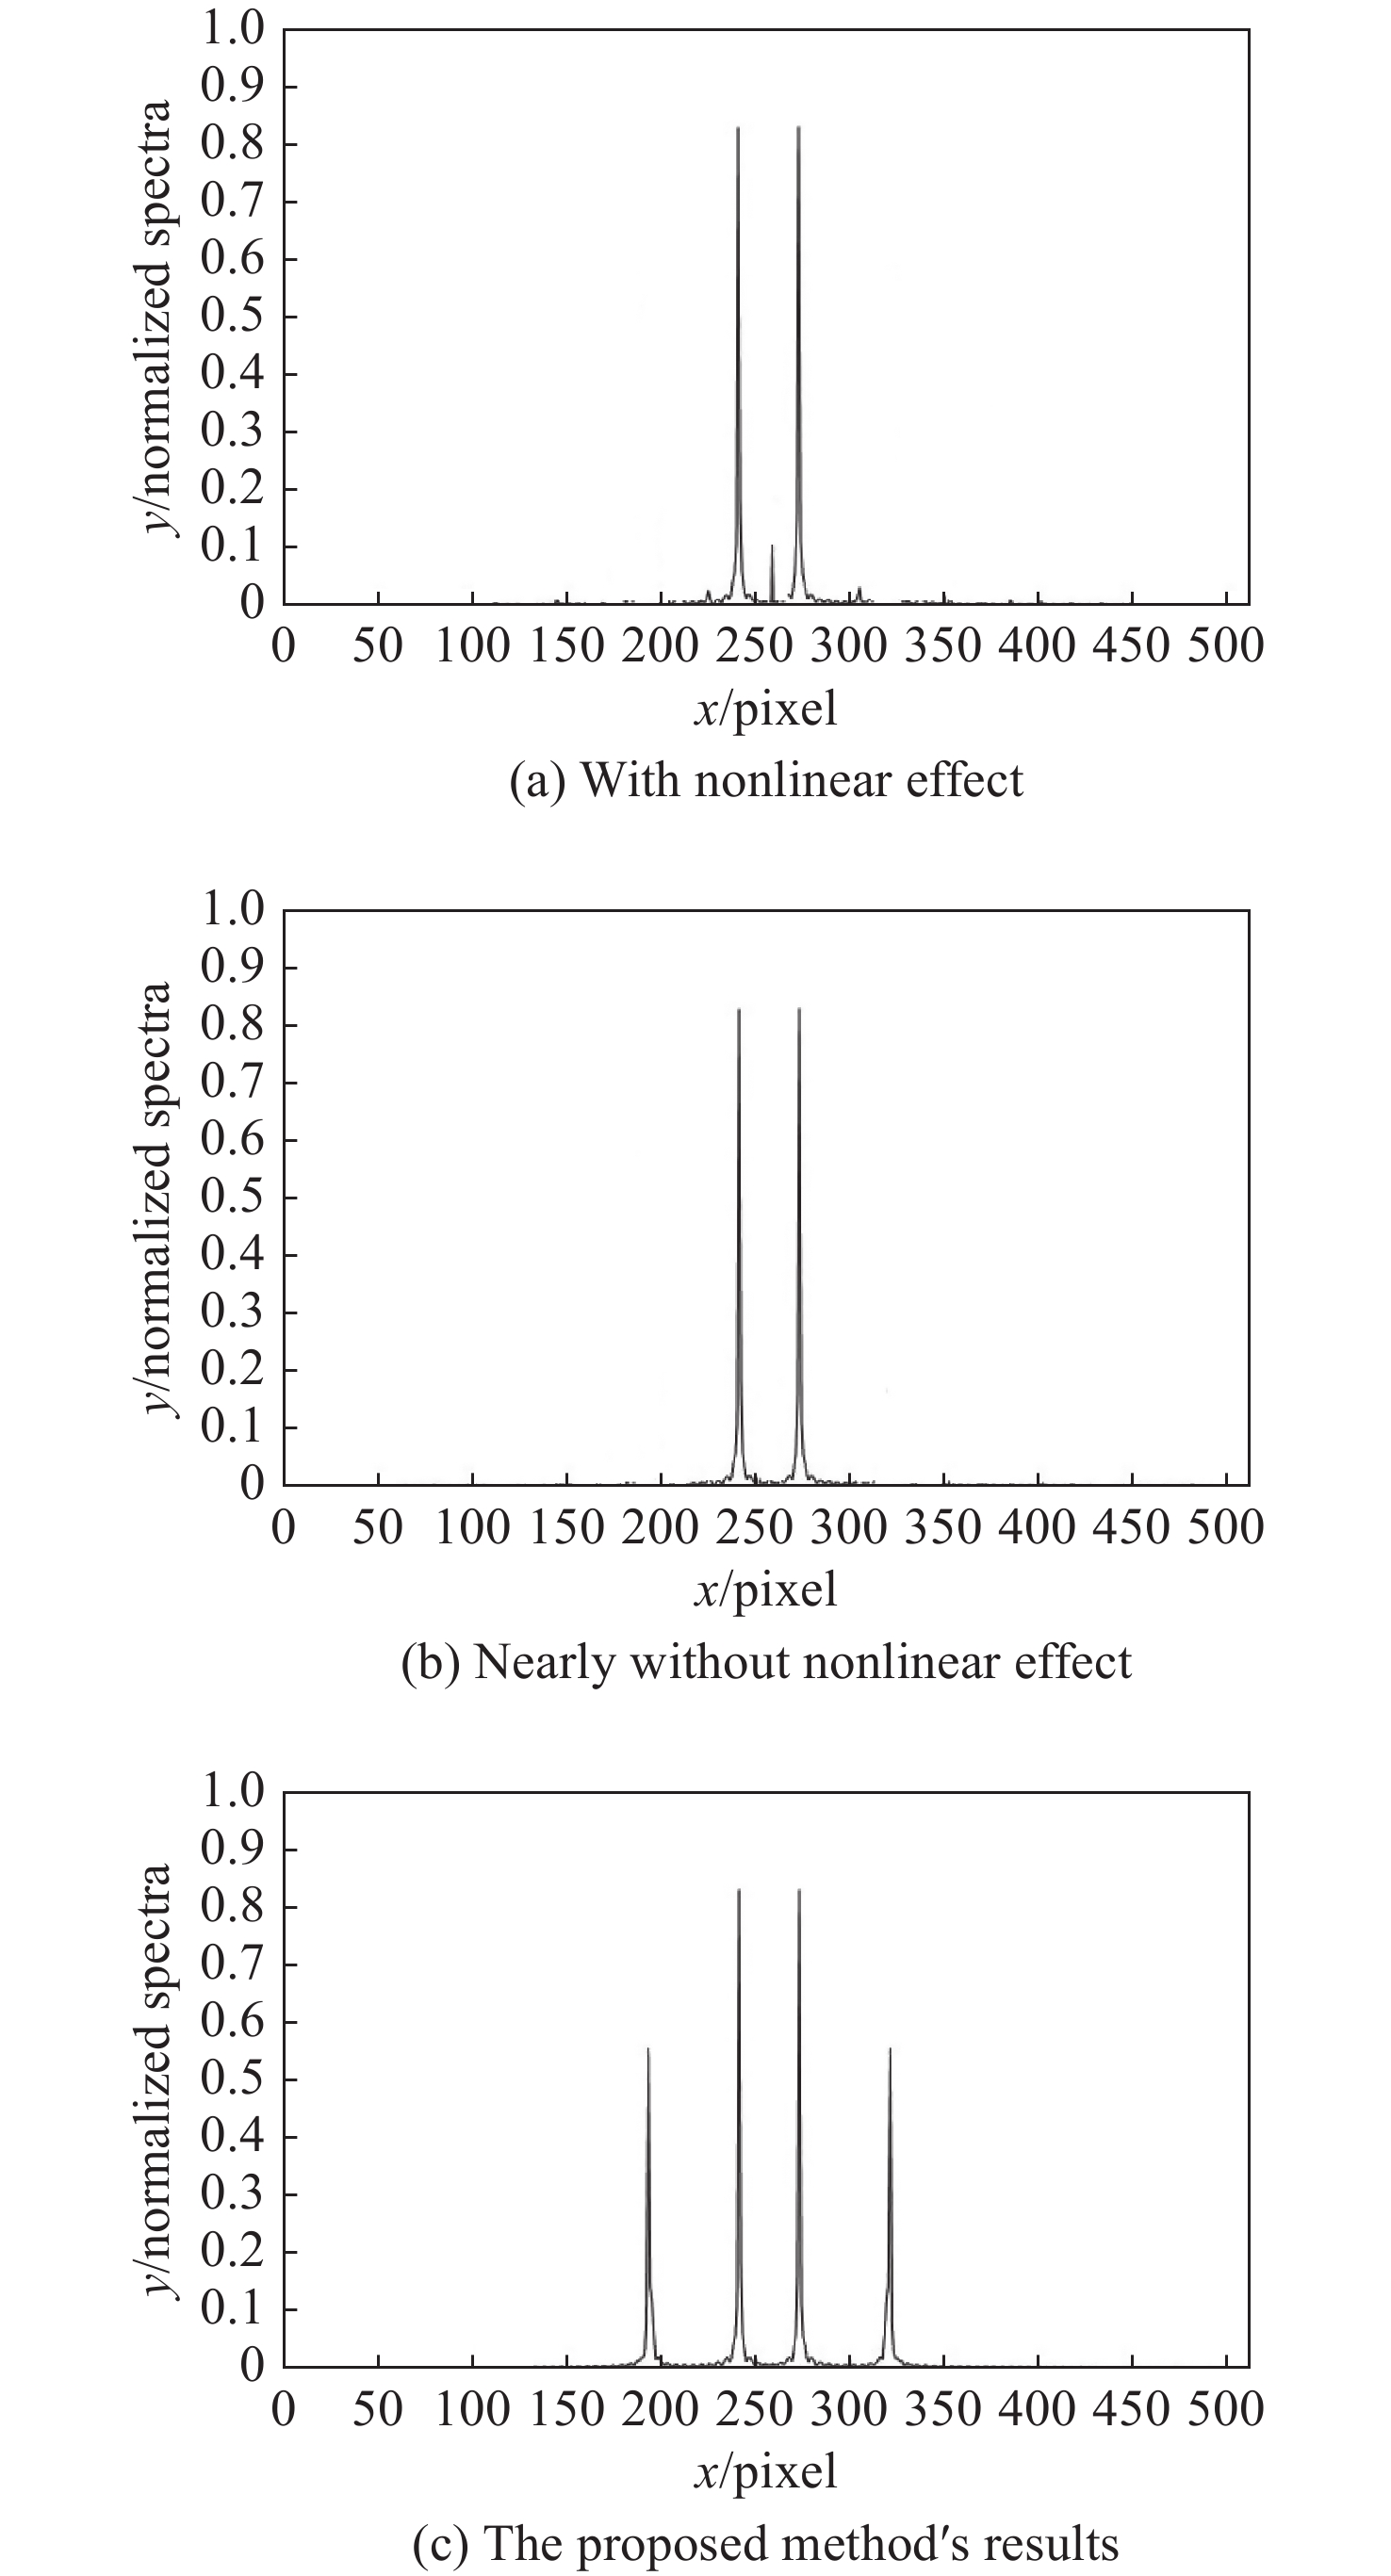
After applying the inverse Fourier transform to these spectra distributions as shown in Fig.2, the gained measurement errors between the recovery phase and the original phase by using the three methods as shown in Figs. 3 (a)−(c) (color online), respectively.
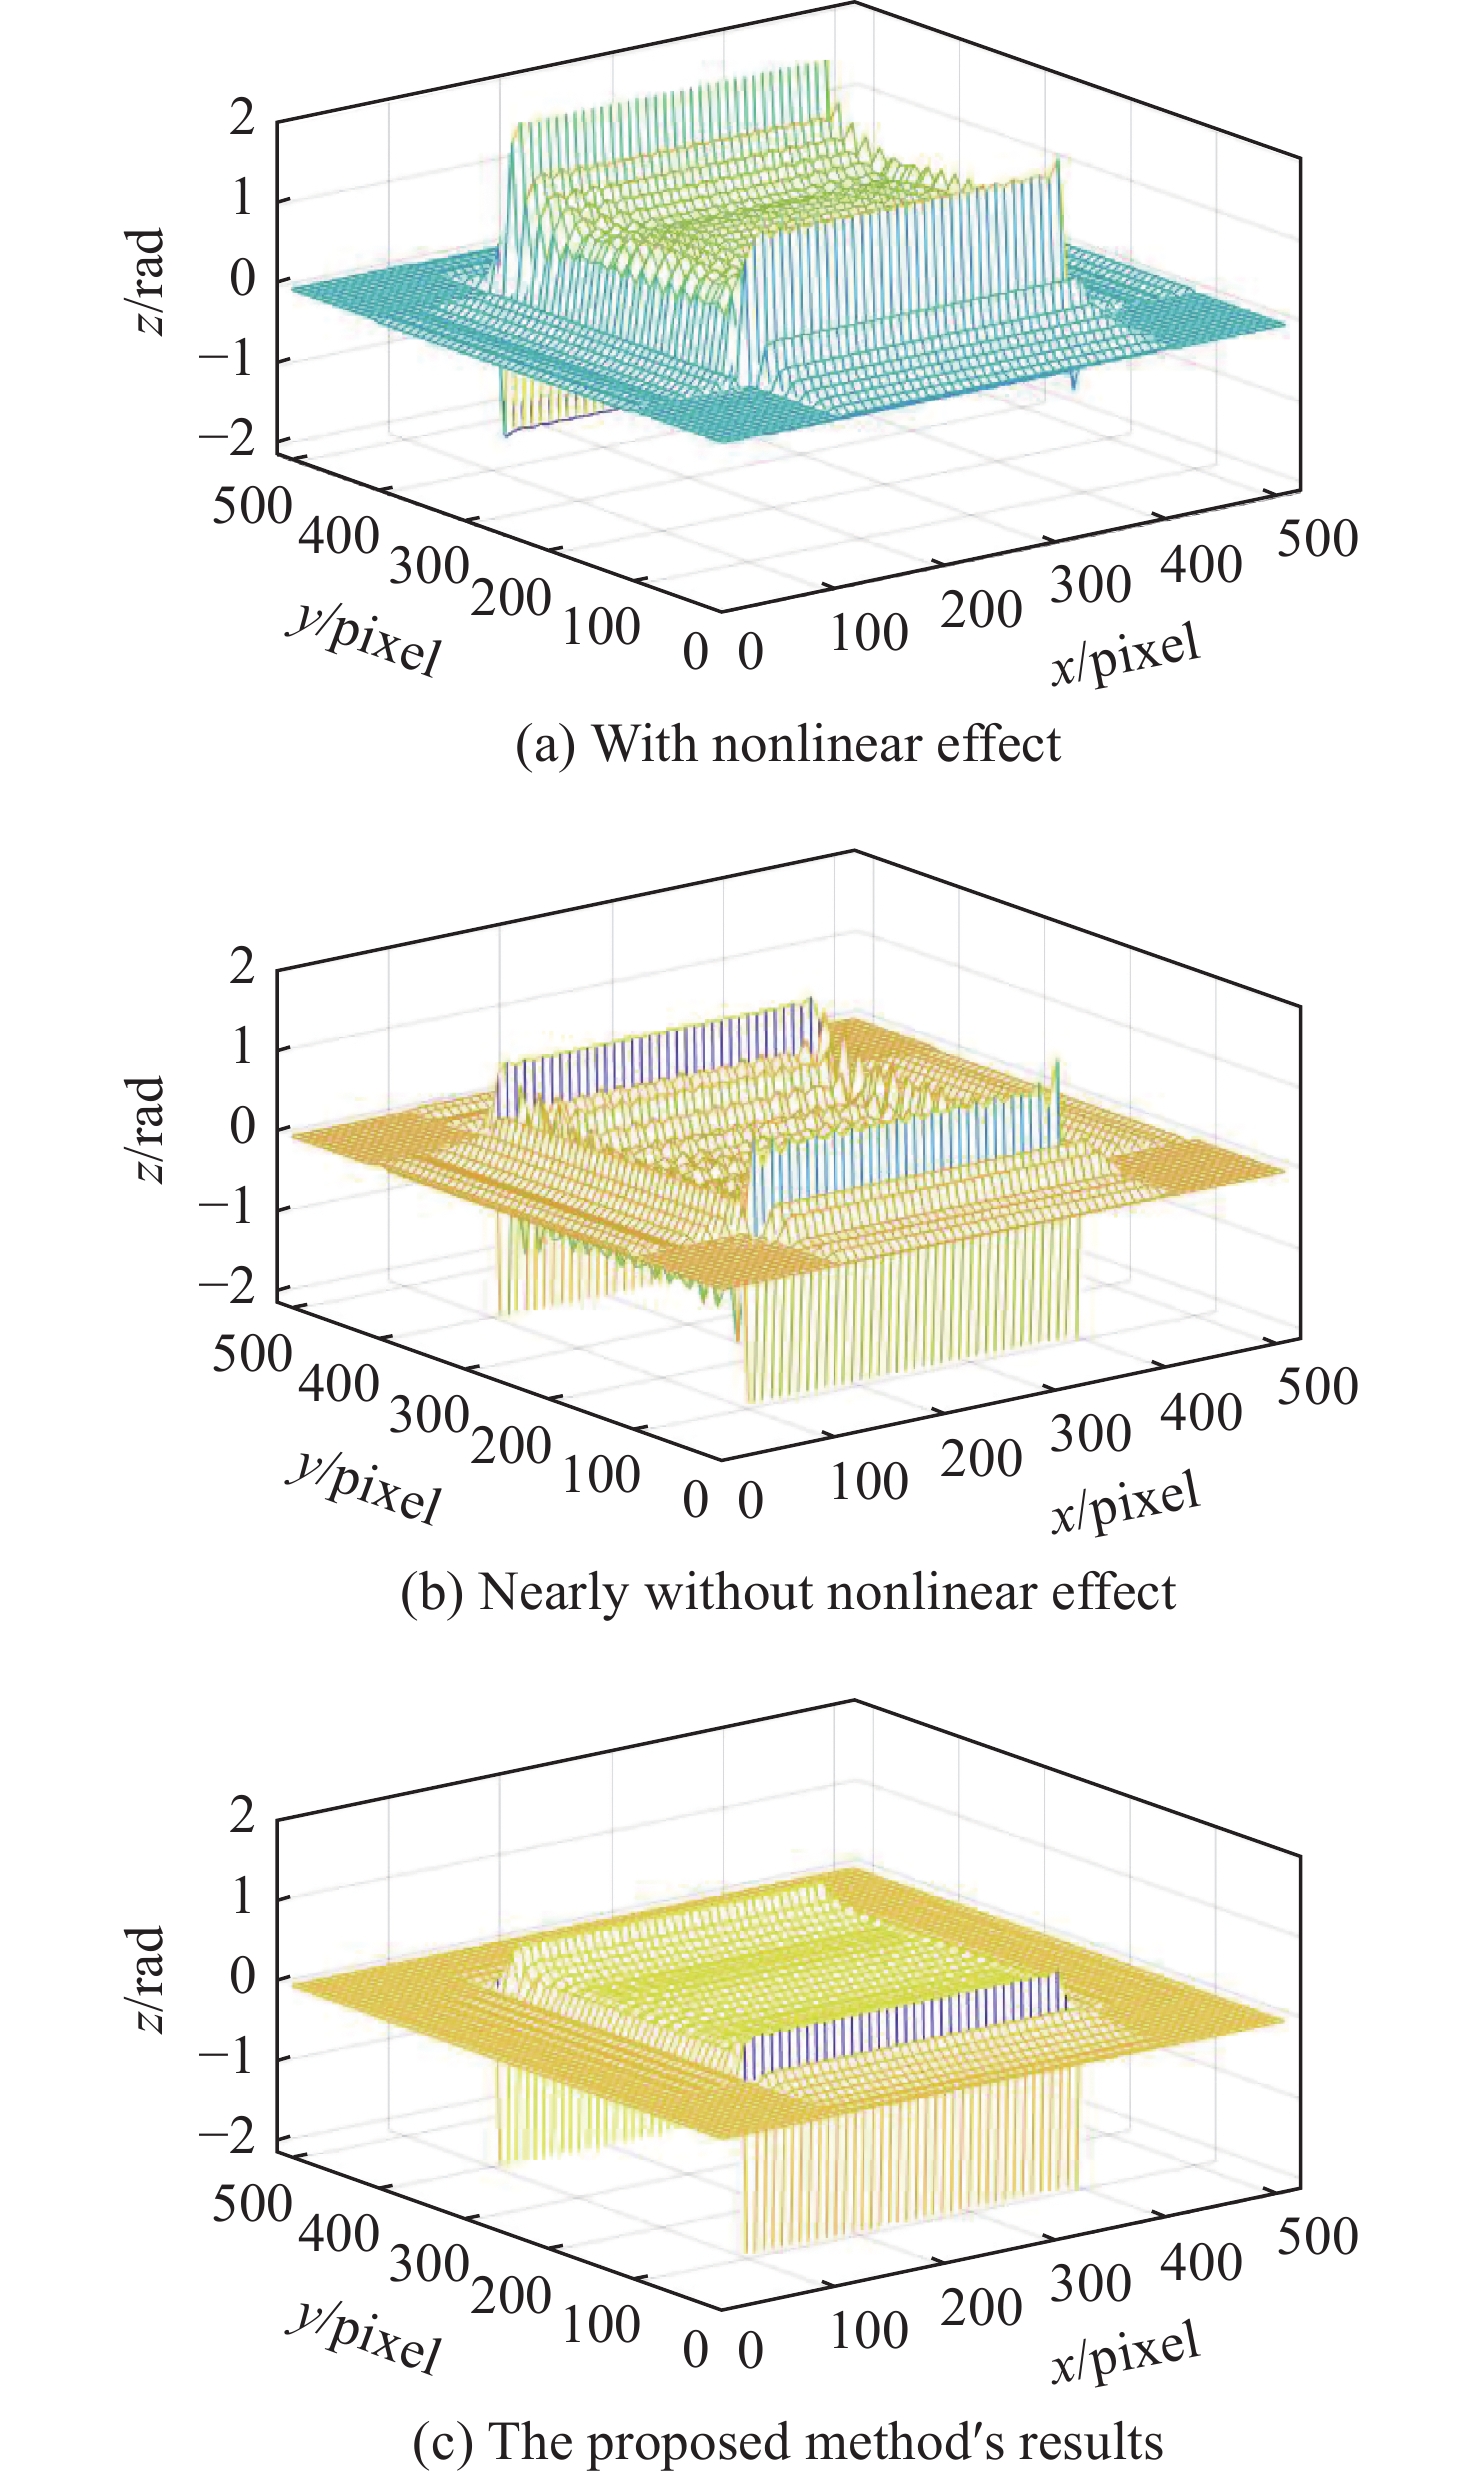
图 3.
Fig. 3. Phase measurement error diagrams gained by three different simulation methods
The average phase error value of Fig. 3 (a), 3(b) and 3(c) is 0.8452 rad, 0.4438 rad and 0.2364 rad, respectively. The error value of this method is 27.97% and 52.51% that of the method with a nonlinear effect and nearly completely without nonlinear influence, respectively.
The phase in the nonlinear measurement system can be recovered effectively by using the proposed method and its phase recovery error is the smallest among the three methods.
3.2 Actual experiment
To further prove the correctness and feasibility of the principle analysis, the actual experiment was executed by using the experimental system shown in Fig. 4. Through a program generated by MATLAB software,
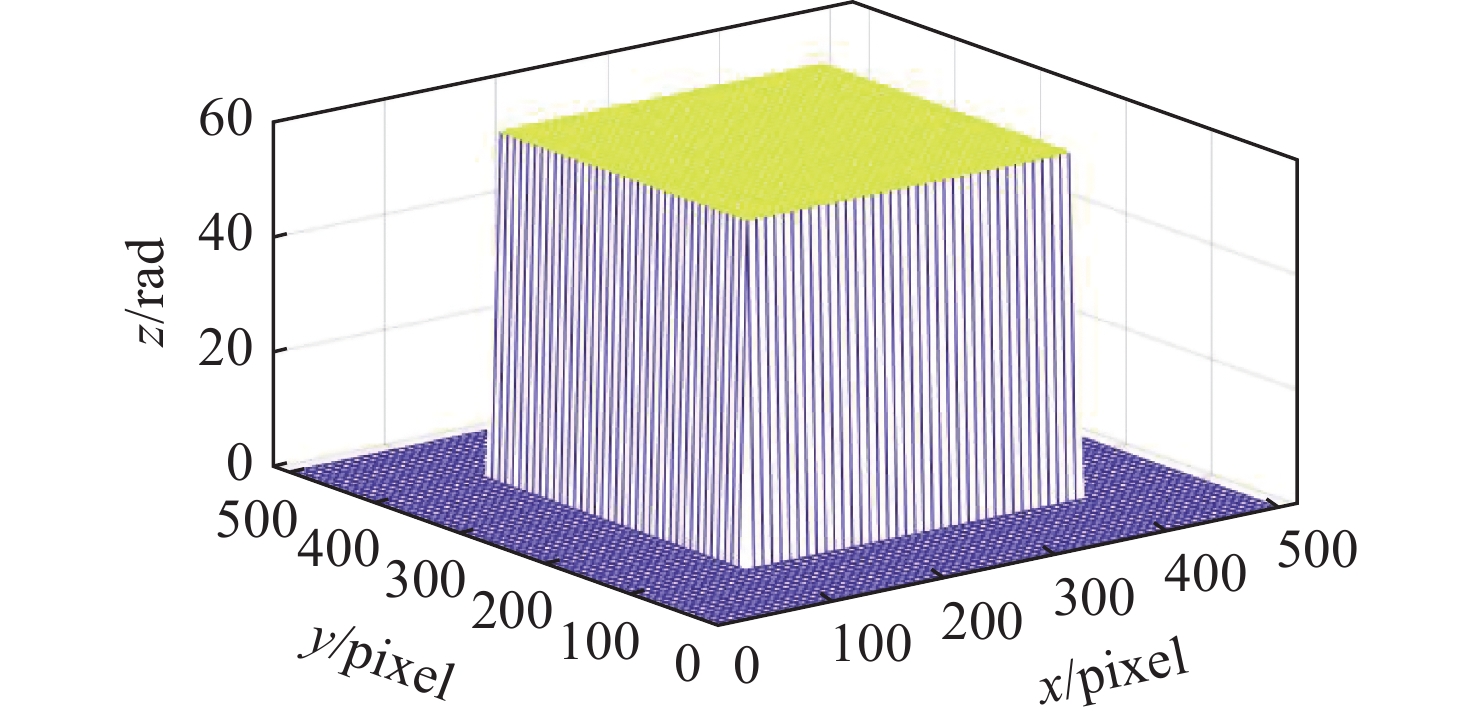
The experimental model used is a steep stepped object, as shown in Fig. 5 (color online).
In the experiment, the same three methods of computer simulation are used to measure the phase. The recovery results gained can be shown in Fig. 6 (a), 6(b) and 6(c) (color online), respectively. Fig. 6 (d) is the cross-section comparison results of 100th column of Fig. 6 (a) ~ (c), respectively.
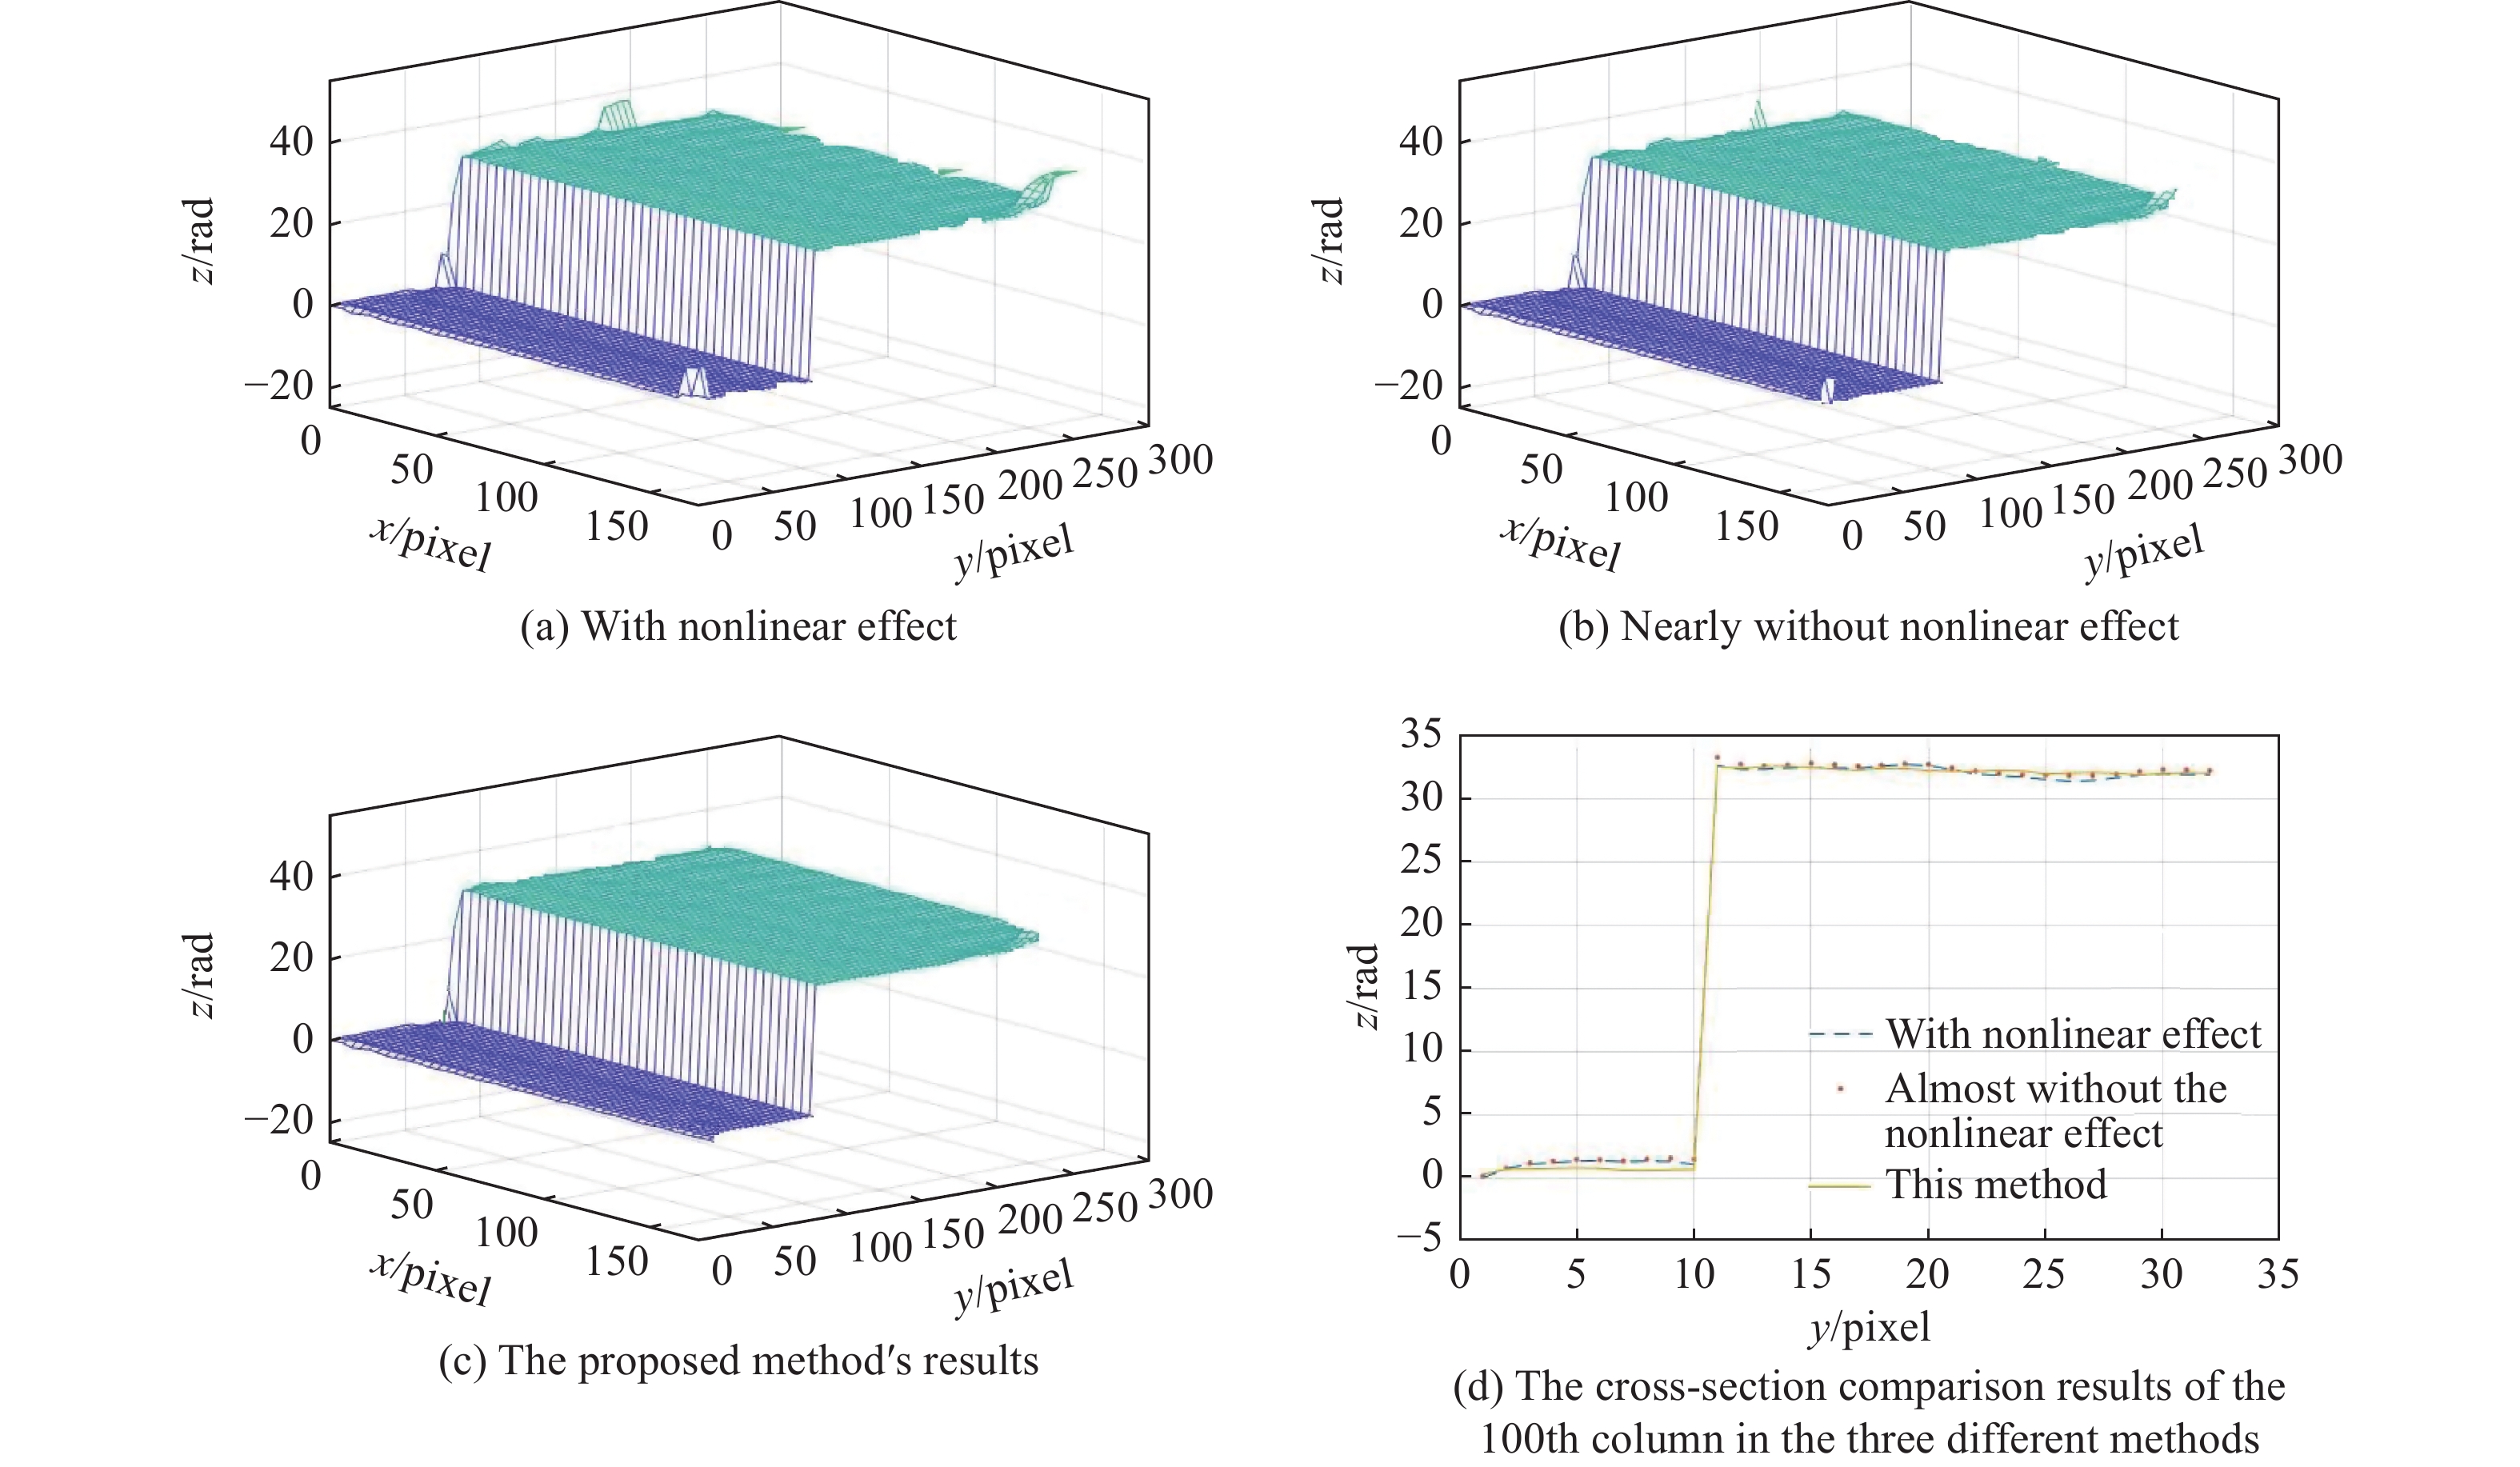
图 6.
Fig. 6. Phase measurement results gained by using the three different experiment methods
It indicate that the phase measurement result using the method proposed in this paper is best, and the gained phase surface contour is complete and smooth.
4 Conclusion
Due to the influence of the nonlinear effect on phase measurement, the influence of the nonlinear effect on fringe intensity in the measurement system is analyzed. The dual-frequency grating method is used to improve the phase measurement accuracy, and the principle is analyzed.
To verify the effectiveness of the proposed principle analysis, the computer simulation and practical experiment are implemented, and the results gained are consistent with the principle analysis. The error values of this method by simulation are 27.97% and 52.51% of the methods with and nearly without nonlinear influence, respectively, showing that the effect of phase recovery is the best among those in the experiment. This demonstrates that the phase measurement method proposed in this paper is effective and feasible.
Article Outline
乔闹生, 尚雪. 非线性系统中双频光栅相位测量[J]. 中国光学, 2023, 16(3): 726. Nao-sheng QIAO, Xue SHANG. Phase measurement with dual-frequency grating in a nonlinear system[J]. Chinese Optics, 2023, 16(3): 726.


 PDF全文
PDF全文
