TC4钛合金激光深熔焊等离子体羽流热力学行为研究  下载: 737次
In the laser deep-penetration welding process, a high-energy-density laser produces intense melting and evaporation on the metal surface, generating a keyhole inside the molten pool. The keyhole gives rise to a plasma plume, composed of metallic vapor and plasma, induced by the evaporation and ionization of the molten metal. Previous studies generally believed that the plasma plume eruption process is periodic; however, elements of randomness are also present, specifically reflected in the random plasma eruption period and the difference in plasma plume eruption intensity. However, systematic research on the thermodynamic behavior of plasma plumes is still lacking. Therefore, it is of great significance to further study mass and energy transfer in laser welding by measuring the basic thermodynamic data of the plasma plume and analyzing its distribution.
In this study, a TC4 titanium alloy was used to study the thermodynamic behavior of a plasma plume in laser deep-penetration welding. A titanium alloy plate with a thickness of 3 mm was welded using an Nd∶YAG laser. During the welding process, a plasma photoelectric signal synchronous detection system with a passive dual-probe device was used to obtain the photoelectric information of the plasma plumes under different welding heat inputs. The thermodynamic parameters, including the eruption velocity and temperature of the plasma plume, were measured to study the thermodynamic behavioral characteristics of the plasma plume.
The plasma plume expanded and contracted frequently during laser welding. In this study, the plasma eruption velocity and spatiotemporal distribution characteristics of the plasma plume temperature were studied by analyzing the characteristics of electrical signals in the plasma eruption process. Under the welding heat inputs of 75 J/mm, 50 J/mm, and 37.5 J/mm, the maximum probability plasma erupting velocity was 13 m/s, 14 m/s, and 15.5 m/s, respectively (Fig. 6). In the eruption process, the decrease degree of the plasma plume temperature (k) was primarily distributed in the range of above 0.5 (Fig. 9). The time interval for the two probes to sense the same plasma temperature exceeded twice the time it took for the plasma plume to make contact with both probes. Moreover, the maximum probability value of k decreased with an increase in welding heat input. In the late eruption period, the sequence of the two electrical signals that began to rise was closely related to the plasma eruption intensity (Fig. 10).
In this study, laser welding experiments on titanium alloys were conducted using a plasma photoelectric signal synchronous detection system, and the thermodynamic behavior of the plasma plume during laser welding was analyzed. Under the experimental parameter of 1500 W laser power and a welding heat input range of 37.5?75 J/mm, the main findings of this study are as follows.
1) The plasma eruption velocity was mainly distributed in the range of 6?70 m/s. With an increase in the welding heat input, the maximum probability of the plasma eruption velocity tended to decrease, and there was no evident change in the distribution range.
2) The temperature of the plasma plume decreased with an increase in the plasma plume size, and the decrease in the plasma plume temperature tended to decrease with an increase in the welding heat input.
3) In the later stages of the plasma eruption process, when the electrical signal of the lower probe began to rise earlier than that of the upper probe, the plasma plume eruption was stronger; otherwise, the plasma eruption was weaker.
1 引言
在激光深熔焊过程中,高能量密度的激光作用在金属上使其产生剧烈的熔化和蒸发,在熔池内形成小孔。熔融金属蒸发、电离过程中产生的金属蒸气、离子和自由电子从小孔中喷出形成等离子体羽流。以往的研究一般认为等离子体羽流的喷发过程具有周期性特征[1-3],但其同样具有明显的随机性特征,具体表现在等离子体喷发周期的不固定以及等离子体羽流喷发强度的差异等。所查资料显示,目前还缺乏对等离子体羽流热力学行为的系统性研究。因此,通过测量诸如等离子体羽流的喷发速度和温度等热力学基础数据,分析其分布规律,对于进一步研究激光焊接过程中的质量传输和能量传输具有重要意义。
等离子体羽流的动态行为与焊接过程的稳定性息息相关[4-10]。Xiao等[5]利用光谱检测技术研究了不同激光功率下的等离子体羽流温度、电子密度等参数的变化,认为等离子体羽流是激光功率衰减的主要原因。Tenner等[4]利用三维高速摄像监测系统对激光焊接过程中的等离子体羽流成像,探索了等离子体羽流与熔池小孔之间的相关性,进而评估了熔池小孔的稳定性。此外,等离子体羽流的动态行为同样影响着焊接质量。Zhang等[6]利用高速摄像技术获取了小孔口、等离子体羽流的面积,同时通过频谱分析的方法提取面积变化的频域特征,预测了焊缝的熔透模式。Arita等[7]通过X射线透射成像研究了激光焊接过程中飞溅的产生机理,他们认为焊接过程中产生的等离子体羽流干扰了工件的激光热输入,引起熔池及小孔波动,从而导致飞溅产生。
由于激光焊接过程中等离子体喷发行为的随机性,此前的研究多采用高速摄像技术检测等离子体羽流的动态行为。如:Huang等[9]利用拍摄频率为40000 frame/s的高速摄像机获取了等离子体羽流的动态变化,同时开发了提取图像特征的图像处理算法,得到了等离子体羽流的喷发速度。但是,高速摄像技术的大样本图像数据处理复杂度较高,而且能够反映的等离子体羽流的热力学信息比较单一,这使得该技术的应用具有一定的局限性。
前期的研究表明,基于无源电探针检测技术的单探针检测装置,适用于分析等离子体羽流时域上的温度变化,反映其形态变化的趋势[11-14]。笔者建立了一套由无源双探针检测装置和高速摄像设备构成的激光焊接等离子体光电信息同步检测系统,该系统能够以较高的信号采集频率检测等离子体羽流在时空上的形态变化和温度变化。相较于碳钢和不锈钢等材料,钛合金在激光焊接过程中产生的等离子体羽流较大,便于双探针检测装置的布置,因而笔者选择应用广泛的TC4钛合金作为试验材料,研究激光焊接等离子体羽流的热力学行为。
2 试验材料及试验装置
试验用TC4钛合金板材的厚度约为3 mm。如
无源电探针装置如

图 2. 无源电探针装置示意图。(a)侧视图;(b)俯视图
Fig. 2. Schematic diagrams of passive electric probe device. (a) Side view; (b) top view
3 检测原理
根据等离子体鞘层理论,当导体被置于等离子体内时,导体表面会积聚大量负电荷,导体与等离子体之间产生一个电势单调递增的电场,导体呈负电势。Zhao等[13]认为孔内等离子体与小孔壁之间同样存在等离子体鞘层效应。综合考虑上述两种等离子体鞘层效应后,将无源电探针测得的压降表示为
式中:k为玻尔兹曼常数;e为电子电荷;Te为等离子体电子温度;me和mi分别为电子质量和离子质量;TB为小孔壁或熔池内熔体层的表面温度。无源电探针检测到的压降变化会由数据采集程序绘制成等离子体电信号波形。根据Boyer等[15]的研究,TB约为3533 K,等离子体羽流的温度Te可通过变换
4 试验结果及分析讨论
在连续激光焊接模式下,利用等离子体光电同步检测系统,分析不同焊接热输入下的等离子体电信号波动及等离子体羽流的形态变化。设计激光焊接试验,设定激光功率为1500 W,当焊接速度分别为20、30、40 mm/s时,对应的焊接热输入分别为75、50、37.5 J/mm。
等离子体电信号的时域图如

图 3. 不同热输入下等离子体的电信号波形。(a)75 J/mm;(b)50 J/mm;(c)37.5 J/mm
Fig. 3. Electrical signal waveform of the plasma under different heat inputs. (a) 75 J/mm; (b) 50 J/mm; (c) 37.5 J/mm
4.1 等离子体喷发速度分析
激光焊接过程中同步采集到的等离子体光电信息如

图 4. 等离子体光电同步信号。(a)等离子体电信号波形;(b)(c)一个等离子体喷发周期的电信号波形及其导数波形图
Fig. 4. Photoelectric synchronization signal of the plasma. (a) Electrical signal waveform of the plasma; (b)(c) electrical signal waveform of an plasma erupting period and its derivative waveform
从不同热输入下采集到的等离子体电信号波形中,各选取2 s稳定焊接过程对应的电信号波形,对每个参数下约400个等离子体喷发过程样本进行计算,并绘制如

图 5. 不同热输入下等离子体喷发速度时域变化
Fig. 5. Variation of plasma erupting velocity with time under different heat input
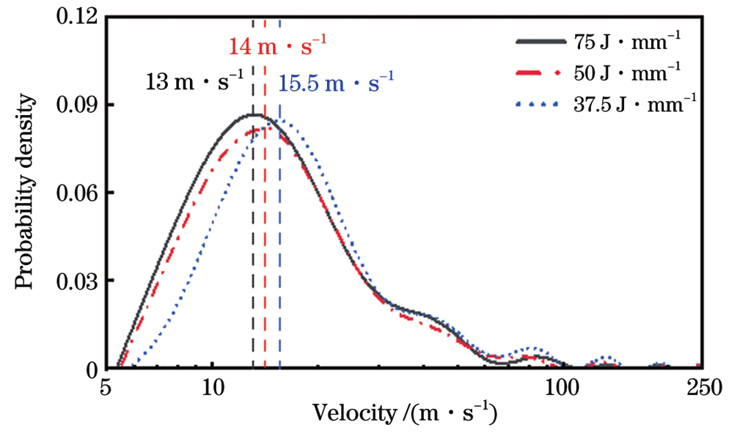
图 6. 不同热输入下等离子体喷发速度的概率密度分布
Fig. 6. Probability density distribution of the plasma erupting velocity at different heat inputs
在激光焊接过程中,小孔壁表面主要受阻止小孔扩张的熔池表面张力(Pλ)以及促进小孔扩张的金属蒸气反冲压力(Pabl)的作用[17]。小孔壁面所受的总压力ΔP可以表示为
。(a)Pabl和Pλ随小孔半径变化的曲线;(b)ΔP随小孔半径变化的曲线](/richHtml/zgjg/2023/50/20/2002105/img_07.jpg)
图 7. 小孔形成原理图[17](a:熔池小孔半径;r0:激光光斑半径;P0大气压力)。(a)Pabl和Pλ随小孔半径变化的曲线;(b)
Fig. 7. Principle diagrams of the keyhole formation[17](a: molten-pool keyhole diameter; r0: laser spot radium; P0: atmospheric pressure). (a) Variation of Pabl and Pλ with the keyhole radius; (b)variation of ΔP with the keyhole radius
随着焊接热输入增加,
4.2 等离子体喷发过程中温度下降程度分析
如
在一个等离子体羽流喷发过程的中期(t3~t4),等离子体电信号近似线性下降的波段为特征区段。
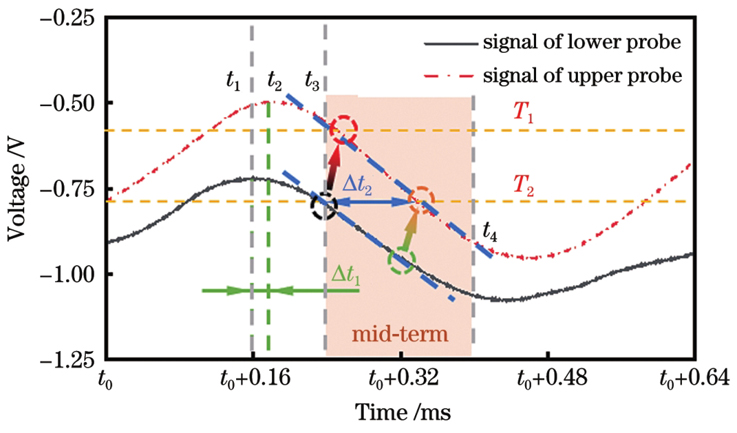
图 8. 电信号波形特征区段的时间差检测示意图
Fig. 8. Time difference detection schematic diagram of characteristic bands of electrical signal waves
对比
假设等离子体羽流处于与外界没有热交换的理想状态,等离子体羽流经过两探针时的温度不变。此时,Δt1=Δt2,k=0,即等离子体羽流先后接触两探针的时间间隔等于两探针感应到相同等离子体温度所需的时间。
但在实际情况下,等离子体羽流会与外界发生热量交换、能量交换,等离子体羽流经过上探针时,其温度T1低于经过下探针时的温度T2。上探针需要经历更长的时间感应到温度T2。因此,一般情况下,0<k<1。k值越大,等离子体羽流在喷发过程中温度下降的程度越大。不同热输入下k值的统计结果如
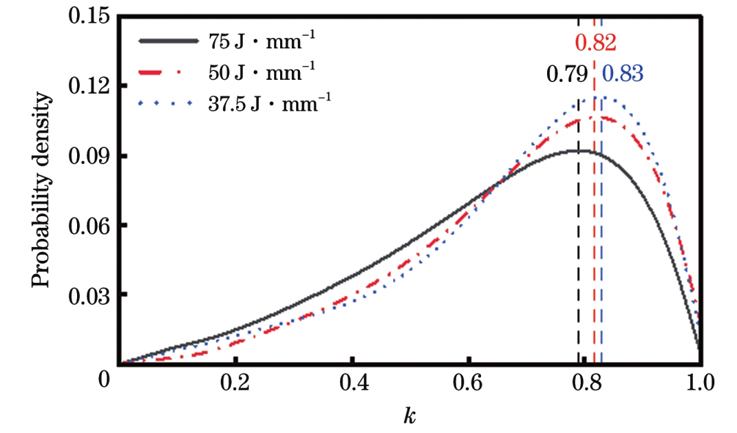
图 9. 不同热输入下k值的概率密度分布图
Fig. 9. Probability density distribution of k at different heat inputs
由
4.3 等离子体喷发后期分析
根据两探针测得的等离子体电信号开始回升的先后顺序,等离子体羽流在喷发后期的热力学行为可分为两种情况:下探针电信号超前回升或滞后回升。

图 10. 电信号波形开始回升的先后顺序示意图。(a)下探针超前;(b)下探针滞后
Fig. 10. Schematic diagrams of sequence of the signal start to increase. (a) Lower probe ahead; (b) lower probe behind
如
如
不同热输入下探针电信号开始回升的超前时长统计结果如

图 11. 不同热输入下探针电信号超前时长概率密度分布图
Fig. 11. Probability density distribution of the lower probe ahead time at different heat input
5 结论
借助等离子体光电信息同步检测系统开展了钛合金的激光焊接试验,研究了激光焊接过程中等离子体羽流的热力学行为。在激光功率为1500 W、焊接热输入变化范围为37.5~75 J/mm的试验条件下,得出了以下结论:
1)等离子体喷发速度主要分布在6~70 m/s范围内;随着焊接热输入增加,最大概率的等离子体喷发速度减小,喷发速度的分布范围无明显变化。
2)等离子体羽流在上升过程中温度不断下降,等离子体羽流温度的下降程度随着焊接热输入的增加呈减小的趋势。
3)在喷发后期,当下探针电信号开始回升的时刻超前于上探针时,等离子体羽流喷发较强烈,反之则喷发较弱。
[1] Wang J, Wang C M, Meng X X, et al. Study on the periodic oscillation of plasma/vapour induced during high power fibre laser penetration welding[J]. Optics & Laser Technology, 2012, 44(1): 67-70.
[2] Beyer E, Bakowsky L, Loosen P, et al. Development and optical absorption properties of a laser induced plasma during CO2 laser processing[J]. Proceedings of SPIE, 1984, 0455: 75-80.
[3] Kawahito Y, Matsumoto N, Mizutani M, et al. Characterisation of plasma induced during high power fibre laser welding of stainless steel[J]. Science and Technology of Welding and Joining, 2008, 13(8): 744-748.
[4] Tenner F, Brock C, Klämpfl F, et al. Analysis of the correlation between plasma plume and keyhole behavior in laser metal welding for the modeling of the keyhole geometry[J]. Optics and Lasers in Engineering, 2015, 64: 32-41.
[5] Xiao X F, Song L J, Xiao W J, et al. Space-dependent characterization of laser-induced plasma plume during fiber laser welding[J]. Journal of Physics D: Applied Physics, 2016, 49(48): 485203.
[6] Zhang Y, Li F Z, Liang Z C, et al. Correlation analysis of penetration based on keyhole and plasma plume in laser welding[J]. Journal of Materials Processing Technology, 2018, 256: 1-12.
[7] Arita T, Sato Y, Kurita Y, et al. In situ observation of dynamics of keyhole and molten pool in laser welding for development of spatter suppression[J]. Journal of Laser Applications, 2022, 34(3): 032017.
[8] 李妍坤, 邹江林, 牛建强, 等. 不锈钢CO2激光焊接等离子体行为特性实验研究[J]. 应用激光, 2012, 32(3): 180-183.
[9] Huang Y, Shen C, Ji X R, et al. Correlation between gas-dynamic behaviour of a vapour plume and oscillation of keyhole size during laser welding of 5083 Al-alloy[J]. Journal of Materials Processing Technology, 2020, 283: 116721.
[10] Pang S Y, Chen X, Shao X Y, et al. Dynamics of vapor plume in transient keyhole during laser welding of stainless steel: local evaporation, plume swing and gas entrapment into porosity[J]. Optics and Lasers in Engineering, 2016, 82: 28-40.
[11] Zhao S B, Yang L J, Liu T, et al. Analysis of plasma oscillations by electrical detection in Nd∶YAG laser welding[J]. Journal of Materials Processing Technology, 2017, 249: 479-489.
[12] Bi C, Yang L J, Xu W H, et al. An electrical detection of the fluctuating plasma of laser welding with a passive probe[J]. Journal of Physics D: Applied Physics, 2012, 45(38): 385202.
[13] Zhao S B, Yang L J, Huang Y M, et al. A study on welding mode transition by electrical detection of laser-induced plasma at varying energy levels[J]. The International Journal of Advanced Manufacturing Technology, 2019, 104(1/2/3/4): 893-906.
[14] Huang Y M, Xu S, Yang L J, et al. Defect detection during laser welding using electrical signals and high-speed photography[J]. Journal of Materials Processing Technology, 2019, 271: 394-403.
[15] BoyerR R, GerhardW, CollingsE W. Materials properties handbook: titanium alloys[M]. Materials Park: ASM International, 1994.
[16] 应业勇. TC4钛合金激光焊接变形与光致等离子体的行为研究 [D]. 长沙: 湖南大学, 2016: 49-53.
YingY Y. Study on laser welding deformation and induced plasma behavior of TC4 titanium alloy [D]. Changsha: Hunan University, 2016: 49-53.
[17] Kroos J, Gratzke U, Simon G. Towards a self-consistent model of the keyhole in penetration laser beam welding[J]. Journal of Physics D: Applied Physics, 1993, 26(3): 474-480.
[18] Matsunawa A, Kim J D, Seto N, et al. Dynamics of keyhole and molten pool in laser welding[J]. Journal of Laser Applications, 1998, 10(6): 247-254.
[19] KroosJ. Stabilität und dynamik der dampfkapillare beim laserstrahlschweißen von metallen [D]. Braunschweig: Universität Bremen, 1993: 62-66.
Article Outline
贾晨鹏, 黄一鸣, 赵圣斌, 袁炯, 张枫, 杨立军. TC4钛合金激光深熔焊等离子体羽流热力学行为研究[J]. 中国激光, 2023, 50(20): 2002105. Chenpeng Jia, Yiming Huang, Shengbin Zhao, Jiong Yuan, Feng Zhang, Lijun Yang. Plasma Plume Thermodynamic Behavior During Laser Deep-Penetration Welding of TC4 Titanium Alloy[J]. Chinese Journal of Lasers, 2023, 50(20): 2002105.
