基于SiPLS‑BP模型的血红蛋白定量分析研究
Hemoglobin is a special protein responsible for transporting oxygen in red blood cells. Hemoglobin concentration is an important parameter in routine blood tests and an important index for the diagnosis of anemia and other blood diseases in clinical medicine. Changes in hemoglobin concentration can directly reflect changes in human health; therefore, it is important to detect the hemoglobin concentration in the human body accurately for the diagnosis of many blood diseases. Current clinical medical treatments mainly rely on chemical reagents to detect hemoglobin concentrations, resulting in high detection costs, long analysis time, complicated operations, and trauma to the human body. Infrared spectroscopy can detect hemoglobin concentrations without reagents efficiently and noninvasively. However, the blood composition is complex, and the spectral overlap is serious. This complex background information makes it difficult to construct a high-precision quantitative hemoglobin analysis model. The model developed in this study is based on a backpropagation (BP) neural-network model combined with synergy interval partial least squares (SiPLS). This model uses SiPLS to eliminate most of the interference information, accelerates the modeling speed, and can achieve high-precision quantification of hemoglobin concentration in a complex background. It is believed that the proposed model can be helpful in promoting noninvasive detection of hemoglobin.
In this study, the near-infrared spectral data of 186 blood samples with different concentrations of hemoglobin and 39 near-infrared spectral data of hemoglobin imitation solution samples with different concentrations under a complex background are used as the research objects. The best dataset division method, best division ratio, and best pretreatment method are selected. Four quantitative analysis models [SiPLS, SiPLS-BP, full-spectrum partial least squares (PLS), and full-spectrum BP] are constructed using SiPLS preferred bands, analyzed, and compared.
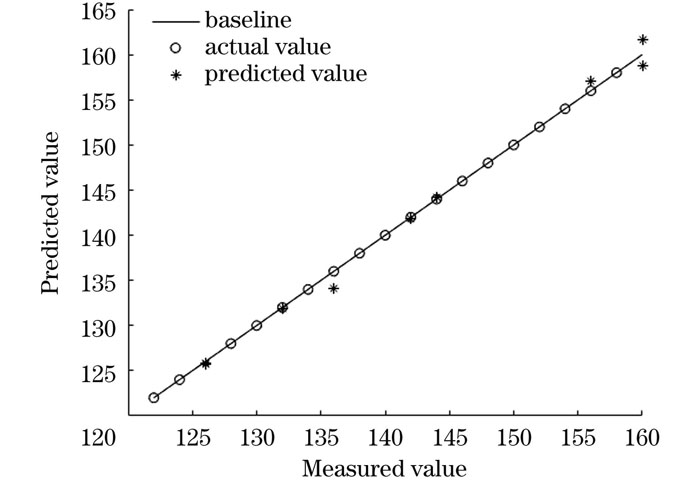
The best quantitative model for both samples is SiPLS-BP. The correlation coefficient of the prediction set based on the SiPLS-BP model for blood samples reaches 0.9907, and the root mean square error of the prediction set (RMSEP) is 1.807 (Table 2). The correlation coefficient of the prediction set based on the SiPLS-BP model for the imitation solution sample reaches 0.9975, and the RMSEP is 1.017 (Table 3). The characteristic bands selected by the SiPLS model for the blood samples are 1100?1298 nm, 1600?1798 nm, and 2100?2198 nm (Table 4), and the characteristic bands selected by the SiPLS-BP model are 1100?1310 nm, 1630?1840 nm, and 2054?2370 nm (Table 4). The SiPLS and SiPLS-BP models of the imitation solution samples adopt bands at 1141?1220 nm and 1301?1380 nm. Even when the same characteristic wavelength optimization method is used, the preferred bands of each model are not exactly the same. For the imitation solution and blood with a complex background and large sample difference, the SiPLS-BP model has a better prediction effect (Figs.5 and 6). The predicted value of the model is the closest to the actual value, the degree of dispersion is the smallest, and the quantitative effect is the best.
To quantify hemoglobin concentration accurately in complex backgrounds using infrared spectroscopy, a model using SiPLS-BP is proposed. To verify the effectiveness of the SiPLS-BP model, four models (full-spectrum PLS, SiPLS, full-spectrum BP, and SiPLS-BP) are constructed to predict 39 complex-background hemoglobin imitation solution samples and 186 blood samples. The results show that the SiPLS-BP model has the best quantitative effect on hemoglobin in a complex background. The correlation coefficient of the prediction set under the SiPLS-BP model for the imitation solution sample reaches 0.9975, and the prediction effect of the model is 44.2% higher than that of the SiPLS model. The correlation coefficient of the prediction set under the SiPLS-BP model for blood samples is 0.9907, and the prediction effect of the model is 7.2% higher than that of the SiPLS model. The results show that the nonlinear BP model has a better prediction effect for the solution with a complex background and large sample difference. The SiPLS combined with the BP or PLS model improves the predictive effect of the model significantly for the two samples. This shows that an appropriate characteristic wavelength optimization method can eliminate interference information and simplify the model, greatly improving the prediction effect of the model and increasing the modeling speed. This research provides a new method for the construction of a hemoglobin quantitative analysis model in a complex background by near-infrared spectroscopy and provides a new approach for noninvasive detection of hemoglobin.
1 引言
血红蛋白(Hb)是一种在红细胞内负责运输氧气的特殊蛋白质,血红蛋白浓度的变化可直接反映红细胞浓度的变化。血红蛋白浓度是临床医学上诊断贫血症和其他血液疾病的一项重要指标,血红蛋白浓度的变化可以反映人体健康情况的变化,许多疾病如缺铁性贫血症,恶性贫血、肾功能衰竭、乙肝病毒感染等都会导致血红蛋白浓度的异常变化。精准检测人体内的血红蛋白浓度对于许多人类血液疾病的诊断是十分重要的,目前测量血红蛋白浓度的主要方法有氰化高铁血红蛋白(HiCN)测定法[1]、十二烷基月桂酰硫酸钠血红蛋白(SLS-Hb)法[2]、叠氮高铁血红蛋白(HiN3)测定法[3]及碱羟血红蛋白(ADH 575 nm)测定法等,临床上规定统一使用HiCN测定法作为人血红蛋白测定的标准方法[1]。但这些方法都需要采集血液,配合化学试剂进行体外分析,成本高,分析时间长,操作复杂,且对人体有创伤。
近年来,近红外光谱分析技术不断发展,在农业[4-6]、医药[7-9]、食品[10-12]和燃料化工[13-15]等多个领域中应用广泛。虽然近红外光谱检测技术可以无创且连续检测人体内血红蛋白含量,但是近红外光谱的数据信息量大,仪器、样品等背景干扰大,直接影响模型建立的可信度,所以通常需要针对数据集构建适用模型并优化、提高模型的精度,从而提高检测的精准度。
在选择模型后,可以从数据集划分、预处理方法选择和特征波长优选三个方面优化模型。孙代青等[16]使用Savitzky-Golay(SG)-多元散射校正(MSC)方法对原始全血透射光谱数据进行预处理,提高了全血血红蛋白浓度预测模型的预测精度,最大相关系数达到0.9441。文献[17]在数据集划分及划分比例和预处理方法组合选择两方面对全谱偏最小二乘法(PLS)模型进行优化,模型的相关系数达到了0.9894。文献[18]在特征波长优选这一方面对PLS模型进行优化,模型的相关系数达到了0.9906,预测集均方根误差为1.846。这些研究使用的均是红外光谱中最常用的PLS模型,而PLS模型是线性模型,对于在复杂背景下构建高精准血红蛋白定量分析模型这一需求,选用非线性模型效果可能会更好。王姗姗等[19]构建了基于血红蛋白的双隐含层反向传播(BP)神经网络模型,既可检测血红蛋白又能辨别不同肿瘤疾病,该模型预测集的相关系数达到了0.9838,但该研究并未进行特征波长优选,庞杂的光谱数据会影响建模速度及精度。因此,为了验证非线性模型的性能,本文提出了SiPLS-BP模型,在最佳数据集划分方法及预处理方法下预测了全血样本的血红蛋白浓度,并与SiPLS模型进行对比。本文使用的血液样本数据集与文献[17]、[18]相同,所以本文不再对血液样本的SiPLS模型进行研究。为了避免研究结果的偶然性,本文增加了一个具有复杂背景的仿体溶液样本。
本文采用线性回归模型(PLS模型)和非线性模型(BP神经网络模型)定量分析血红蛋白浓度,并从数据集划分、预处理方法选择以及特征波长优选三方面优化模型。最后基于最佳数据集划分方法、最佳划分比例和预处理方法,对比了全谱PLS模型、SiPLS模型、全谱BP模型和SiPLS-BP模型的预测效果,验证了SiPLS-BP模型对复杂背景下血红蛋白的预测效果。所提方法为无试剂定量检测血红蛋白浓度提供了一种新方法,为血红蛋白无创检测的研究提供了一种新思路。
2 实验部分
2.1 仪器与试剂
实验采用的试剂如下:牛血红蛋白(质量分数为99%),分析纯;胆固醇(质量分数为95%),分析纯;无水葡萄糖,分析纯;英脱利匹特脂肪乳(intralipid)注射液(即文中的仿体溶液),质量分数为20%;实验用水均为超纯水。实验采用的仪器为紫外可见近红外(UV-VIS-NIR)分光光度计。
2.2 实验方法
2.2.1 血红蛋白仿体溶液的配置
采用母液配置法,配置40种血红蛋白仿体溶液,质量浓度范围为122~160 g/L,质量浓度间隔为2 g/L。为了构建血红蛋白仿体溶液的复杂背景,在血红蛋白仿体溶液中加入了质量浓度为1.5 g/L的胆固醇以及质量浓度为0.8~1.4 g/L的葡萄糖,并且样本中intralipid背景溶液的质量分数为10%和5%的两种样本各占20个。
2.2.2 近红外光谱测量
用吸管将配置好的血红蛋白仿体溶液移入比色皿,将比色皿放入仪器内,扫描光谱范围为600~1800 nm,采样间隔为1 nm,光谱分辨率为0.1 nm,检测器单元为积分球。背景光谱为空气中的光谱(以空白石英比色皿作为参比),比色皿厚度为5 mm,依次采集每个样本在每个波长处的吸光度并保存光谱数据。
另外一组数据系研究者在光谱仪上收集的血液样本的近红外光谱透射数据,共计190个样本,剔除异常样本后剩余186个样本,光谱范围为1100~2498 nm,采样间隔为2 nm,共记录700个波长点,血红蛋白的质量浓度范围为103~173 g/L。
2.2.3 光谱数据集的划分
目前常用的四种数据集划分方法有等间隔划分法(Rank)、K-S(Kennard Stone)法、Duplex法、SPXY法,使用这四种方法分别划分两个光谱数据集。基于不同的划分结果建立PLS模型,比较模型预测效果,探索PLS模型最优的数据集划分方法及比例。后续BP建模中由于BP模型的动态变化,也是采用PLS最优数据集划分方法训练出最佳BP网络,然后基于此BP网络对其他三个数据集划分方法进行筛选,优选出BP模型最优的数据集划分方法。
2.2.4 光谱预处理
基于PLS最佳数据集划分方法,选用目前常用的四种预处理方法:多元散射校正(MSC)、标准正态变换(SNV)、移动平均法和直接正交信号校正(DOSC)。使用这四种方法对原始光谱数据进行处理,并建立PLS模型,比较模型预测效果,研究PLS模型最优的预处理方法。导入前文的BP模型及其优选的最佳数据集划分方法,选用上述预处理方法建立BP模型,比较BP模型的预测效果,研究BP模型最优的预处理方法。移动平均方法需要手动设置窗口数,且窗口数必须为奇数,本文遍历了窗口数为3~15的移动平均法,并将最优的移动平均法与其他预处理方法进行对比。
2.2.5 特征波长优选
利用SiPLS划分波段,研究不同波段组合的模型的预测效果,提取预测效果最佳的波段,后续采用此最佳波段进行建模。在对光谱进行特征波长优选后,光谱数据的维度发生变化,BP模型需要重新训练,在优选的特征波段及最佳数据集和预处理方法组合下,训练出最优BP模型。
2.2.6 建立最优模型
采用线性回归最常用的PLS建模方法和非线性回归最常用的BP建模方法,结合数据集划分、预处理和特征波长优选建立模型,并比较所构建的不同模型对复杂背景下血红蛋白仿体溶液数据集和血液样本数据集的适应性。
3 结果与讨论
3.1 PLS模型
3.1.1 血液样本
课题组的前期工作[17]是基于PLS模型对血液样本进行了最佳数据集划分方法及划分比例和最佳预处理方法组合的探寻。文献[18]对血液样本PLS模型进行特征波长优选探寻,其结果为血液样本的最佳数据集划分方法为SPXY法,最佳划分比例为校正集为60个,预测集为126个,最佳预处理组合为SNV+SG一阶导数;SiPLS挑选的波段为1100~1298 nm、1600~1798 nm和2100~2198 nm,基于特征波段建立的最佳SiPLS模型效果为校正集相关系数Rc=0.9937,测试集相关系数(RMSEC)为1.968,测试集相关系数Rp=0.9894,测试集相关系数(RMSEP)为1.947。
3.1.2 仿体溶液样本
3.1.2.1 数据集划分方法和结果分析
在实验采集的40个复杂背景血红蛋白溶液的吸收光谱图中,一个样本的光谱和其他样本有明显的偏差,属于异常样本,因此剔除此异常样本(21号样本)。光谱图中波长800 nm处明显出现了饱和现象,因此选择900~1700 nm波段进行研究。剔除异常样本后的光谱图(900~1700 nm)如
采用等间隔划分法、K_S法、Duplex法、SPXY法四种不同的数据集划分方法,对39个样本进行校正集和预测集的划分,然后建立PLS模型,通过比较模型的预测效果优选划分方法及划分比例。在四种不同的数据集划分方法中,K_S法的结果最好,最佳划分为校正集为30个,预测集为9个,此时模型结果为Rc=0.8857,RMSEC为5.367,Rp=0.957,RMSEP为3.2282。
3.1.2.2 预处理结果对比
仿体溶液样本利用优选的K_S法划分光谱数据,然后结合四种预处理方法(MSC、SNV、DOSC、移动平均法)分别建立PLS模型。本文采用的四种预处理方法均会削弱PLS模型的预测效果,其中MSC、SNV和DOSC三种预处理方法大幅提高了PLS模型对校正集的训练效果,但预测集的效果并没有提升,表明模型处于过拟合状态,所以对仿体溶液样本的PLS模型不进行预处理。
3.1.2.3 特征波长优选
仿体溶液样本的光谱区域划分为1号区间(901~980 nm,x1)、2号区间(981~1060 nm,x2)、3号区间(1061~1140 nm,x3)、4号区间(1141~1220 nm,x4)、5号区间(1221~1300 nm,x5)、6号区间(1301~1380 nm,x6)、7号区间(1381~1460 nm,x7)、8号区间(1461~1540 nm,x8)、9号区间(1541~1620 nm,x9)、10号区间(1621~1700 nm,x10)。各个区间的主因子数(f)及交叉验证均方根误差(RMSECV)如

图 2. 仿体溶液样本在不同区间的建模结果分析
Fig. 2. Analysis of modeling results of imitation solution samples in different intervals
根据
表 1. 仿体溶液样本最佳波段及其组合的定量分析结果
Table 1. Quantitative analysis results of optimal bands and their combinations of imitation solution samples
|
3.2 BP建模
PLS模型是常用的线性回归模型,本文继续深入研究非线性回归模型对复杂背景下的血红蛋白溶液的定量分析效果。在建立BP神经网络模型之前,需要对数据进行归一化处理,消除指标间的影响,使各指标都处于同一数量级。常用的归一化方法有min-max标准化和Z-score标准化方法,本文选择min-max标准化方法对原始数据进行线性变换,使结果映射到[-1,1]区间内。
采用三层(输入层、隐含层、输出层)BP神经网络构建复杂背景下血红蛋白仿体溶液的非线性定量模型。因为具有一层隐含层的神经网络可以映射所有的连续函数,所以选用单隐含层神经网络。输入层为预处理后的光谱数据,光谱数据的维度对应BP神经网络输入层的神经元个数,所以BP神经网络保存后不能再训练不同维度的光谱数据。输出层是血红蛋白浓度,其对应的输出层神经元个数也是输出层数据的维度,这里浓度为一维数据,则输出层的神经元个数为1。本文的隐含层神经元个数设置为8,学习速率为0.1。
3.2.1 血液样本
对186个光谱数据进行归一化预处理后,使用SPXY法划分数据集,建立BP神经网络模型,并重复训练模型,比较模型参数,保存训练好的BP神经网络。然后在此模型下使用其他数据集划分方法,比较不同数据集划分方法下的BP模型结果。全谱BP神经网络模型的最佳数据集划分方法为SPXY法,此时全谱BP神经网络的预测效果为Rc=0.9827,RMSEC为3.392,Rp=0.9742,RMSEP为3.066。利用SPXY法划分数据集,进行预处理方法选择研究,发现建模效果均降低,故选择无预处理。

图 3. BP模型下血液样本预测值与实际值的相关图
Fig. 3. Correlation between predicted value and actual value of blood sample under BP model
3.2.2 仿体溶液样本
对39个光谱数据进行归一化预处理后,使用K_S法划分数据集,建立BP神经网络模型,并重复训练模型,比较模型参数,保存训练好的BP神经网络。然后在此模型下使用其他数据集划分方法,比较不同数据集划分方法下的BP模型结果。BP神经网络模型的最佳数据集划分方法为Duplex法,此时全谱BP神经网络的预测效果最好,Rc=1,RMSEC为2.765×10⁻¹⁰,Rp=0.9915,RMSEP为1.554。在Duplex数据集划分方法下,进行预处理方法选择研究,结果显示,与PLS模型相同,预处理后的定量分析效果均不如无预处理,这表明仿体溶液样本数据不适合过多处理,过多处理会造成模型过拟合。在Duplex法建立的BP神经网络模型下,仿体溶液样本的预测值与真实值的相关图如

图 4. BP模型下仿体溶液样本预测值与实际值的相关图
Fig. 4. Correlation between predicted value and actual value of imitation solution sample under BP model
3.3 SiPLS‑BP建模
3.3.1 血液样本
前文SiPLS挑选的波段(即1100~1298 nm、1600~1798 nm和2100~2198 nm)是基于PLS模型挑选的,BP模型的特征波段可能与PLS模型不同。采用SiPLS遍历10~17个划分区间,在每个区间内构建BP模型,由于BP模型的特性,将第一个划分区间内的模型训练好后并固定下来,相同划分区间数下的后续单个区间均基于此网络进行训练。当区间数为13时,总体光谱的差异性较大,筛选的相关性较大的特征波段有5段。遍历2~7个区间组合,当区间组合数为7时相关性最大,保存此时的网络模型,即为最佳SiPLS-BP模型,优选出的波段范围为1100~1310 nm、1630~1840 nm和2054~2370 nm。血液样本SiPLS-BP模型最优的数据集划分方法为SPXY,无预处理时效果最优,此时血液样本真实值与预测值的相关图如

图 5. SiPLS-BP模型下血液样本预测值与实际值的相关图
Fig. 5. Correlation between predicted value and actual value of blood sample under SiPLS-BP model
3.3.2 仿体溶液样本
为进一步验证SiPLS模型的效果,利用仿体溶液样本,依据前文SiPLS挑选的波段(即1141~1220 nm和1301~1380 nm)建立SiPLS-BP模型,模型定量分析结果如

图 6. SiPLS-BP模型下仿体溶液样本预测值与实际值的相关图
Fig. 6. Correlation between predicted value and actual value of imitation solution sample under SiPLS-BP model
3.4 模型结果的对比分析
3.4.1 血液样本
血液样本血红蛋白定量分析模型包括全谱PLS[18]、SiPLS[18]、SPA-PLS[18]、SiPLS-SPA-PLS[18]、全谱BP及SiPLS-BP,6种模型的结果对比如
表 2. 不同模型下血液样本的结果对比
Table 2. Comparison of results of blood samples under different models
|
3.4.2 仿体溶液样本
复杂背景血红蛋白仿体溶液样本的定量分析模型包括全谱PLS、SiPLS、全谱BP和SiPLS-BP,4种模型的结果对比如
表 3. 不同模型下仿体溶液样本的结果对比
Table 3. Comparison of results of imitation solution samples under different models
|
3.5 波段结果对比分析
血液样本两种模型基于SiPLS优选的波段结果如
表 4. 不同模型下血液样本的筛选波段
Table 4. Screening bands of blood samples under different models
|
4 结论
研究了复杂背景血红蛋白定量分析模型,提出了SiPLS-BP模型,解决了复杂背景下难以构建高精准血红蛋白定量分析模型的问题。为了验证SiPLS-BP模型的有效性,构建了全谱PLS、SiPLS、全谱BP、SiPLS-BP共4种模型,对39个复杂背景血红蛋白仿体溶液和186个血液样本进行了预测。实验结果表明,SiPLS-BP模型对复杂背景血红蛋白的定量分析效果最好,仿体溶液样本基于该模型的预测集相关系数达到了0.9975,模型的预测效果比SiPLS模型提高了44.2%,血液样本基于该模型的预测集相关系数达到了0.9907,模型的预测效果比SiPLS模型提高了7.2%。SiPLS结合BP或PLS模型均可以大幅提升模型对两种样本的预测效果,表明采用合适的特征波长优选方法,可以精简模型,大幅提升模型的预测效果。研究结果为不同背景血红蛋白的定量分析提供了新思路和方法。
[1] Grote-Koska D, Klauke R, Kaiser P, et al. Total haemoglobin‒a reference measuring system for improvement of standardisation[J]. Clinical Chemistry and Laboratory Medicine, 2020, 58(8): 1314-1321.
[2] Arcot L, Kandaswamy S, Modali A, et al. Developing microscopy based microfluidic SLS assay for on-chip hemoglobin estimation[J]. AIP Advances, 2021, 11(2): 025337.
[3] Calvaresi E C, La'ulu S L, Snow T M, et al. Plasma hemoglobin: a method comparison of six assays for hemoglobin and hemolysis index measurement[J]. International Journal of Laboratory Hematology, 2021, 43(5): 1145-1153.
[4] Tsuchikawa S, Ma T, Inagaki T. Application of near-infrared spectroscopy to agriculture and forestry[J]. Analytical Sciences, 2022, 38(4): 635-642.
[5] 刘杰, 刘刚, 李姝洁, 等. 人工老化小麦种子的红外光谱鉴别[J]. 激光与光电子学进展, 2021, 58(8): 0830002.
[6] Pourdarbani R, Sabzi S, Rohban M H, et al. Metaheuristic algorithms in visible and near infrared spectra to detect excess nitrogen content in tomato plants[J]. Journal of Near Infrared Spectroscopy, 2022, 30(4): 197-207.
[7] Wang W B, Keller M D, Baughman T, et al. Evaluating low-cost optical spectrometers for the detection of simulated substandard and falsified medicines[J]. Applied Spectroscopy, 2020, 74(3): 323-333.
[8] Junaedi E C, Lestari K, Muchtaridi M. Infrared spectroscopy technique for quantification of compounds in plant-based medicine and supplement[J]. Journal of Advanced Pharmaceutical Technology & Research, 2021, 12(1): 1-7.
[9] Weber A, Hoplight B, Ogilvie R, et al. Innovative vibrational spectroscopy research for forensic application[J]. Analytical Chemistry, 2023, 95(1): 167-205.
[10] 陈远哲, 王巧华, 高升, 等. 基于近红外光谱的淡水鱼贮藏期质构品质的无损检测模型[J]. 激光与光电子学进展, 2021, 58(12): 1230001.
[11] 胡建, 冯耀泽, 王益健, 等. 基于近红外光谱的鲜味物质与鲜味强度检测[J]. 光学学报, 2022, 42(1): 0130002.
[12] 何国康, 袁凯, 张志勇, 等. 基于二维相关近红外光谱术的小米含水率检测[J]. 激光与光电子学进展, 2022, 59(8): 0830002.
[13] Wang Q Y, Li F S, Xu M Q, et al. Research on geological mineral identification based on near infrared spectroscopy[J]. Fresenius Environmental Bulletin, 2020, 29(8): 6936-6943.
[14] Haese E, Krieg J, Grubješić G, et al. Determination of in situ ruminal degradation of phytate phosphorus from single and compound feeds in dairy cows using chemical analysis and near-infrared spectroscopy[J]. Animal, 2020, 14(7): 1461-1471.
[15] Cheshkova T V, Arysheva A V, Sagachenko T A, et al. Composition of sulfur-linked fragments in asphaltene components of heavy fuel oil and its pyrolysis products[J]. Chemistry and Technology of Fuels and Oils, 2022, 58(2): 306-310.
[17] 朱思聪, 高西娅, 张朱珊莹, 等. 红外光谱数据集划分比例及预处理方法研究[J]. 分析化学, 2022, 50(9): 1415-1429.
Zhu S C, Gao X Y, Zhang Z S Y, et al. Partitioning proportion and pretreatment method of infrared spectral dataset[J]. Chinese Journal of Analytical Chemistry, 2022, 50(9): 1415-1429.
[18] 高西娅, 张朱珊莹, 卢翠翠, 等. 基于SiPLS-SPA波长优选的血红蛋白定量分析研究[J]. 光谱学与光谱分析, 2023, 43(1): 50-56.
[19] 王姗姗, 黄凯, 李铭, 等. 基于BP神经网络的血红蛋白定量光学检测方法[J]. 光学学报, 2018, 38(7): 0717002.
Article Outline
张朱珊莹, 朱思聪, 张献文, 付保荣, 李智, 曹汇敏, 刘繄. 基于SiPLS‑BP模型的血红蛋白定量分析研究[J]. 中国激光, 2023, 50(21): 2107203. Zhushanying Zhang, Sicong Zhu, Xianwen Zhang, Baorong Fu, Zhi Li, Huimin Cao, Yi Liu. Quantitative Analysis of Hemoglobin Based on SiPLS‑BP Model[J]. Chinese Journal of Lasers, 2023, 50(21): 2107203.


