Synergic action of linear dispersion, second-order nonlinearity, and third-order nonlinearity in shaping the spectral profile of a femtosecond pulse transporting in a lithium niobate crystal
1. INTRODUCTION
Ultrashort pulses with large pulse energy can excite strong second-order nonlinearity (2nd-NL) and third-order nonlinearity (3rd-NL) effects of nonlinear crystals, which can realize simultaneous fast modulation in the spatial, temporal, and spectral domains synergically for laser pulses together with its linear dispersion property [1–4]. Spectral supercontinuum (SC) generation can be realized in bulk materials [5,6], optical fibers [7–10], and waveguides [11,12] using the well-known self-phase modulation (SPM) effect induced by the 3rd-NL of materials. However, the 3rd-NL is inherently weak compared to the 2nd-NL. It requires high pump energy to stimulate the 3rd-NL in optical materials, but results in a limited bandwidth of the generated SC due to the energy damage threshold of these materials. Specific dispersion-controlling structures can be designed to realize broadband SC generation by using a pump wave of lower peak energy in fibers and waveguides. This method usually would acquire an SC with low flatness in the spectral profile, as it depends on the accompanied generation of dispersive waves or stimulated Raman waves with sharp rises [13].
These drawbacks in low spectral intensity and low spectral flatness of the generated SC via the 3rd-NL can be improved by making use of the strong 2nd-NL to implement high-efficiency frequency conversions, such as second-harmonic generation (SHG), sum-frequency generation (SFG), difference-frequency generation (DFG), and the high-harmonic generation (HHG) process [14–20], which is a widely used technique to extend the existing SC pump source or SC frequency comb to new spectral regions [21,22]. With the help of quasi-phase-matching (QPM) technology, noncentrosymmetric crystals such as lithium tantalate (LST) and lithium niobate (LN), can be designed into periodically poled lithium tantalate (PPLST) and periodically poled lithium niobate (PPLN) crystals [23–26] that manifest both excellent 2nd-NL and 3rd-NL performances. These materials can be further designed into chirped PPLN (CPPLN) crystals that exhibit multiple controllable reciprocal lattice bands to simultaneously support broadband 2nd–10th HHG via a series of cascaded SHG and SFG processes driven by the 2nd-NL interactions [14]. Furthermore, these crystals can fully utilize both the 2nd-NL and 3rd-NL of the material under the pump of a high pulse energy laser, thus providing an excellent platform to study the synergic actions of nonlinearities and giving rise to the most favorable route for realizing a full-spectrum laser source covering the ultraviolet-visible-infrared (UV-Vis-IR) region [16,17].
We have reported in our previous experimental studies on LN thin plates [24] that an effective spectral broadening of a high-energy near-infrared (NIR) pump can be achieved within a 1 mm transmission length [Fig. 1(a)]. We have also reported the ultra-broadband nonlinear Raman–Nath diffraction [24] and rainbow Cherenkov radiation of the second harmonic wave (SHW) [25] generated in a PPLN thin plate [Fig. 1(b)]. Remarkably, we have noticed that the pump spectra exhibit extremely different broadening patterns in the pure LN crystal and the PPLN crystal of the same size [see the comparison between Figs. 1(c) and 1(d)]. However, the underlying physical mechanisms driving these peculiar spectral broadening profiles were not fully understood at that time.
![Experiment setup and results in our previous studies [25]. The NIR femtosecond laser is coupled into the x-y surface of (a) a pure LN thin plate sample with dimensions of 5 mm(x)×20 mm(y)×1 mm (z), and (b) a z cut PPLN crystal of the same size with poling period of 6.96 μm. (c) and (d) The input pump and output broadened spectra experimentally recorded in systems (a) and (b), respectively.](/richHtml/prj/2024/12/4/774/img_001.jpg)
Fig. 1. Experiment setup and results in our previous studies [25]. The NIR femtosecond laser is coupled into the
In this work, we develop a unidirectional pulse propagation model to describe the synergic broadening mechanism involving linear dispersion, the nonlinear 2nd-NL SHG process, and the 3rd-NL SPM process. We apply this model to calculate the temporal spectral evolution process in a pure LN thin plate and a PPLN thin plate, aiming to elucidate the individual contributions of linearity and nonlinearity to the overall broadening effect. We not only hope to fully understand and interpret the peculiar and diverse spectral broadening profile features illustrated in Fig. 1, but also wish to draw a clear physical picture of these synergic mechanisms that naturally occur in bulk materials under the excitation of a femtosecond laser with a large pump pulse energy and high peak power.
2. MODEL AND EQUATIONS USED TO DESCRIBE THE SYNERGIC LINEAR DISPERSION EFFECT, AND 2ND-NL AND 3RD-NL EFFECTS
The spectral broadening illustrations for crystals with a single 3rd-NL, a single 2nd-NL, and a synergic two-NL are shown in Fig. 2. Figure 2(a) indicates the 3rd-NL spectral broadening induced by the SPM effect, which can generate new frequency components around the pump frequency . Figure 2(b) indicates the 2nd-NL extending as a result of the SHG process and generating a narrowband SHW. If 2nd-NL and 3rd-NL both exist, they would work synergically to form an SC spectrum consisting of a broadband fundamental wave (FW) and a broadband SHW. Although the linear dispersion effect itself has no impact on the broadening mechanism and is out of the illustration scope shown in Fig. 2, it can cause temporal intrapulse variations that can largely impact the evolution process of FW and SHW as well as the interaction between them; therefore, it also plays a crucial role along with these nonlinear actions.
In many traditional simulations for the SC generation process, the spectral and temporal profiles of the pulses are often calculated by considering the linear dispersion along with the 3rd-NL effects, which provide a solid theoretical foundation to elucidate various 3rd-NL phenomena, including the generation of dispersive waves and the self-frequency shift of solitons [7,8,27]. These are all self-action effects that focus solely on how the time-frequency profile of the pulse itself at the previous moment affects its subsequent evolution. However, 2nd-NL effects such as the SHG process [28,29] involve the coupled interaction between two pulses, FW and SHW; thus, it becomes imperative to consider their interactions when simulating the femtosecond pulse transport in materials with synergic 2nd-NL and 3rd-NL effects.
Therefore, we come up with a more accurate unidimensional pulse propagation model that clearly describes the 2nd-NL coupling mechanism along with the linear dispersion and the 3rd-NL effect. Our modified model can be described in the following scalar form:
Here, is an effective complex optical field function that can be regarded as a monochromatic wave centered at the central frequency of FW and SHW, and (, 2) denotes a wide range of discrete frequencies with variation . is the wave vector of the discrete frequency components. The electric polarization function can be further written as
Here, . includes the full dispersion dynamics of the ultrashort input pulse directly calculated from the refractive index of the material. includes the 2nd-NL SHG process described by the well-known coupled wave equations, and includes the classic theory for the SPM effect that denotes 3rd-NL spectral broadening. More specifically, the effective nonlinear optical coefficient and nonlinear refractive index can be deduced from the second-order and third-order polarization tensor and . The simulation parameters of pure LN and PPLN crystal used in this passage are 27.2 pm/V and , respectively. According to the material dispersion of the pure LN and PPLN crystal, the zero-dispersion wavelength locates at about 1920 nm, so here we discuss the spectral broadening effect of the FW and the SHW in the normal dispersion region.
This new unidimensional pulse propagation model is solved and calculated by the split-step Fourier transformation method simultaneously considering the dispersion, and SHG and SPM effects in sequence within each step length. First of all, the dispersion and SHG are calculated in the frequency domain, with the SHG process solved by the fourth-order Runge–Kutta method. Then we use Fourier transformation to calculate the temporal changes induced by the SPM effect. The final step is to take the inverse Fourier transformation back to the frequency domain and get prepared for the next loop.
In our simulation, two sets of time-frequency grids are used to describe the time-frequency evolution process of FW and SHW, respectively. It is more comprehensive to classify the considered effects into two categories: self-action effect (dispersion and SPM) and coupled-action effect (SHG). The former describes how the time-frequency distribution of the pulse itself affects its overall evolution, while the latter characterizes the interaction between these two sets of grids. The advantage of this grid setup lies in its capacity to intuitively tell the researcher whether a certain special output phenomenon, if any, results from the self-action of the pulse or from the interaction between two pulses (FW and SHW). Here we use this methodology to carry out an accurate theoretical analysis of the time-frequency profile of the FW and SHW under the experimental conditions provided in Ref. [25], and systematically examine their spectral evolution as well as their spectral pattern variations under different pump energies.
Our experimental results shown in Figs. 1(c) and 1(d) illustrate the pump broadening observed in a pure LN crystal and in a PPLN crystal, respectively. In this passage, we focus mostly on the different broadening patterns of the FW and the underlying physical mechanisms. As for the SHG process in PPLN crystal, the reported experiment results of the second-harmonic Raman–Nath diffraction have multiple diffraction orders, encompassing a series of phase-matching processes along the domain direction [the direction, as depicted in Fig. 1(b)]. This would greatly govern the restriction on the energy flow and phase-matching process between FW and SHW through the domain periods along the axis, resulting in a significant divergence in the broadening patterns of FW observed between the pure LN and PPLN systems. Moreover, we notice that the strongest output energy of SHW appears in the direction collinear with that of the FW emission, achieving an SHG conversion efficiency of approximately 6.67%. This outcome suggests that a pronounced interaction takes place between the FW and the SHW in this specific direction. Therefore, in this passage we focus mostly on such a prominent spectral broadening effect caused by the interplay of SPM and dispersion of the FW and see how the SHG effect affects the spectral broadening effect of the FW.
3. DISCUSSION FOR EXPERIMENT AND SIMULATION RESULTS
3.1 A. Synergic Effect of Dispersion and SPM in Pure LN System
First, we calculate the spectral broadening of FW in pure LN by taking the self-action effects (linear dispersion and 3rd-NL SPM) into account. The experiment and simulation results displayed in Fig. 3(a) are in good agreement. They both show two asymmetric sidebands around the pump spectral components, spanning 900–1250 nm and 1370–1750 nm, respectively. The SPM effect considered in our simulation will only generate symmetric frequencies around the central frequency without causing temporal profile distortion. On the contrary, the linear dispersion effect also considered in the simulation will only distort the temporal distribution rather than the spectral intensity distribution of the output pulse. Therefore, the observed asymmetric spectrum in Fig. 3(a) must be the result of the synergic interaction of both effects in the time-frequency domain.
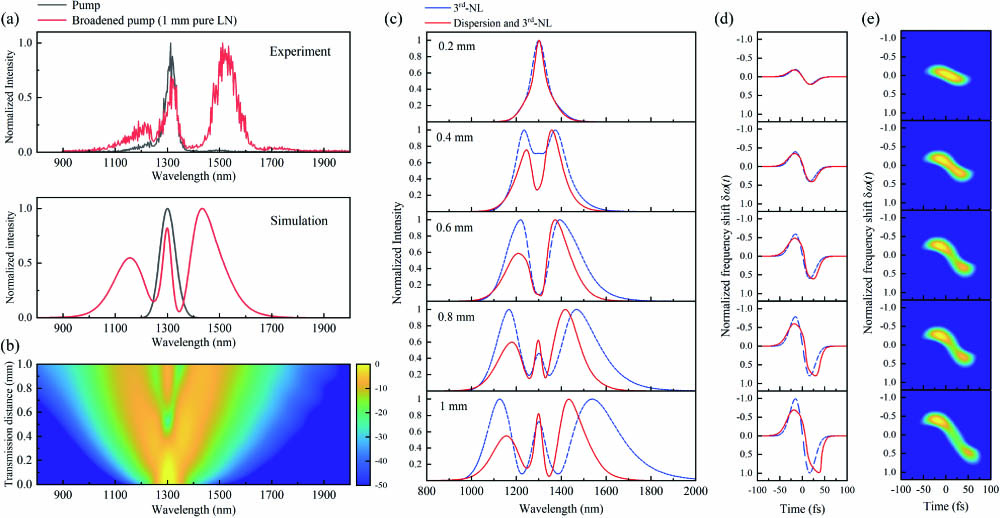
Fig. 3. (a) Experiment and simulation results of the pump (black) and broadened spectrum (red) from pure LN. (b) Simulated spectrum evolution during the pump femtosecond pulse transmitting 1 mm thick pure LN crystal with the action of the 3rd-NL effect along with linear dispersion. The overall calculated (c) broadening spectra and (d) temporal-frequency distributions, and (e) energy hotspot distribution maps plotted in the temporal-frequency configuration are provided in variation with the transmission distance under the synergic actions of the linear dispersion and 3rd-NL. The blue lines shown in (c) and (d) are the calculation results considering single 3rd-NL effect in comparison.
This feature can also be seen in Fig. 3(c), where the blue line considering only the SPM effect results in symmetric sidebands with equal intensity, while the red line considering both dispersion and SPM has asymmetric energy distribution in the spectrum evolution. At the transmission distance 0.2 mm, the blue and red lines display a minimal difference in spectrum broadening and both exhibit a single-peak structure in the frequency domain. At 0.4 mm, a double-peak structure appears in both cases, with the splitting point appearing at the central wavelength of 1300 nm. The spectral peaks in the case of SPM remain symmetric, while the combined influence of the SPM and the dispersion results in an asymmetric energy distribution, with more energy concentrated at the long wave part. At 0.6 mm, the double-peak structure splits more significantly in both cases, and the spectral width of the two peaks also continuously increases. Moreover, the energy distribution asymmetry in the case of SPM together with dispersion is further amplified. At 0.8 and 1 mm, a triple-peak structure appears and, at this time, a spectral peak appears at the central wavelength of 1300 nm, processing the narrowest bandwidth compared to the bands on both sides. In addition, taking the dispersion effect into consideration causes a shift in the position of the spectral peaks and valleys, aligning them closer to the central wavelength.
Aside from the spectral distribution of these two cases, we also display their difference in a time-frequency profile in Figs. 3(d) and 3(e), which reveals intrapulse frequency distribution in variation with the transmission distance. The time-frequency distribution can be deduced directly from the calculated complex temporal electric field. After calculating the temporal phase from the equation , the frequency shift variation with time can be further calculated by . The frequencies shown in Figs. 3(d) and 3(e) are normalized according to the maximum frequency shift value resulting from the SPM effect at 1 mm in the form of
Due to the short transmission distance, the pulse widths of both cases in Fig. 3(d) are maintained at around 50 fs. The frequency shift over time is completely centrosymmetric in the form of a sinusoidal distribution when considering only the SPM effect, as can be seen in the blue line in Fig. 4(a), with the highest and lowest frequency located at the leading middle and trailing middle of the pulse, respectively. The frequency shift induced by dispersion in this pure LN system has a similar distribution, but in a linear form [see the pink line in Fig. 4(a)]. Notice that the case considering the synergic action of the dispersion and the 3rd-NL SPM to some extent can be understood as a nonlinear superposition of the frequency shift of these two effects. Therefore, it can be seen from the red line in Fig. 3(d) that the highest frequency is located at a more leading position due to the superposition. Besides the difference in the temporal distribution of high frequencies, the maximum frequency shift of low frequencies is also different; particularly at 1 mm the normalized cut-off low-frequency is , compared to the value of in the SPM-only circumstance. This is also reflected in Fig. 3(c), where the red line exhibits a significantly lower broadening speed at a long wavelength compared to the blue line. The hotspot maps displayed in Fig. 3(e) highlight the asymmetries in both the energy distribution and frequency broadening mentioned above.
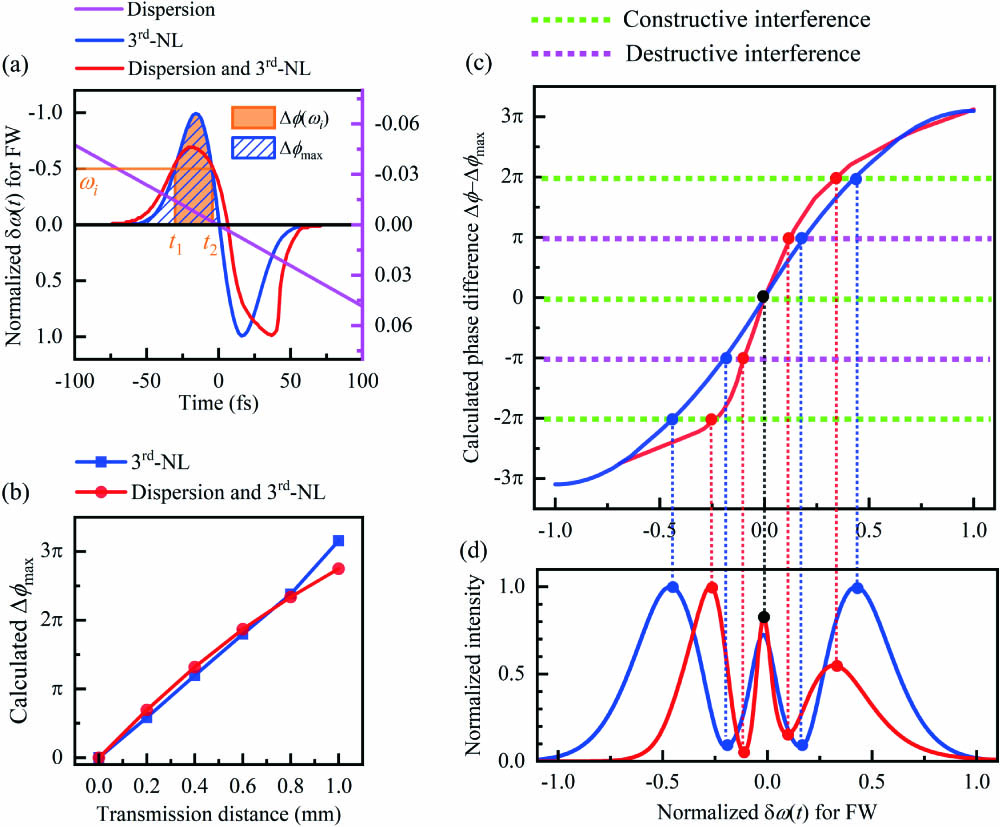
Fig. 4. (a) Illustration for phase difference calculation in the interference model and the calculated temporal frequency shift considering the dispersion, the SPM, and the dispersion + SPM, respectively, after a 1 mm transmission distance in the pure LN crystal. The hatched area represents the value of
We also employ an interference model [27] here to explain the peaks and valleys observed both in the experimental and the simulated broadened spectra. As can be seen in Fig. 4(a), one specific frequency will appear at two moments, and , which results in the interference between two waves of different phases and and different peak intensities and , which can be written as
3.2 B. Synergic Effect of Dispersion, and SHG and SPM Effects in a PPLN System
The reported experiment results of second-harmonic Raman–Nath diffraction in a 1 mm PPLN thin plate show that the output energy of SHW in the collinear direction is the strongest, achieving an SHG conversion efficiency of approximately 6.67%. This outcome suggests a pronounced interaction between the FW and the SHW in this specific direction. Here, we also employ our unidirectional propagation model to simulate the collinear SHG process in a PPLN crystal together with the dispersion and SPM effect. The simulated FW spectrum is shown in comparison to the experiment result in Fig. 5(a). They both depict a weakening of the two asymmetric sidebands generated by the synergic effect of linear dispersion, 2nd-NL SHG, and 3rd-NL SPM, with the left sideband almost disappearing and the right sideband further extending to longer wavelength. We emphasize that the total energy output of FW in our simulations shown in Figs. 3(a) and 5(a) is different. After considering the frequency conversion process in the SHG process, about 7% of the FW energy has already transferred to SHW in the PPLN crystal in our simulation, matching quite well with the experimentally estimated conversion efficiency of 6.67%.
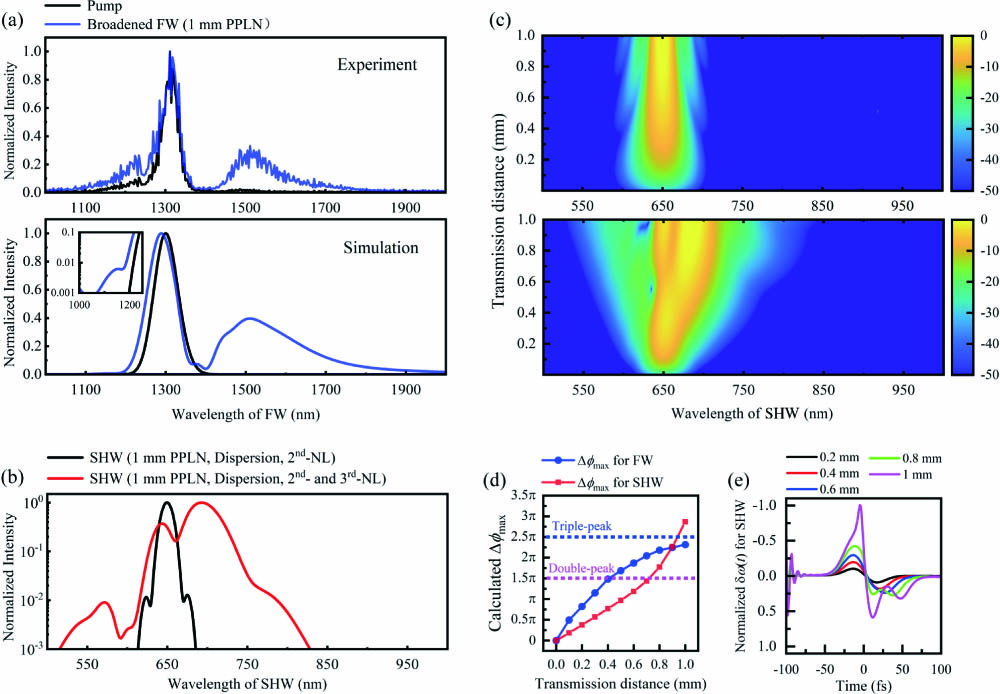
Fig. 5. (a) Experimental and simulated spectrum profile for the input pump pulse and the broadened FW pulse transmitting after a 1 mm PPLN thin plate. (b) Generated SHW spectrum profile considering the dispersion and the 2nd-NL SHG process (the black line), the synergic dispersion, the 2nd-NL SHG, and the 3rd-NL SPM process (the red line), respectively. (c) SHW spectrum evolution in variation with the transmission distance corresponding to the cases of the black line and red line in (b). (d) Calculated maximum phase shift for FW and SHW in variation with the transmission distance. (e) Calculated
The black line in Fig. 5(b) presents the SHW spectrum obtained by only considering the collinear 2nd-NL SHG process, which results in a narrow bandwidth of about 50 nm and centered at 650 nm. The calculated energy conversion efficiency for this case is around 3%. It can be seen in Fig. 5(c) that the bandwidth of the SHW spectrum embodies a significant reduction in variation with the transmission distance. Upon introducing the SPM effect alongside the SHG process, the output SHW spectrum covers 515–817 nm at level [see the red line shown in Fig. 5(b)] after a 1 mm length PPLN crystal. Also, the energy conversion efficiency of SHW increases from 3% to 7% due to the satisfaction of a broadband phase-matching condition under the synergetic effect of SPM and dispersion. Although the SPM broadening effect is considered for both FW and SHW, the SPM effect of SHW should be relatively small due to the smaller pulse energy. Therefore, the substantial broadening effect of SHW predominantly arises from a broadband SHG process , . Facilitated by the large input pulse energy, the SPM effect can severely broaden FW fast enough to realize a rapid and highly efficient SHG process before a temporal walk-off. In our SHG calculations, the phase mismatch is directly calculated by , which strictly governs the spectral energy that can be transferred from FW to SHW.
In Fig. 5(d) we calculate and show the maximum phase shift for FW and SHW under an experiment pump energy of 60 μJ. of the SHW increases faster than that of FW, finally reaching , which exceeds the required maximum phase for three-peak formation. Meanwhile, the final for FW is , which aligns with the two-peak condition. We also calculate the temporal frequency shift profile of SHW with the results shown in Fig. 5(e) and notice that it has characteristics similar to that of the SPM-induced for FW shown in Fig. 4(a). Also, the maximum phase shift calculated for SHW reaches , which even surpasses the SPM-induced maximum phase shift for the FW. This is a very intriguing but reasonable phenomenon. Although the SPM effect of SHW itself is insufficient to generate such a large (i.e., such a large frequency-shift amount representing intense broadening), we can still depend on the 2nd-NL effect to realize an equally good broadening of the spectrum as well as a similar control on the temporal frequency shift profile. This suggests that the SHG process not only can serve as a frequency conversion technique, but also has rich potential in temporal phase control that can emulate with a conventional 3rd-NL effect.
The generated spectra of SHW and FW in variation with the input energy are also calculated, with the results shown in Fig. 6. They all manifest the trend that the long wave part of SHW experiences a higher conversion efficiency and consumes more energy in the long wave part of FW. This is also the conclusion we can get from the experimental FW spectra shown in Figs. 3(a) and 5(a). Figure 7(a) shows how the SHW energy varies with different input pump energies. When the input pump energy is 10 μJ, the FW spectrum is slightly broadened, resulting in phase-matching conditions only satisfied for a rather narrow bandwidth centered at 650 nm in Fig. 6(a). Meanwhile, the energy of the SHW accumulates almost linearly, as can be seen in the black line in Fig. 7. When the input energy increases from 30 to 90 μJ, as can be seen in Figs. 6(b)–6(e), the generated SHW gradually displays a two-peak structure with one peak almost fixed at 650 nm and the other peak consistently red shifted from 693 to 730 nm. Meanwhile, the FW broadening pattern is largely influenced. It also displays a similar two-peak structure with one almost fixed at 1300 nm and the other one consistently red shifted from 1392 to 1510 nm. The inflection points labeled for each curve in Fig. 7 indicate the transmission distance where the double-peak structure is first observed in the simulation. As the input energy increases, these inflection points appear at a shorter transmission distance, which means different phase-matching processes are reaching their maximum conversion efficiency at a faster rate. The corresponding curves shown in Fig. 7(a) can be separated by the inflection points into single-peak, double-peak, and triple-peak regions. When the input energy reaches as high as 110 μJ, both the FW and the generated SHW receive a stronger broadening effect and form a three-peak structure, as illustrated in Fig. 6(f).
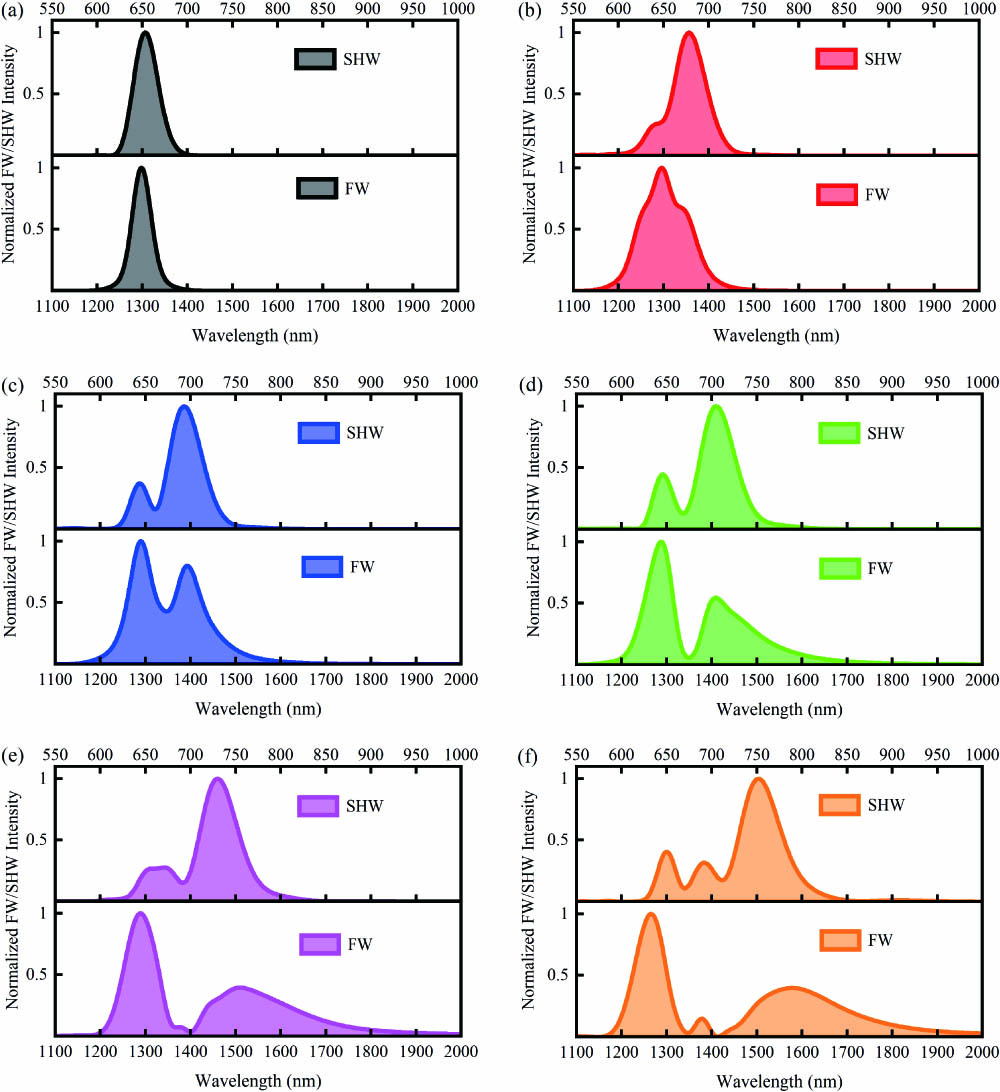
Fig. 6. Simulated spectra of FW and SHW under different pump energies: (a) 10 μJ, (b) 30 μJ, (c) 50 μJ, (d) 70 μJ, (e) 90 μJ, and (f) 110 μJ.
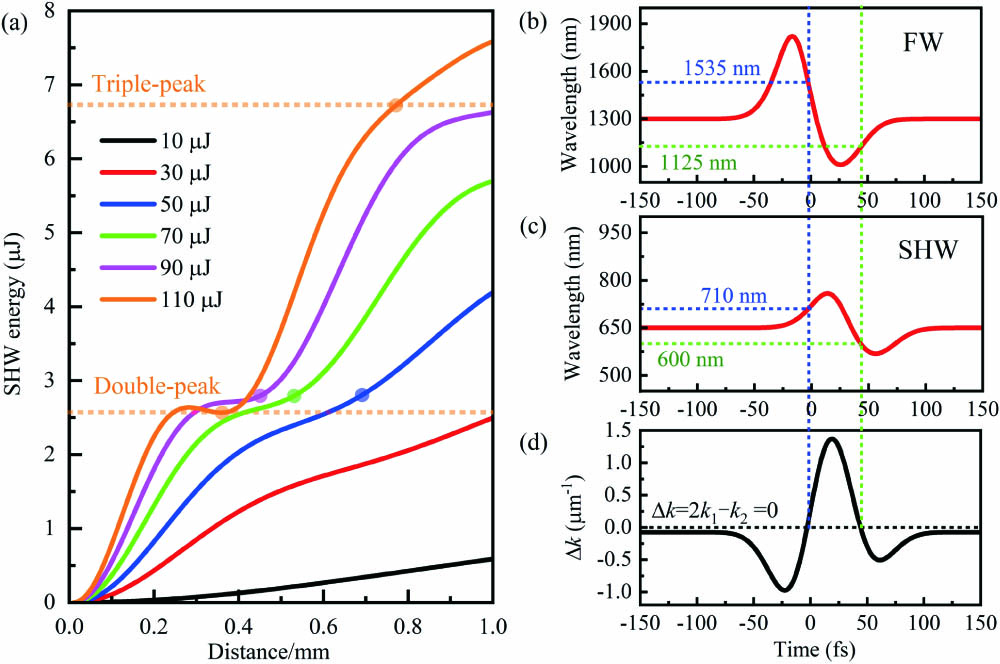
Fig. 7. (a) Simulated SHW energy as a function of the transmission distance with increasing pump energies. The dotted inflection points indicate the generation of a new spectral peak. (b)–(d) Temporal-frequency illustration for phase-mismatch calculation after the pulse propagating 0.4 mm within the 1 mm length PPLN crystal. The red lines in (b) and (c) indicate the SPM-induced intrapulse wavelength distribution. The SHW pulse is plotted in the reference frame moving with the group velocity of the FW; thus, the 650 nm component in (c) temporally lags behind the 1300 nm component in (b). The horizontal black dotted line in (d) represents the phase-matching condition
The output broadening spectra of the FW and the SHW above show that the long wave part of SHW experiences a higher conversion efficiency and consumes more energy in the long wave part of the FW. To further analyze this varying trend, we calculate the phase-mismatch profile in the temporal-frequency domain, as displayed in Figs. 7(b) and 7(c). This phenomenon becomes pronounced after propagating 0.4 mm within the 1 mm length PPLN crystal, which is evident from the spectral evolution of the SHW in Fig. 5(c). The red lines in Figs. 7(b) and 7(c) show the temporal wavelength distribution for FW and SHW at 0.4 mm under experiment conditions, which can be defined as and ; , and denotes the group velocity of the FW. By calculating their phase difference, we can obtain a temporal phase-mismatch distribution [see the solid black line in Fig. 7(d)] that is responsible for the subsequent SHG process. The dotted black line in Fig. 7(d) represents the phase-matching condition , and its intersection points with the solid black line correspond to two phase-matching points. According to the wavelength distribution profiles provided in Figs. 7(b) and 7(c), these two points represent and , respectively. The first point takes place at the long wave part of the FW (1535 nm) with a rather high energy peak, which guarantees an efficient energy conversion in the subsequent SHG process. In the subsequent transmission process, the long wave energy of the FW will be further consumed and converted into the long wave part in the SHW. On the contrary, the second phase-matching point takes place at the short wave part of the FW (1125 nm) with a low peak energy; therefore, the conversion efficiency of the corresponding SHG process is greatly reduced and the 585 nm component of the SHW is generated with a low conversion efficiency. Our modified calculation for the temporal phase mismatch of FW and SHW considers the temporal intrapulse wavelength distribution induced by the SPM and the dispersion effect, which is beyond the scope of conventional SHG calculations. This method allows for a more accurate estimation of the matched FW/SHW bands in the frequency conversion process.
4. CONCLUSION
In summary, we have presented a detailed temporal-spectral-spatial analysis on the femtosecond pulse transporting, temporal evolution, spectral broadening in two sets of systems: a pure LN thin plate and a PPLN thin plate. We have fully considered the synergic action of the linear dispersion effect, the 2nd-NL SHG effect, and the 3rd-NL SPM effect in our simulation process based on an improved split-step Fourier transformation method. The simulated spectra agree well with our previously reported experiment data. Such a detailed analysis and discussion provide a deep insight into the synergic actions of linear and nonlinear effects and show that they are all indispensable for fully understanding these fruitful optical and physical phenomena and laws that are brought about by the interaction of a femtosecond laser pulse with an LN nonlinear crystal.
For the pure LN system that inherently involves the linear dispersion effect and the 3rd-NL SPM effect, we developed an interference model that enables us to understand the peaks and valleys represented in the spectrum profile. Moreover, we have analyzed the synergic effect of the dispersion and SPM from two aspects (the evolution of the spectrum and time-frequency distribution) and quantified the extent of broadening by an appropriate physical entity as . We have found that the SPM process dominates the overall broadening phenomenon, while the dispersion effect limits the SPM-induced broadening to some extent and leads to the asymmetry in the time-frequency distribution as well as in the energy distribution.
For the PPLN system, the linear dispersion, and the 2nd-NL SHG and the 3rd-NL SPM effects coexist and take synergic action. We have shown that when SPM does not exist, the conversion efficiency of SHW is only 3%; at the same time, it results in a rather narrow bandwidth of only 71 nm (covering 613–684 nm) at the level. However, the synergetic SPM and SHG processes increase the conversion efficiency up to 7% (matching quite well with our experimentally tested conversion efficiency of 6.67%) with a bandwidth of 313 nm (covering 515–817 nm) at the level. The linear dispersion also plays a crucial role along with these synergic nonlinear actions. It not only can transform the intrapulse distribution of each pulse, affecting the original SPM-induced broadening pattern and causing a strong broadening effect of the SHW, but also can affect the frequency conversion process via phase matching between pulses. By calculating the maximum phase shift, we have found that the broadening degree of SHW is even higher than the SPM-induced broadening of FW at this time. By calculating the time-frequency distribution of SHW, we have noticed that the SHG process can also bring a temporal frequency shift similar to that of the SPM-induced frequency shift of FW. This indicates that the 2nd-NL processes also have great potential for temporal phase control (for example, pulse compression) comparable to or even stronger than the traditionally used 3rd-NL effects like the SPM effect or the XPM effect. We believe the physical model of synergic linearity and nonlinearity developed and analyzed in this work will help to draw a more realistic and authentic physical picture of interacting nonlinear processes brought about by femtosecond laser propagation in bulk material under a large pump energy intensity. This study can not only help to understand the generation of broadband SC and even all-spectrum white laser at a deeper level, but also can help to explore its potential application in spatial-temporal-spectral control of ultrafast laser pulses.
Article Outline
Lihong Hong, Yuanyuan Liu, Zhi-Yuan Li. Synergic action of linear dispersion, second-order nonlinearity, and third-order nonlinearity in shaping the spectral profile of a femtosecond pulse transporting in a lithium niobate crystal[J]. Photonics Research, 2024, 12(4): 774.


