基于双通道反射式微纳光纤耦合器膜片的精准连续血压监测【增强内容出版】
Cardiovascular disease (CVD) is the most important cause of human death, of which hypertension is the most common chronic disease in people's life and is one of the most important risk factors for CVD. With the socio-economic development and accelerating population aging and urbanization, hypertension is on the rise. According to research, the presymptoms of hypertension are not obvious, and a considerable portion of patients do not have any uncomfortable clinical symptom such as dizziness, headache, and shortness of breath. When blood pressure is elevated for a long time and exceeds the normal range, this may result in serious complications and even threaten life safety. Therefore, accurate blood pressure monitoring is crucial for early diagnosis and intervention treatment. However, compared with the single point in time blood pressure detection of traditional cuff-type electronic blood pressure monitors, continuous dynamic monitoring can more truly reflect the real-time changes in blood pressure and dynamic trends, providing more comprehensive and accurate data. The human pulse signal contains a large amount of physiological and pathological information related to the cardiovascular system, and continuous blood pressure monitoring can be realized by accurately extracting the characteristic parameters and building a blood pressure prediction model. Currently, the main method of pulse signal detection is the PPG method, whose major drawbacks are high power consumption, sensitivity to ambient light and pressure perturbation, and susceptibility of electronic components to electromagnetic wave interference. As a result, it is impossible to measure blood pressure simultaneously in special environments such as MRI and CT. Thus, we propose a fiber-optic blood pressure sensor with continuous accurate measurement and without spatial alignment based on the microstructural setup of a reflective microfiber coupler, which is achieved by combining dual-channel pulse wave acquisition and machine-learning model prediction. This electromagnetic interference-resistant, wearable, and continuous blood pressure monitoring system will play an important role in human CVD prevention in the future.
First, two single-mode fibers twisted around each other are drawn into a microfiber coupler using the flame fusion taper method, and the reflective coupler is formed by cutting flat at the section of the waist region area, which has a diameter of 5 μm and a length of 10 mm. The device is encapsulated between an epoxy resin substrate and two layers of PDMS circular films, where the substrate is a through-hole structure, the upper PDMS layer is a circular film with a diameter of 15 mm and a thickness of 100 μm, and the lower PDMS is a raised spherical structure with a diameter of 10 mm and a height of 1.5 mm. Particularly, this structure can improve the detection sensitivity and reduce the sensitivity of the sensing area to the spatial location. Then, a dual-channel pulse wave detection system is set up to obtain the brachial artery transit time (BPTT), the radial artery transit time (RPTT), and the transit time difference between the radial artery and brachial artery (DBRPTT). Finally, the support vector regression algorithm is utilized to build a blood pressure prediction model to realize continuous and accurate blood pressure detection.
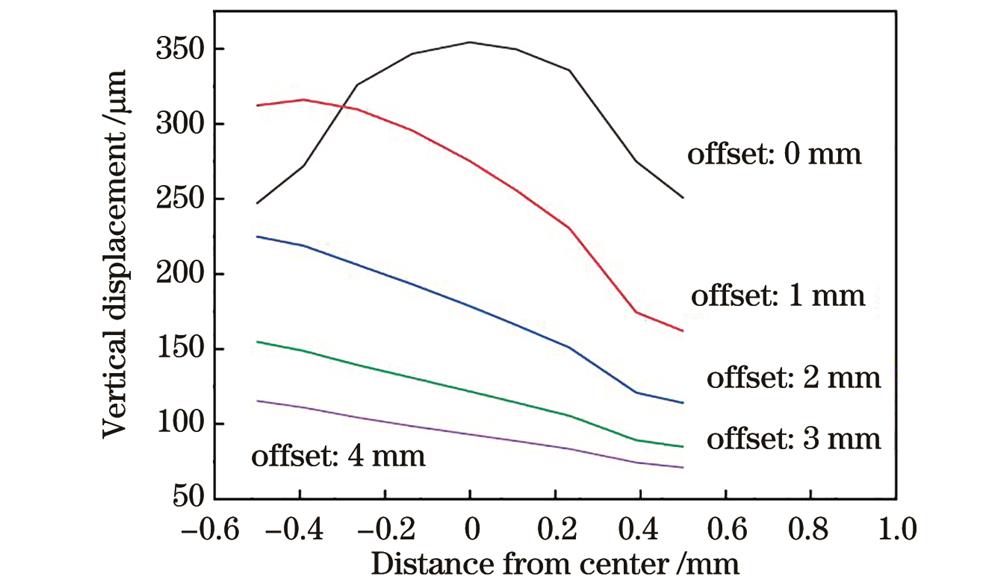
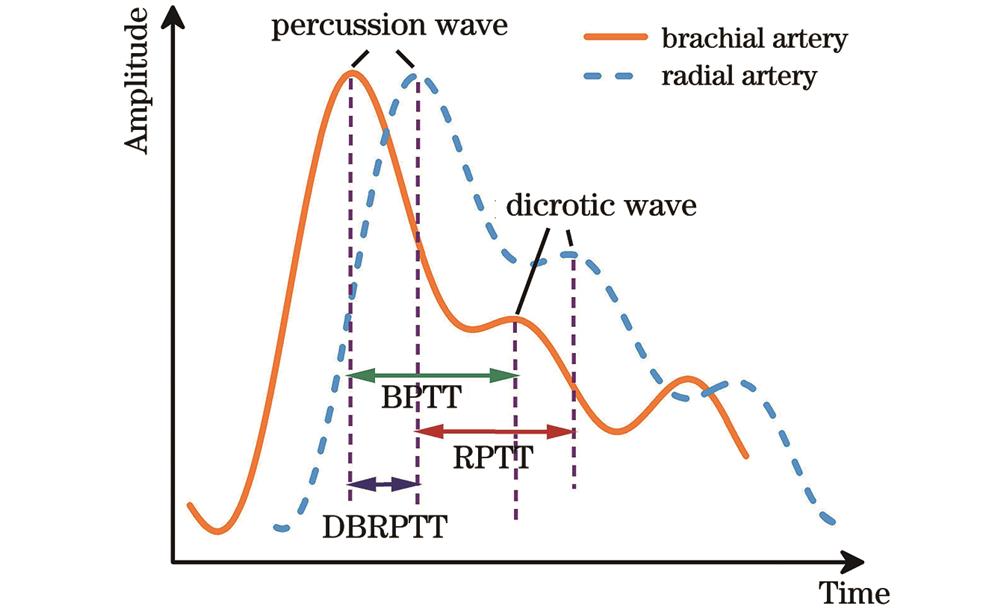
The mechanical simulation results of the packaging structure show that it can sense micro-pressure from multiple directions, reducing its dependence on the detection position (Figs. 2-3). In the static pressure experiment, the detection sensitivity is -0.682 kPa-1 in the range of 500-1000 Pa. The sensor can respond immediately at the moment of loading and unloading pressure, with the response time of 35 ms and 46 ms respectively. Additionally, the durability and repeatability of the sensor are also tested. After 2500 cycles of the periodic pressure with a frequency of 5 Hz and a size of 1 N, the sensor still shows good response and excellent repeatability. After about 5000 cycles, the response amplitude drops by about 5% from the beginning. Since the time for sensing to measure pulse is short (about five seconds), less impact is exerted on later blood pressure prediction. When the sensor is placed at different positions in the radial artery area, the sensor can effectively detect high-fidelity pulse signals, indicating that there are no strict alignment requirements between the sensor and the artery (Fig. 5). By employing a dual-channel sensing system, the pulse waveforms at the radial artery and brachial artery are collected simultaneously. Three PTT (BPTT, RPTT, and DBRPTT) characteristic parameters (Fig. 6) are extracted from these sample data to build a blood pressure prediction model. The correlation diagram and Bland-Altman diagram reveal that both the true and the predicted values are negatively correlated with the K value. The correlation coefficient R values of SBP and DBP are 0.96 and 0.95 respectively, which indicates that there is a good positive correlation between the reference and predicted values. The mean difference value and SD value of SBP are 0.08 mmHg and 1.13 mmHg respectively, and the mean difference value and SD value of DBP are -0.35 mmHg and 1.25 mmHg respectively (Fig. 11). These indicators are both lower than the AAMI standard [(5±8) mmHg]. The performance comparison results between the sensor and other blood pressure sensors show that the sensor features an extremely compact structure, high sensitivity, sound stability, long service life, and anti-electromagnetic interference. Finally, a volunteer is randomly selected to collect 14 sets of data from 8:00 to 21:00 a day to verify the feasibility of the sensor. The results demonstrate that the normal pattern of“two peaks and one trough”is blood pressure trends. Another volunteer receives continuous monitoring during a mixed exercise of squatting and jogging. As the exercise time increases, both SBP and DBP rise but remain stable after about ten minutes (Fig. 12). This shows that the proposed blood pressure monitoring system can continuously and effectively monitor the health level of blood pressure.
We develop a reflective optical microfiber coupler sensor chip (R-OMCSC) for cardiovascular health assessment of accurate and continuous blood pressure monitoring. The R-OMCSC exhibits performance with high sensitivity and detection pulse wave without spatial alignment, which allows for perceiving weak physiological signals. Embedding the sensor into a sports wristband, we construct a dual-channel pulse wave detection system, obtain the RPTT, DPTT, and DBRPTT values, and build an SVR prediction model. Experimental results show that the system can achieve continuous blood pressure monitoring. In the future, we will keep improving the integration of the photoelectric signal processing system with the proposed dual-channel R-OMCSC pulse wave sensor, and a large amount of data will be collected for more accurate analysis. The proposed non-invasive BP detection system features high accuracy and continuous monitoring and will have the opportunity to be employed for clinical applications and thus help patients with CVD prevention.
1 引言
心血管疾病在人们的生活中越来越常见,是威胁人类健康的最重要因素之一。据报道,全球有超过13亿人患有心血管疾病,心血管疾病导致的死亡人数从1990年的1210万增至2019年的1860万,预计到2030年,死亡人数将增至2300万[1-4]。血压(BP)是评价人体生理健康状况的重要生理参数,可用于心血管疾病的早期诊断和预警。因此,持续、精准地监测人体血压非常重要[5]。目前,商用血压计通常采用充气袖带技术,根据减压时袖带压力振荡波的振幅变化包络来测定血压,但它存在测量者不适和无法连续测量的缺点[6]。近年来,研究者提出了多种血压监测方法,包括超声技术、光电容积描记法(PPG)等[7]。2018年,Wang等[8]提出一种检测人体动脉和静脉血流的超声设备,可对心血管疾病进行实时连续监测。2013年,Kurylyak等[9]通过PPG传感器从人体脉搏信号中提取了21个特征,并利用人工神经网络(ANN)实现了连续血压测量。2019年,Mousavi等[10]提出一种新算法,该算法根据整体PPG信号预测血压,而不考虑其参数特征,提高了血压检测的准确性。2021年,Byfield等[11]利用双通道PPG传感器测量脉搏波速度,基于机器学习模型实现了连续、准确的血压测量。然而,PPG传感器的检测精度受检测环境的影响较大,当人体肤色加深、皮肤出汗时,PPG传感器的检测精度会降低。此外,由于电磁干扰,这些传感器无法监测复杂电磁环境(如核磁共振)中的脉搏波。
光纤传感器因其抗电磁干扰、灵敏度高、易于制造、结构紧凑和成本低廉等优点被用于连续和可穿戴式血压监测。由于脉搏传导时间(PTT)和脉搏波速度(PWV)与人类心血管疾病密切相关,基于PTT和PWV预测血压的数学模型被认为是有效的。2016年,Koyama等[12]提出一种光纤Bragg光栅(FBG)血压监测系统,通过检测人体右侧桡动脉脉搏波预测血压。2019年,Haseda等[13]使用FBG传感器监测人体肱动脉脉搏波,该方法测量的血压值与商用血压计测量的参考值具有适度的相关性(相关系数R=0.72)。2021年,Kumar等[14]进一步提出血压预测模型,用于预测人体收缩压(SBP)和舒张压(DBP),二者的平均预测准确率分别为89.85%和94.20%。2021年,Li等[15]利用光纤法布里-珀罗(F-P)腔传感器检测人体腕部桡动脉的脉搏波形,并根据脉搏信号得出的PTT建立了血压预测模型。2022年,Li等[16]专门设计用于检测人体桡动脉的微光纤封装结构,该传感器无需严格的对准要求即可快速准确地捕捉人体脉搏信号。然而,这些光纤传感器普遍都是单通道的,模型精度不够高。为进一步提高模型预测的准确率,Pang等[17]利用单模-多模-单模光纤结构同时测量肱动脉传导时间(BPTT)和桡动脉传导时间(RPTT),然后根据桡动脉和肱动脉的传导时间差(DBRPTT)实现血压的连续测量,该方法的检测灵敏度依赖于脉搏波位置的精准对齐,且其采用透射式光路,因此传感器集成的结构不够紧凑,实际使用不太方便。
本文提出一种基于双通道反射式微纳光纤耦合器(R-OMC)膜片结构的高精度血压监测方法。微纳光纤耦合器(OMC)[18]在检测脉搏波时的形变主要由轴向应变和弯曲应变引起,其轴向应变灵敏度约比相同直径的单根微纳光纤高两倍[19-20]。利用特殊封装结构的R-OMC膜片监测人体脉搏波信号,可有效提高检测灵敏度,并可降低传感器与人体动脉之间严格的对准要求。然后,利用双通道R-OMC膜片从8名志愿者的肱动脉和桡动脉采样的大量脉搏信号中提取BPTT、RPTT和DBRPTT,使用支持向量回归(SVR)模型实现连续、准确的血压预测。
2 传感器原理与特性
2.1 传感器结构设计与制备
R-OMC由锥区和腰区组成,其中腰区处的两条微纳光纤平行紧密地叠加在一起,如

图 1. 结构示意图。(a) R-OMC的结构;(b)显微镜下的R-OMC;(c)传感器膜片的结构;(d)完整的传感器膜片
Fig. 1. Diagram of structure. (a) Structure of R-OMC; (b) R-OMC under microscope; (c) structure of sensor chip; (d) complete sensor chip
为保护制备好的R-OMC波导结构,首先将其浸泡在特氟龙溶液10 min,然后放入干燥箱中在80 ℃下干燥30 min,以使腰区表面和端面都覆盖一层特氟龙薄膜。如
2.2 传感器结构力学仿真
使用ABAQUS CAE软件对传感器封装结构进行力学仿真,以验证该设计对提高灵敏度和减小传感器对空间位置敏感性的影响。建立如

图 2. 封装结构的机械模拟。(a)来自多个方向的压力;(b)来自单个方向的压力
Fig. 2. Mechanical simulation of package structure. (a) Pressure from multiple directions; (b) pressure from single direction
2.3 传感器的压力传感性能分析
为评估R-OMCSC的灵敏度,搭建如
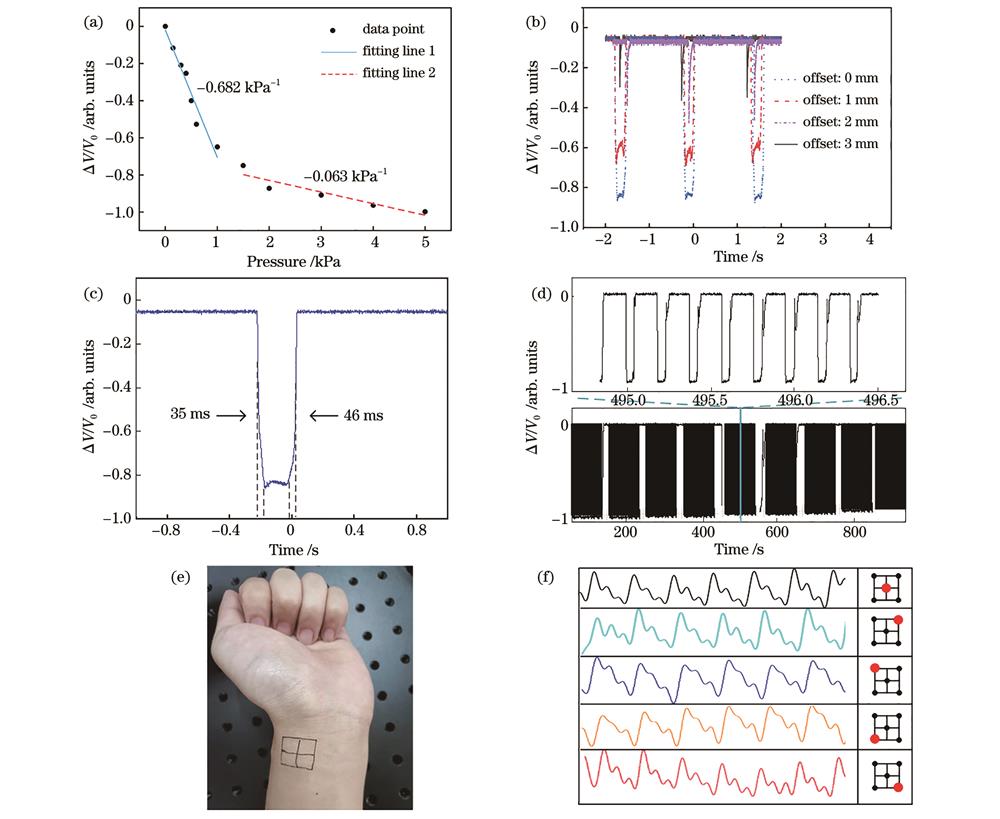
图 5. R-OMCSC的特性。(a)压力灵敏度;(b)施加在不同位置的压力的电压变化;(c)响应时间;(d)重复性;(e)桡动脉的不同检测位置;(f)人体脉搏在不同位置的脉搏波形
Fig. 5. Characteristics of R-OMCSC. (a) Pressure sensitivity; (b) voltage change of pressure applied at different locations; (c) response time; (d) repeatability; (e) different detection locations in radial artery; (f) pulse waves at different locations of human pulse
3 实验与建模
3.1 双通道脉搏波检测
脉搏波信号包含许多特征参数,如PTT、PWV、波形等,反映人体心血管功能和血液传输过程中丰富的生理信息[25]。人体手臂肱动脉和桡动脉的典型脉搏波形如
如
脉搏波的采集由两个带R-OMCSC的腕带和一个商用血压计完成,采样持续10天,每天8:00至21:00每小时采集一次脉搏样本,共采集14个样本。实验中,志愿者直立坐着,双手平放在测试台上,与心脏保持同一水平,以提高测量的准确性,将两条带有R-OMCSC的弹性腕带分别固定于志愿者左臂的桡动脉和肱动脉上,弹性腕带内侧的R-OMCSC分别对准桡动脉和肱动脉,如
3.2 脉搏数据的PTT提取
对所采集到的1120组数据进行预处理和特征提取,如
PTT被认为是通过脉搏波预测血压的有效方法,其关系[15]可表示为
式中:BP表示SBP或DBP;PTT表示RPTT、BPTT或DBRPTT;Ka、Kb、Kc表示与个体相关的系数,可通过建立血压参考值和实验得出的PTT值之间的函数关系来获得。所测得1120 组脉搏信号的PTT有一定的波动范围,如
表 1. RPTT、BPTT和DBRPTT值的测量范围
Table 1. Measurement range of RPTT, BPTT, and DBRPTT
|
3.3 血压预测模型
支持向量回归(SVR)是一种二元分类模型回归算法,在非线性和样本量较小的情况具有泛化能力好、预测准确率高等优点[27]。本研究中K值预测血压是一个非线性回归问题,针对本实验的1120组样本数据,选择SVR建立血压预测模型是合理有效的。
K值和商用血压计对应血压值作为一个数组
式中:
式中:

图 9. 对c和g进行网格搜索的结果。(a) SBP模型;(b) DBP模型
Fig. 9. Grid search results for c and g. (a) SBP model; (b) DBP model
4 结果与讨论
将1120组脉搏和血压数据中90%的数据作为训练集输入SVR模型,剩余10%的数据作为测试集用于验证模型的准确率。从测试集的模型输出结果中随机抽取25组数据,如

图 10. SVR 预测模型的输出。(a) SBP模型;(b) DBP模型
Fig. 10. Output of SVR prediction model. (a) SBP model; (b) DBP model
如
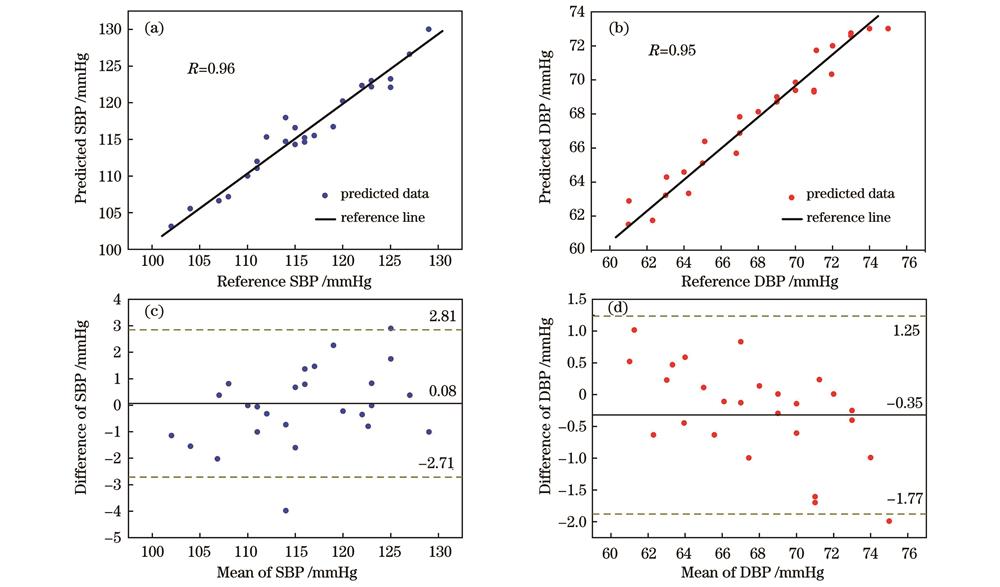
图 11. 基于SVR的双通道血压检测模型的相关图和Bland-Altman图。(a)(c) SBP模型;(b)(d) DBP模型
Fig. 11. Correlation plots and Bland-Altman plots of dual-channel BP detection model based on SVR. (a)(c) SBP model; (b)(d) DBP model
表 2. 与其他血压传感器的性能比较
Table 2. Performance comparison with other blood pressure sensors
|
为了进一步评估该传感器的可行性,选取了一名志愿者(女性,24岁)来分析血压测量趋势。

图 12. 血压和K值的变化。(a)一天内的不同时刻;(b)运动时
Fig. 12. Changes of BPand K value. (a) Different times in one day; (b) exercise time
此外,为评估传感器监测运动中血压波动的稳定性,一名志愿者(男性,24岁)在做深蹲和慢跑的混合运动过程中接受了测试,总的测试时间为14 min,每2 min由该传感器记录一次血压,每次持续10 s。如
实验结果表明,基于R-OMCSC的双通道腕带能够精确连续地获取人体脉搏信号,并通过PTT建立SVR模型,实现连续、准确的血压监测。与传统的电子血压检测传感器相比,本文提出的传感器的最大优点是抗电磁干扰,从而扩大了应用场景范围,其集成在腕带中还具有采集方便、灵敏度高等优点。
5 结论
本文提出一种反射式微纳光纤耦合器传感膜片,用于准确、连续的血压监测和心血管健康评估。R-OMCSC具有高灵敏度(-0.682 kPa-1)和检测脉搏波时无需精准空间对齐的特点,通过将该传感器嵌入运动腕带,实现了人体肱动脉和桡动脉的脉搏波监测。然后,建立双通道脉搏波检测系统,以获得桡动脉和肱动脉的RPTT、DPTT和DBRPT值,并建立相应的SVR血压预测模型,通过关联图和Bland-Altman图讨论了该模型的准确性。实验结果表明,模型的MD值和SD值符合AAMI标准,SBP值分别为0.08 mmHg和1.13 mmHg,DBP值分别为-0.35 mmHg和1.25 mmHg,与其他类型的传感器相比,所提出的传感器检测的SBP和DBP在准确度上都有较大的提高,并可以实现连续的血压监测功能。后续工作可在几方面加以改进:1)可进一步进行系统光源、探测部分的集成化和微型化;2)通过增加检测对象的数量和类型来提高预测模型的准确性;3)进一步考虑其他脉搏特征,包括总外周阻力、动脉顺应性、脉搏容量等,从而使预测模型更加准确。该可穿戴式的双通道连续血压监测系统在人类心血管疾病预防领域将具有良好的应用潜力。
[1] Chen W W, Gao R L, Liu L S, et al. China cardiovascular diseases report 2015: a summary[J]. Journal of Geriatric Cardiology: JGC, 2017, 14(1): 1-10.
[2] Jonas M, Kazarski R, Chernin G. Ambulatory blood-pressure monitoring, antihypertensive therapy and the risk of fall injuries in elderly hypertensive patients[J]. Journal of Geriatric Cardiology, 2018, 15(4): 284-289.
[3] Schumann B, Seidler A, Kluttig A, et al. Association of occupation with prevalent hypertension in an elderly East German population: an exploratory cross-sectional analysis[J]. International Archives of Occupational and Environmental Health, 2011, 84(4): 361-369.
[4] Chaising S, Temdee P. Determining significant risk factors for preventing elderly people with hypertension from cardiovascular disease complication using maximum objective distance[J]. Wireless Personal Communications, 2020, 115(4): 3099-3122.
[5] Berkelmans G F N, Kuipers S, Westerhof B E, et al. Comparing volume-clamp method and intra-arterial blood pressure measurements in patients with atrial fibrillation admitted to the intensive or medium care unit[J]. Journal of Clinical Monitoring and Computing, 2018, 32(3): 439-446.
[6] TengX F, ZhangY T. An evaluation of a PTT-based method for noninvasive and cuffless estimation of arterial blood pressure[C]∥2006 International Conference of the IEEE Engineering in Medicine and Biology Society, August 30-September 3, 2006, New York, NY, USA. New York: IEEE Press, 2006: 6049-6052.
[7] Allen J. Photoplethysmography and its application in clinical physiological measurement[J]. Physiological Measurement, 2007, 28(3): R1-R39.
[8] Wang C H, Li X S, Hu H J, et al. Monitoring of the central blood pressure waveform via a conformal ultrasonic device[J]. Nature Biomedical Engineering, 2018, 2(9): 687-695.
[9] KurylyakY, LamonacaF, GrimaldiD. A neural network-based method for continuous blood pressure estimation from a PPG signal[C]∥2013 IEEE International Instrumentation and Measurement Technology Conference (I2MTC), May 6-9, 2013, Minneapolis, MN, USA. New York: IEEE Press, 2013: 280-283.
[10] Mousavi S S, Firouzmand M, Charmi M, et al. Blood pressure estimation from appropriate and inappropriate PPG signals using a whole-based method[J]. Biomedical Signal Processing and Control, 2019, 47: 196-206.
[11] Byfield R, Miller M, Miles J, et al. Towards robust blood pressure estimation from pulse wave velocity measured by photoplethysmography sensors[J]. IEEE Sensors Journal, 2022, 22(3): 2475-2483.
[12] Koyama S, Ishizawa H, Fujimoto K, et al. Influence of individual differences on the calculation method for FBG-type blood pressure sensors[J]. Sensors, 2016, 17(1): 48.
[13] Haseda Y, Bonefacino J, Tam H Y, et al. Measurement of pulse wave signals and blood pressure by a plastic optical fiber FBG sensor[J]. Sensors, 2019, 19(23): 5088.
[14] Kumar N V, Pant S, Sridhar S, et al. Fiber Bragg grating-based pulse monitoring device for real-time non-invasive blood pressure measurement: a feasibility study[J]. IEEE Sensors Journal, 2021, 21(7): 9179-9185.
[15] Li L Y, Li Y P, Yang L Y, et al. Continuous and accurate blood pressure monitoring based on wearable optical fiber wristband[J]. IEEE Sensors Journal, 2021, 21(3): 3049-3057.
[16] Li L Y, Liu Y F, Song C Y, et al. Wearable alignment-free microfiber-based sensor chip for precise vital signs monitoring and cardiovascular assessment[J]. Advanced Fiber Materials, 2022, 4(3): 475-486.
[17] Pang Y N, Liu B, Liu J, et al. Singlemode-multimode-singlemode optical fiber sensor for accurate blood pressure monitoring[J]. Journal of Lightwave Technology, 2022, 40(13): 4443-4450.
[18] 李玉洁, 罗彬彬, 邹雪, 等. 基于双螺旋微纳光纤耦合器的光学游标传感特性研究[J]. 中国激光, 2023, 50(14): 1406001.
[19] Liu K J, Fan J H, Luo B B, et al. Highly sensitive vibration sensor based on the dispersion turning point microfiber Mach-Zehnder interferometer[J]. Optics Express, 2021, 29(21): 32983-32995.
[20] 范俊豪, 杨祥文, 罗彬彬, 等. 基于色散拐点微纳光纤耦合器的通孔悬臂梁振动传感器[J]. 光学学报, 2022, 42(15): 1528001.
[21] Zhang Z, Pan J, Tang Y, et al. Optical micro/nanofibre embedded soft film enables multifunctional flow sensing in microfluidic chips[J]. Lab on a Chip, 2020, 20(14): 2572-2579.
[22] Liu H T, Song X D, Wang X Y, et al. Optical microfibers for sensing proximity and contact in human-machine interfaces[J]. ACS Applied Materials & Interfaces, 2022, 14(12): 14447-14454.
[23] Leitão C, Antunes P, Pinto J, et al. Optical fiber sensors for central arterial pressure monitoring[J]. Optical and Quantum Electronics, 2016, 48(3): 218.
[24] Castaneda D, Esparza A, Ghamari M, et al. A review on wearable photoplethysmography sensors and their potential future applications in health care[J]. International Journal of Biosensors & Bioelectronics, 2018, 4(4): 195-202.
[25] Huttunen J M J, Kärkkäinen L, Lindholm H. Pulse transit time estimation of aortic pulse wave velocity and blood pressure using machine learning and simulated training data[J]. PLoS Computational Biology, 2019, 15(8): e1007259.
[26] ShahrbabakiS S, AhmedB, PenzelT, et al. Photoplethysmography derivatives and pulse transit time in overnight blood pressure monitoring[C]∥2016 38th Annual International Conference of the IEEE Engineering in Medicine and Biology Society (EMBC), August 16-20, 2016, Orlando, FL, USA. New York: IEEE Press, 2016: 2855-2858.
[27] Smola A J, Schölkopf B. A tutorial on support vector regression[J]. Statistics and Computing, 2004, 14(3): 199-222.
[28] O'Brien E, Mee F, Atkins N, et al. Evaluation of the SpaceLabs 90202 non-invasive ambulatory recorder according to the AAMI Standard and BHS criteria[J]. Journal of Human Hypertension, 1991, 5(3): 223-226.
[29] Xing X M, Sun M S. Optical blood pressure estimation with photoplethysmography and FFT-based neural networks[J]. Biomedical Optics Express, 2016, 7(8): 3007-3020.
[30] Luo H, Yang D Y, Barszczyk A, et al. Smartphone-based blood pressure measurement using transdermal optical imaging technology[J]. Circulation: Cardiovascular Imaging, 2019, 12(8): e008857.
[32] Wang J Y, Liu K W, Sun Q Z, et al. Diaphragm-based optical fiber sensor for pulse wave monitoring and cardiovascular diseases diagnosis[J]. Journal of Biophotonics, 2019, 12(10): e201900084.
[33] Chandrasekhar A, Yavarimanesh M, Natarajan K, et al. PPG sensor contact pressure should be taken into account for cuff-less blood pressure measurement[J]. IEEE Transactions on Bio-Medical Engineering, 2020, 67(11): 3134-3140.
[34] Bennett A, Beiderman Y, Agdarov S, et al. Monitoring of vital bio-signs by analysis of speckle patterns in a fabric-integrated multimode optical fiber sensor[J]. Optics Express, 2020, 28(14): 20830-20844.
Article Outline
邹雪, 范俊豪, 罗彬彬, 周富民, 吴德操, 张祖凡, 赵明富. 基于双通道反射式微纳光纤耦合器膜片的精准连续血压监测[J]. 光学学报, 2024, 44(7): 0728001. Xue Zou, Junhao Fan, Binbin Luo, Fumin Zhou, Decao Wu, Zufan Zhang, Mingfu Zhao. Dual-Channel Reflective Optical Microfiber Coupler Diaphragms for Continuous and Accurate Blood Pressure Monitoring[J]. Acta Optica Sinica, 2024, 44(7): 0728001.
