Investigation of the laser ultrasound propagation in K9 glass using optical interferometry
1. Introduction
Laser ultrasonic technology has been applied more and more in the field of non-destructive testing[1], including thickness gauging[2,3], defect detection, and characterization[46" target="_self" style="display: inline;">–
For high contrast and spatial resolution, many methods have also been developed to generate high amplitude waves in samples. There are two kinds of generation mechanisms in laser ultrasonic technology: the thermo-elastic mechanism and the ablation mechanism. Amplitude of generated acoustic waves is relatively small under the thermo-elastic mechanism, which is difficult for detection. Higher energy generation can increase the amplitude of acoustic waves in samples. The sample would be destructed by erosion and ablation once the laser fluence exceeds the damage threshold of the material[8]. Another way to increase the acoustic wave amplitude is to use an array of lasers[9–
Usually, acoustical signals are detected with the polyvinylidene fluoride (PVDF)/piezoelectric transducer (PZT)[13,14], optical beam deflection[2,15], and a laser vibrometer[16]. However, with these techniques, the motion was recorded pointwise, and a long time was needed to finish the measurement[17,18]. In order to reduce the measurement time, full field measuring methods are preferred, such as thermography[19], optical interferometry[2022" target="_self" style="display: inline;">–
In this paper, a layer of liquid suspended carbon particles (LSCP) was deposited on the sample surface to increase the generated acoustic wave amplitude. The Mach–Zehnder interferometer was used to detect the laser ultrasound propagation in K9 glass. Signals after the ultrasonic wave propagates for different times were obtained by controlling the delay time between the generation and detection laser. In order to determine the waveform of the laser ultrasound, the fast Fourier transform (FFT) analysis and 2D phase unwrapping are applied to extract the phase of the reconstructed interferograms. Combinations of the generation and detection technology presented above provide a method of wave propagation visualization. It can also provide a further understanding of wave–crack interaction for the possibility that cracks could be modulated at a certain state (open or close) by time-controlling wave propagation.
2. Experiments and Methods
The experimental setup for the interferometric investigation of wave propagation is presented in Fig. 1. The Q-switched (Nd:YAG) laser at the wavelength of 1064 nm was utilized to generate acoustic waves on the surface of the K9 glass. Combination of the half-wave plate and the PBS was to flexibly vary attenuation of the generation laser energy without changing the polarization state. The laser beam was focused with an lens, providing a 105 µm spot (diameter) on the glass surface. A layer of LSCP deposited on the upper surface was used not only to increase the amplitude of generated acoustic waves but also to prevent the glass surface from laser damage.

Fig. 1. Experimental setup for Mach–Zehnder interferometer: PBS, polarized beam splitter; BS, beam splitter; LSCP, liquid suspended carbon particles; CCD, CCD camera.
The output of Q-switched Nd:YAG generation laser was frequency-doubled to provide a pulsed laser with wavelength of . The detection laser pulse was expanded and then separated into two beams by a beam splitter (BS). The sample was placed in one arm of the Mach–Zehnder interferometer. The Mach–Zehnder interferometer divided the probe laser into two beams, one passed through the detect area of the K9 glass and the other one was the reference beam. An interferogram image was then focused onto the CCD camera. A bandpass filter () was placed in front of the CCD camera in order to suppress plasma luminescence and increase the signal-to-noise ratio of the interferogram. The ratio of the physical distance scale to the digital image scale of the interferogram image was determined by recording a precision calibration board. The delay time between the generation laser and detection laser was controlled by the DG535 digital delay generator so that interferogram with different delay times after generation can be obtained. The interferogram images on the CCD camera were stored in the computer in real time for further processing.
3. Results and Discussion
3.1. Determination of the interferograms phase distortion
Figure 2(a) shows a typical interferogram image of the ultrasonic wave with a delay of 0.8 µs. The physical size of the images is approximately . The longitudinal wave and transverse wave can be seen from Fig. 2(a). The FFT analysis was performed to extract the phase distortion from the fringe pattern of the interferogram image. The interferogram image is processed by two-dimensional (2D) FFT algorithm. Figure 2(b) shows three distinct peaks, at the DC, and (denoting the carried frequency). One of the is filtered and transformed to a DC, and then an inverse FFT is applied to the image. The complex logarithm of the image is calculated to obtain the phase distribution. The resulting phase, which is wrapped in the interval , is finally applied with a phase unwrapping algorithm using graph cuts[22,23] to obtain continuous phase. The result of phase distortion is shown as a false color image in Fig. 2(c).

Fig. 2. (a) Interferogram image of the laser acoustic wave at delay time 0.8 µs, (b) 2D FFT result, and (c) phase distortion as a false color image.
3.2. Propagation of the laser ultrasonic waves in K9 glass
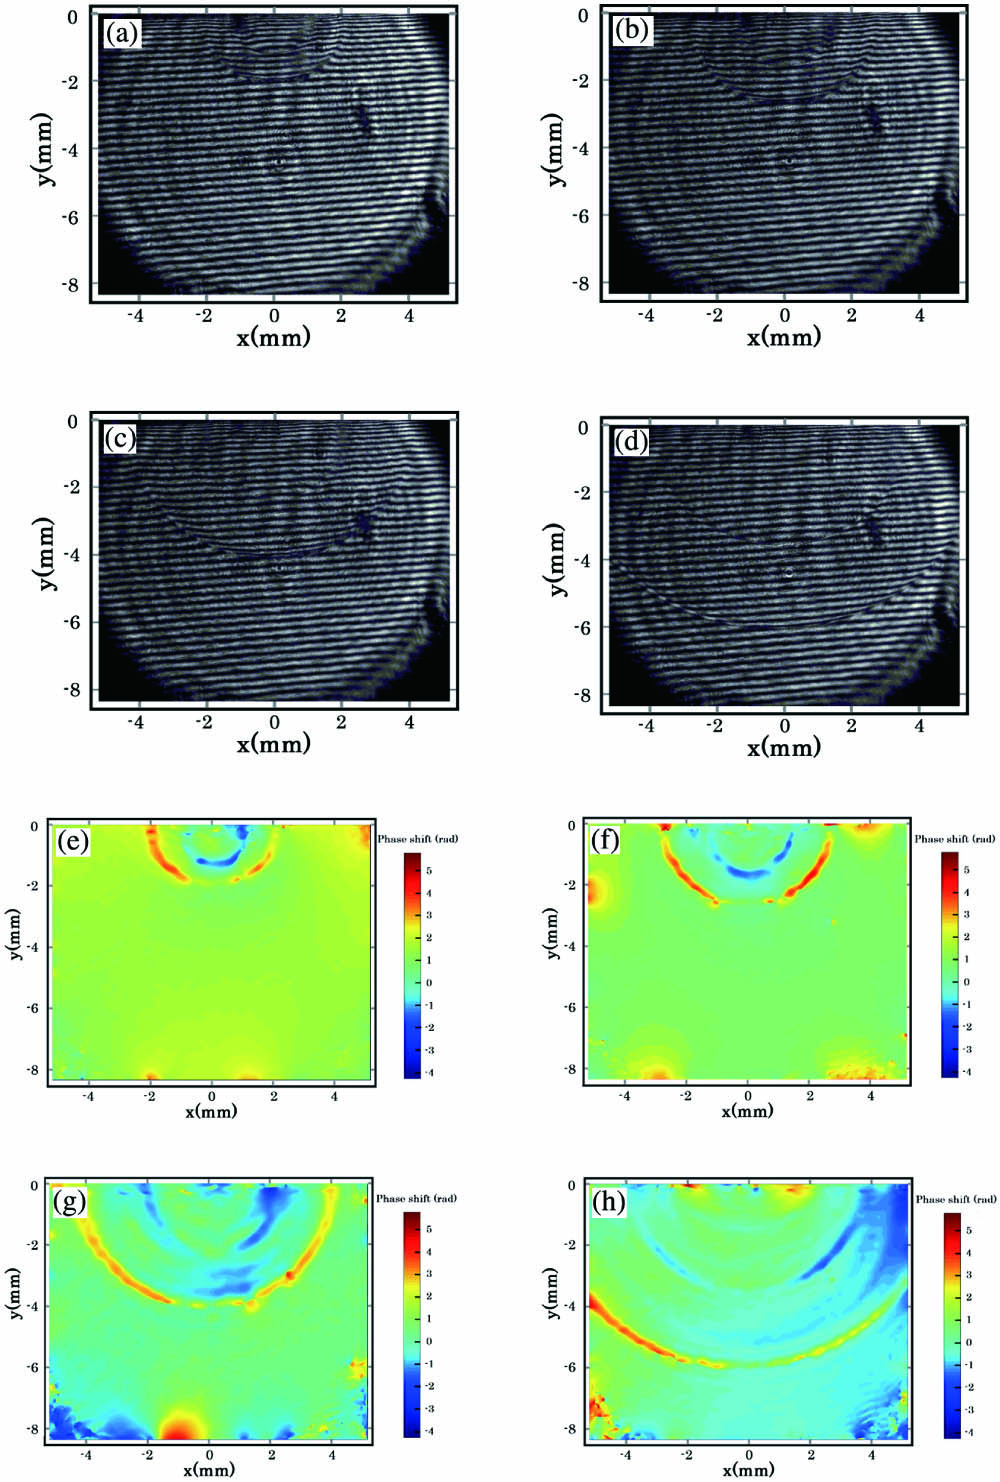
Interferogram images showing the propagation at different delay times of the longitudinal wave and the transverse wave in K9 glass are presented in Figs. 3(a)–3(d). According to the fringe pattern processing method described above, phase distortion images corresponding to the interferogram images are shown in Figs. 3(e)–3(h). A longitudinal wave followed by a transverse wave can be clearly seen from interferogram images and the corresponding phase distortion images. Especially, the propagation direction of the longitudinal wave and the transverse wave at any time can be determined by controlling the delay time between the generation laser and the detection laser. In the case of conventional laser ultrasonic investigations, propagation of the generated acoustic waves cannot be visually observed in the experiment. In order to observe particle motion in the material, displacement of many points distributed on sample surfaces should be recorded for a time series. After that, methods based on B-scan, synthetic aperture focusing technique (SAFT), or other data processing algorithms are adopted to analyze wave propagation characteristics.

Fig. 3. Interferograms and phase distortions of interferograms at different time moments demonstrating the propagation of the longitudinal wave and the transverse wave (a), (e) at 0.4 µs, (b), (f) at 0.6 µs, (c), (g) at 0.8 µs, and (d), (h) at 1.0 µs.
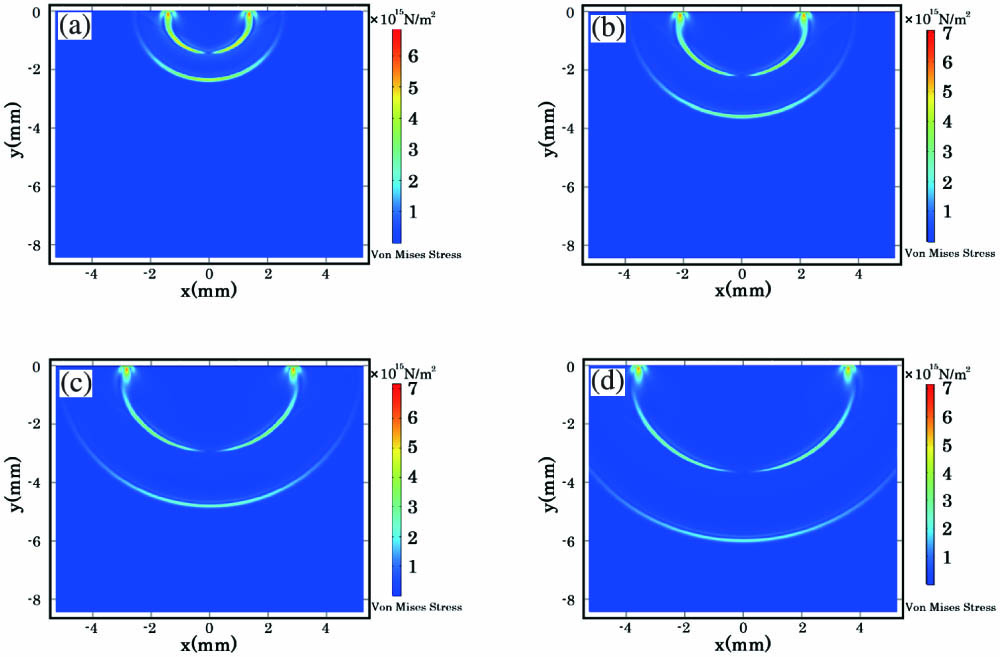
A finite-element method (FEM) based on the COMSOL is utilized for the modeling study. The plane stress condition was adopted for a 2D simulation to model the propagation of the longitudinal wave and transverse wave in the plate. The width and the height of the rectangular plate were set to be 10.41 mm and 8.35 mm, which are the same magnitude as the visual field of the CCD camera in the experiment. The plate has a Poisson’s ratio of 0.208, Young’s modulus of 81.0 GPa, shear modulus of 33.5 GPa, and density of [24]. Waves were generated by a force normal to the upper surface of the plate. Its space and time distribution was written as , where is the peak force density of , is the spatial distribution radius (0.1 mm) of the applied force, and is the characteristic temporal duration (10 ns) of the applied force. Prorogation of the longitudinal wave and the transverse wave at different time moments after their generation is presented in Figs. 4(a)–4(d).

Fig. 4. Simulation results of the laser acoustic wave propagation at various delay times: (a) at 0.4 µs, (b) at 0.6 µs, (c) at 0.8 µs, and (d) at 1.0 µs.
Two dominant profiles, i.e., the longitudinal wave and the transverse wave, can be observed from Figs. 4(a)–4(d). This can also be seen from experimental results shown in Figs. 3(a)–3(d). As a result, the experimental results are in good agreement with the simulation results.
In conclusion, the Mach–Zehnder interferometer was used to detect the propagation of laser-generated acoustic waves. By analyzing the experimental results, it is demonstrated that the optical setup is able to view the acoustic waves. The dynamics of acoustic wave propagation in K9 glass can be clearly seen from the interferogram images. It can not only realize the visualization of bulk waves in the material, but also control and observe the characteristics of wave propagation at a certain position through time delay, which provides us with a more detailed understanding of the features of the acoustic waves.
[1] R. S. Edwards, B. Dutton, A. R. Clough. Interaction of laser generated ultrasonic waves with wedge-shaped samples. Appl. Phys. Lett., 2012, 100: 184102.
[2] D. K. Hsu, A. M. Ayres, G. Meng, G. Ma. Simultaneous determination of ultrasonic velocity, plate thickness and wedge angle using one-sided contact measurements. NDT & E Int., 1994, 27: 75.
[3] R. J. Dewhurst, C. Edwards, A. D. W. McKie, S. B. Palmer. Estimation of the thickness of thin metal sheet using laser generated ultrasound. Appl. Phys. Lett., 1987, 51: 1066.
[4] J. Li, H. Zhang, C. Ni, Z. Shen. Analysis of laser generated ultrasonic wave frequency characteristics induced by a partially closed surface-breaking crack. Appl. Opt., 2013, 52: 4179.
[5] R. S. Edwards, F. Hernandez-Valle, A. R. Clough, M. H. Rosli. Interaction of ultrasonic waves with surface-breaking defects. AIP Conf. Proc., 2015, 1650: 1360.
[6] R. S. Edwards, B. Dutton, A. R. Clough, M. H. Rosli. Scanning laser source and scanning laser detection techniques for different surface crack geometries. AIP Conf. Proc., 2012, 1430: 251.
[7] C. Shan, Y. Zhao, Y. Gao, X. Zhao, G. Hu, W. Ma, J. Shao. Laser-induced defects in optical multilayer coatings by the spatial resolved method. Chin. Opt. Lett., 2019, 17: 031403.
[8] K. L. Telschow, R. J. Conant. Optical and thermal parameter effects on laser-generated ultrasound. J. Acoust. Soc. Amer., 1990, 88: 1494.
[9] J. S. Yang, T. Sanderson, C. Ume, J. Jarzynski. Laser phased array generated ultrasound for nondestructive evaluation of ceramic materials. J. Nondestr. Eval., 1997, 16: 1.
[10] T. W. Murray, J. B. Deaton, J. W. Wagner. Experimental evaluation of enhanced generation of ultrasonic waves using an array of laser sources. Ultrason., 1996, 34: 69.
[11] C. Cosenza, S. Kenderian, B. B. Djordjevic, R. E. Green, A. Pasta. Generation of narrowband antisymmetric lamb waves using a formed laser source in the ablative regime. IEEE Trans. Ultrason. Ferroelectr. Freq. Control, 2007, 54: 147.
[12] P. Karppinen, A. Salmi, P. Moilanen, T. Karppinen, Z. M. Zhao, R. Myllyla, J. Timonen, E. Haeggstrom. Phase-delayed laser diode array allows ultrasonic guided wave mode selection and tuning. J. Appl. Phys., 2013, 113: 144904.
[13] P. C. Beard, A. M. Hurrell, T. N. Mills. Characterization of a polymer film optical fiber hydrophone for use in the range 1 to 20 MHz: a comparison with PVDF needle and membrane hydrophones. IEEE Trans. Ultrason. Ferroelectr. Freq. Control, 2000, 47: 256.
[14] L. Yu, Z. Tian. Lamb wave structural health monitoring using a hybrid PZT-laser vibrometer approach. Struct. Health Monit., 2013, 12: 469.
[15] A. S. Murfin, R. A. J. Soden, D. Hatrick, R. J. Dewhurst. Laser-ultrasound detection systems: a comparative study with Rayleigh waves. Meas. Sci. Technol., 2000, 11: 1208.
[16] W. J. Staszewski, B. C. Lee, R. Traynor. Fatigue crack detection in metallic structures with Lamb waves and 3D laser vibrometry. Meas. Sci. Technol., 2007, 18: 727.
[17] S. Yan, A. M. Lomonosov, B. Han, H. Zhang, Z. Shen, X. Ni. Investigation of wedge waves using digital shearing speckle interferometry. Int. J. Thermophys., 2015, 36: 1074.
[18] B. A. Bard, G. A. Gordon, S. Wu. Laser-modulated phase-stepping digital shearography for quantitative full-field imaging of ultrasonic waves. J. Acoust. Soc. Am., 1998, 103: 3327.
[19] S. E. Burrows, A. Rashed, D. P. Almond, S. Dixon. Combined laser spot imaging thermography and ultrasonic measurements for crack detection. Nondestr. Test Eval., 2007, 22: 217.
[20] X. Wang, L. Feng, P. Chen, Z. Huang, Y. Yuan. Micro displacement reconstruction of self-mixing grating interferometer based on Littrow structure. Chin. Opt. Lett., 2021, 19: 101402.
[21] C. He, C. Zhou, Q. Zhou, S. Xie, M. Xiao, J. Tian, Y. Yao. Simultaneous measurement of strain and temperature using Fabry–Perot interferometry and antiresonant mechanism in a hollow-core fiber. Chin. Opt. Lett., 2021, 19: 041201.
[22] H. Zhang, J. Lu, Z. Shen, X. Ni. Investigation of laser induced plasma in air using optical interferometry. Opt. Commun., 2009, 282: 1720.
[24] B. Wang, Y. Qin, X. Ni, Z. Shen, J. Lu. Effect of defects on long-pulse laser-induced damage of two kinds of optical thin films. Appl. Opt., 2010, 49: 5537.
Article Outline
Mengmeng Li, Hongchao Zhang, Jian Lu, Zhonghua Shen. Investigation of the laser ultrasound propagation in K9 glass using optical interferometry[J]. Chinese Optics Letters, 2022, 20(2): 021203.


