基于正交双波长测量的有核细胞三维形态重建  下载: 747次
Cells are the basic units of biomass, and their morphological structures are often associated with the functional state of biomass. Therefore, the morphology of a cell is an important research topic in life science and a critical factor in clinical medical diagnosis. Quantitative phase imaging technology, as a powerful nondestructive and label-free imaging tool, provides various biological and physical properties for the quantitative evaluation of cells. Although the phase diagram of the sample provided by this technology contains information about its internal structure, the thickness and refractive index of the sample is coupled with the phase data. Decoupling the phase data is required to reconstruct a three-dimensional (3D) morphology of the sample. Dual-wavelength imaging technology is effective for single medium samples. However, this method does not work for multimedia phase objects. In response to this shortage, this study proposes a new reconstruction method based on orthogonal dual-wavelength measurements.
The 3D reconstruction method is based on three phase images from two orthogonal directions. Two of these phase images are obtained with two different wavelengths. The first step is to separate the phase shift due to different substructures. Given that the environmental liquid is a highly dispersive material relative to the cell sample, the refractive index (RI) of the environmental liquid correspondingly changes under different incident light, whereas the RI of the sample remains constant. Thus, by subtracting the two images at two different wavelengths, the physical thickness of the media adjacent to the environment (such as cytoplasm) can be determined. Next, the average RI of the cytoplasm can be extracted using the associated phase value distribution, while phase shifts due to cytoplasm and nucleus are also separated immediately. Following that, the thickness information of the nucleus for the incidence along the two directions can be obtained using a phase diagram from the orthogonal direction. Thus, the RI of the nucleus can be calculated from the nuclear phase value. The relative position of the cytoplasm and nucleus can also be determined using two orthogonal phase diagrams. The 3D morphology of the multimedia phase object is obtained by combining the physical thickness distributions of the cytoplasm and nucleus.
The reconstructions of models with different structural characteristics are explored, including a cell with a single spherical nucleus (Fig. 2), a cell with a single saddle shape nucleus [Fig. 5(a)], and a binuclear cell with a double spherical nucleus [Fig. 6(a)]. The results of these samples [Figs. 9, 11(c), and 12(e)] are consistent with the initial model. Especially, the analytic method provides a sharp reconstruction result of the physical thickness of the cytoplasm and the entire reconstruction process takes a short time (Tables 1, 2, and 3). This study suggests the feasibility of this reconstruction method, but the actual application effect depends on many factors, such as image noise, heterogeneity of RI distribution, and calculation error in edge detection. An emphasis of the following study is to explore an efficient reconstruction algorithm suitable for experiments.
This study proposes a 3D morphological reconstruction method for nucleated cells based on orthogonal dual-wavelength phase images. This method requires three phase images from two orthogonal directions and is divided into two steps. First, using the high dispersion characteristics of environmental liquid and edge detection, the phases of the cytoplasm and nucleus are separated based on the independence and superposition of phase data, and the thickness of the cytoplasm is decoupled simultaneously. Then, the 3D morphology of the sample is reconstructed using another orthogonal phase diagram, RI and thickness information of the coupling nucleus, and the relative position relationship of the substructure expressed by two mutually orthogonal phase diagrams. This method collects sample information from two directions simultaneously. A small amount of data means convenient data acquisition and fast data processing. The simulation results show that the algorithm, which may provide a reference for real-time imaging of biological cells, is effective.
1 引言
细胞是生命体最基本的结构和功能单元,其细胞形态结构与生命体状态直接相关,在生命科学研究和临床检验应用中有重要意义[1]。由于生物细胞在可见光波段中的吸收率和对比度较低,目前的成像方法往往需要对样品进行外源性的标记以提高成像的对比度和特异性[2]。但标记过程不仅增加了人工成本,也对生物样本造成了破坏。为了简化样本制备过程、减少对待测物体的干扰,无标记光学成像成为生物医学光学成像研究中的热点之一[3]。定量相位成像(QPI)技术[4-5]可以在生物样本原态下对其进行观察研究,是一种强大的、无标记的“薄”生物样本二维成像方法。但是QPI技术测量的是样品引起的光程差,折射率与厚度信息耦合在相位数据中,样本的三维形态信息无法得到直接展示。因此,多种不同的解耦技术被提出,其中双波长测量法因操作相对简单而受到很多关注[6]。该方法使用不同的波长入射,为每个空间位置生成两个带有两个未知数的方程,从而实现折射率与厚度的解耦。例如Jafarfard等[7]使用乙二醇(C2H6O2)作为环境液,以直径为10 μm的球形二氧化硅珠作为样本,当照射波长从532 nm改为632 nm时,环境液的折射率相差0.019,忽略不同波长下样本的折射率变化,进而解耦得到二氧化硅珠的厚度和折射率。考虑到乙二醇溶液对细胞的毒性,Boss等[8]提出以FCF溶液替代乙二醇溶液,该溶液具有高度色散性,更适合动态研究。但因为细胞本身的折射率变化与环境液相比可忽略不计,上述双波长技术仅适用于单一介质样本,尚不能将具有亚结构的多介质相位体(例如有核细胞)的内部结构表达出来。针对这一不足,本文在双波长测量法的基础上,结合边缘提取和正交成像,提出了一种快速分离样本亚结构相位信息,进而反演相位体三维形态的方法,以期为细胞结构研究提供一定的参考。
2 双波长测量下的样品亚结构相位分离
在人外周血细胞中,单核细胞、淋巴细胞等白细胞的变形运动较为活跃,其形态变化对临床医学研究有重要意义,比如各种病毒感染、局部贫血、白血病、视网膜病变等都可以从白细胞的形态变化中得知[9]。本文以单核细胞为例建立相位体模型,探究从相位数据中快速解耦物理厚度等形态信息的方法。以
假设环境液的折射率为n0,细胞质的折射率为n1,细胞核的折射率为n2。细胞质和细胞核沿Z轴方向的厚度分别为h1、h2。波长为λ的平行光沿Z轴方向照射,细胞引起的相移可表示为
根据样本相位分布的特点,在不含细胞核的区域(该区域可通过边缘检测划分提取)任选一点(x0,y0),该点的相位只由细胞质引起,与细胞核无关,故可以表示为
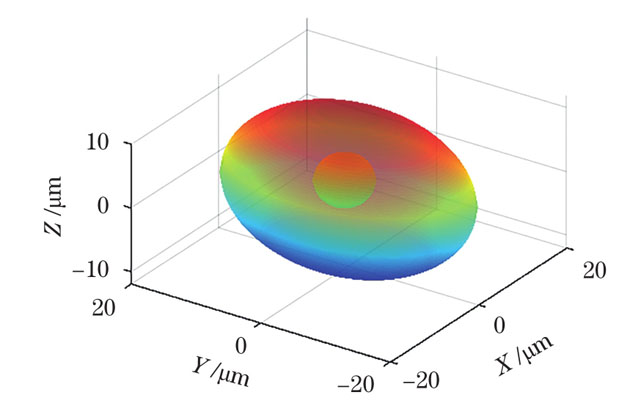
下面以几个具有不同结构特征的细胞模型为例来说明该相位分离方法的效果。首先对于单核细胞模型,由于其细胞体通常呈球形或椭球形,细胞核的形态变化较大,通常呈球形、马蹄形、肾形或不规则形状[10],故用椭球模拟细胞质(X轴、Y轴、Z轴半径分别为12、18、12 μm),以半径为4 μm的球体表示细胞核,细胞质和细胞核的中心坐标分别为(0,0,0)和(2,2,2),其三维形态如

图 3. 球形胞核的单核细胞模型的相位分布。(a)沿Z方向入射的相位图(λ1=632.8 nm); (b)沿Z方向入射的相位图(λ2=532 nm);(c)图3 (a)的梯度图
Fig. 3. Phase distributions of monocyte with spherical nucleus. (a) Phase diagram for incidence along Z direction (λ1=632.8 nm); (b) phase diagram for incidence along Z direction (λ2=532 nm); (c) gradient diagram of Fig. 3 (a)
结合相位图的物理意义和前期实验工作[13],对相位图进行梯度处理以获得样本结构的边缘数据。

图 4. 相位分离结果。(a)细胞质相位;(b)细胞核相位
Fig. 4. Phase separation results. (a) Cytoplasmic phase; (b) nucleus phase
上述分离相位的过程仅涉及两幅相同方向的相位图,并未对亚结构形态或其平均折射率加以限定,也就是说适用于任意形态的样本。为了验证说明这一点,本文以单核细胞的另一形态为原型,建立了

图 5. 马蹄形胞核的单核细胞的亚结构相位分离。(a)细胞三维模型;(b)球形细胞质相位;(c)马蹄形细胞核相位
Fig. 5. Substructure phase separation of monocyte with horseshoe-shaped nucleus. (a) Three-dimensional model of cell; (b) spherical cytoplasmic phase; (c) horseshoe-shaped nucleus phase
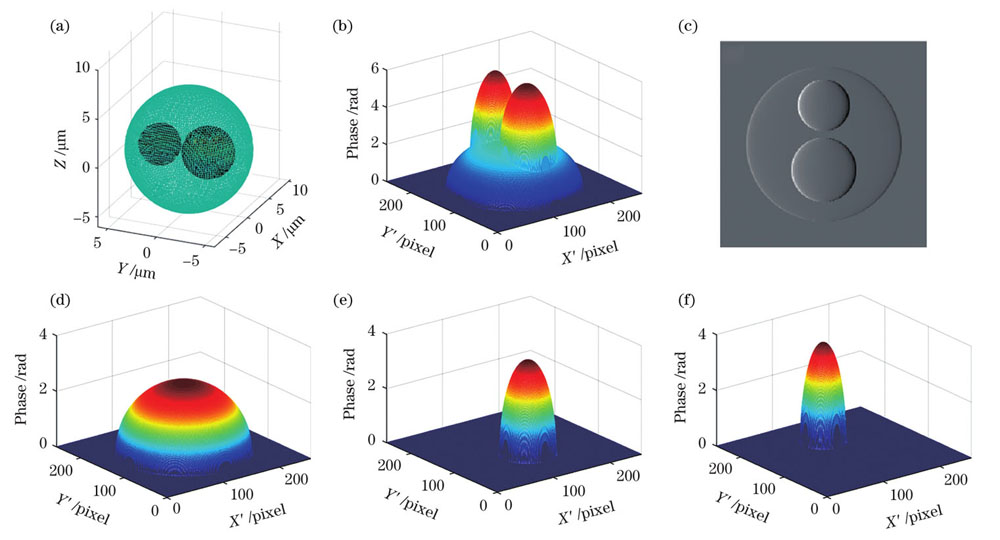
对于结构更加复杂的样本,如嗜酸性粒细胞,通常有两个细胞核。对于这类多介质相位体,本文也建立了相应的模型以考察该相位分离方法的可行性。由于前面已经论证过上述计算对样本物理形状的普适性,此处着重验证其在更复杂折射率分布情形下的效果,均用球形模拟不同的亚结构,其中细胞质半径为4 μm,细胞核的半径分别为2.5 μm和2 μm,细胞质和两个细胞核的中心坐标分别为(0,0,0)、(0,-2,0)和(0,3,0),其三维形态如

图 6. 嗜酸性粒细胞模型。(a)三维模型;(b)沿Z方向入射的相位图;(c)梯度图;(d)细胞质相位;(e)较大细胞核相位;(f)较小细胞核相位
Fig. 6. Eosinophil model. (a) Three-dimensional model; (b) phase diagram for incidence along Z direction; (c) gradient map; (d) cytoplasmic phase; (e) larger nucleus phase; (f) smaller nucleus phase
当入射光沿Z轴方向照射时,得到的相位图及其相应的梯度分布分别如
上述单独分离出来的亚结构相位尚不能直接反映样本形态,但其可为后续形态重建提供数据支持,还可以用于一些微结构动态分析,例如核的形态分叶或细胞局部离子浓度变化的表征[14]。同时,值得注意的是,上述数据处理过程基于一个前提,即样本亚结构在入射光方向上没有相互遮挡,否则整体相位图中两个细胞核引起的相位可能叠加在一起。例如,若入射光沿Y轴方向照射,相位分布如

图 7. 另一方向入射下的嗜酸性粒细胞模型的相位分布。(a)沿Y方向入射的相位图;(b)细胞质相位;(c)两个细胞核相位
Fig. 7. Phase distributions of eosinophil model for incidence along the other direction. (a) Phase diagram for incidence along Y direction; (b) cytoplasmic phase; (c) phase of two nucleuses
3 基于正交相位分布的样品三维形态重建
本节仍以

图 8. 正交入射下的单核细胞模型的相位分布(λ1=632.8 nm)。(a)沿Z方向入射的相位图;(b)沿Y方向入射的相位图;(c)图8 (b)的梯度图
Fig. 8. Phase distributions of monocyte model at orthogonal incidence (λ1=632.8 nm). (a) Phase diagram for incidence along Z direction; (b) phase diagram for incidence along Y direction; (c) gradient diagram of Fig. 8 (b)
相位分布可以有效表示细胞在入射光方向的位置以及轮廓信息,根据
表 1. 球形胞核的单核细胞模型的形态重建结果
Table 1. Morphological reconstruction results of monocyte model with spherical nucleus
| ||||||||||||||||||||||||
表 2. 马蹄形胞核的单核细胞模型的形态重建结果
Table 2. Morphological reconstruction results of monocyte model with horseshoe-shaped nucleus
| ||||||||||||||||||||||||
表 3. 双核的嗜酸性粒细胞模型的形态重建结果
Table 3. Morphological reconstruction results of binuclear eosinophil model
| ||||||||||||||||||||||||||||||||||

图 9. 球形胞核的单核细胞模型的三维重建形态
Fig. 9. Three-dimensional reconstruction morphology of monocyte model with spherical nucleus
为了定量考察该算法的效果,本文对比了计算结果和模型的几个特征参数,如

图 10. 正交双波长测量法重建相位体三维形态流程图
Fig. 10. Flow chart for reconstructing three-dimensional morphology of phase volume by orthogonal dual wavelength measurement method
最后,为了考察该方法的普适性,本文以形态结构特征不同的样本模型为例进行了验证。对于只有一个细胞核的样本,仍以

图 11. 马蹄形胞核的单核细胞模型的形态重建。(a)正交方向的相位图(λ1=632.8 nm); (b)重建的三维形态
Fig. 11. Morphological reconstruction of monocyte model with horseshoe-shaped nucleus. (a) Phase diagram in orthogonal direction (λ1=632.8 nm); (b) reconstructed three-dimensional morphology
对于含有多个细胞核的样本,为了解决第2节中单方向入射时细胞核的相互遮挡使得细胞核相位无法解耦的问题,增加了一束正交方向的入射光。仍以

图 12. 正交双波长入射下的嗜酸性粒细胞模型。(a)沿Z方向入射的相位图;(b)沿Y方向入射的相位图;(c)图12 (b)的梯度图;(d) 重建的三维形态
Fig. 12. Eosinophil model under orthogonal dual-wavelength incidence. (a) Phase diagram for incidence along Z direction; (b) phase diagram for incidence along Y direction; (c) gradient diagram of Fig.12(b); (d) reconstructed three-dimensional morphology
4 结论
提出了一种基于正交双波长相位图像的有核细胞三维形态重建方法。该方法仅需要从两个方向采集三幅相位图,数据量小,同时可避免样本亚结构相互遮挡引起的相位重叠问题,对样本位置姿态及其亚结构形态无限制要求。仿真结果证明了该算法的有效性,其重建速度快,可满足实时检测要求。同时也注意到,在实际应用中,由于生物细胞等真实样本的折射率并不是理想均匀分布的,在上述反演计算中需要用平均折射率来进行简化替代,这就会丢失一部分亚结构细节,从而影响重建结果的分辨率。除了算法的计算过程外,重建的误差更多来源于数据噪声、相位恢复的误差、边缘检测的误差等,每一个环节都需探索降低误差的方法。例如我们在前期工作中曾着重探究过边缘提取的采样策略[13],如何基于实验快速获得高精度、高分辨率的重建结果是我们今后研究工作的重点。此外,对于具有更加复杂亚结构的细胞,例如细胞核数目较多的中性粒细胞,在两束入射光下可能会出现细胞核相位重叠的现象。对于上述问题,可以从光路设计方面着手优化并探究相应的重建算法。
[1] Cacace T, Bianco V, Ferraro P. Quantitative phase imaging trends in biomedical applications[J]. Optics and Lasers in Engineering, 2020, 135: 106188.
[2] Mehta D S. Quantitative phase optical microscopic techniques for biomedical imaging and diagnostic applications[J]. Proceedings of the National Academy of Sciences, India Section A: Physical Sciences, 2018, 88(3): 437-451.
[3] Li Y F, Fanous M J, Kilian K A, et al. Author Correction: quantitative phase imaging reveals matrix stiffness-dependent growth and migration of cancer cells[J]. Scientific Reports, 2020, 10: 19025.
[4] 杨泽文, 张璐, 吕宁, 等. 生物折射率三维无标记定量成像研究进展[J]. 中国激光, 2022, 49(5): 0507201.
[5] 穆书奇, 董大山, 施可彬. 无标记光学成像技术[J]. 激光与光电子学进展, 2022, 59(12): 1200001.
[6] Xu X Q, Wang Y W, Xu Y Y, et al. Dual-wavelength in-line phase-shifting interferometry based on two dc-term-suppressed intensities with a special phase shift for quantitative phase extraction[J]. Optics Letters, 2016, 41(11): 2430-2433.
[7] Jafarfard M R, Moon S, Tayebi B, et al. Dual-wavelength diffraction phase microscopy for simultaneous measurement of refractive index and thickness[J]. Optics Letters, 2014, 39(10): 2908-2911.
[8] Boss D, Kühn J, Jourdain P, et al. Measurement of absolute cell volume, osmotic membrane water permeability, and refractive index of transmembrane water and solute flux by digital holographic microscopy[J]. Journal of Biomedical Optics, 2013, 18(3): 036007.
[9] 韩豪. 非正交相位成像下的血细胞相位恢复及三维形态重建技术研究[D]. 镇江:江苏大学,2021.
HanH. Phase retrieval method and 3D morphological reconstruction technology of blood cells based on non-orthogonal phase imaging[D]. Zhenjiang: Jiangsu University, 2021.
[10] Wang Y W, Chen Y J, Lu C H, et al. Phase features of several typical blood cells and their identification without unwrapping[J]. Optica Applicata, 2013, 43(3): 505-514.
[11] Tang W B, Ji Y, Zhang M M, et al. A rapid detection method for morphological characteristics of biological cells based on phase imaging[J]. BioMed Research International, 2018, 2018: 4651639.
[12] Li X C, Liu L H, Zhao J M, et al. Optical properties of sodium chloride solution within the spectral range from 300 to 2500 nm at room temperature[J]. Applied Spectroscopy, 2015, 69(5): 635-640.
[13] 张明明. 基于光相位边缘特征提取的生物细胞形态及动态活动快速检测实验研究[D]. 镇江:江苏大学,2019.
ZhangM M. Experimental analysis of biological cell morphological rapid detection based on edge extraction of optical phase information[D]. Zhenjiang: Jiangsu University, 2019.
[14] Ji Y, Fu S, Zhang M M, et al. Characterization of the solution concentration variation in microstructure by phase imaging[J]. Journal of Modern Optics, 2020, 67(5): 454-461.
[15] Han H, Xu Y Y, Liao J R, et al. Real-time measurement of three-dimensional morphology of blood cells in batches by non-orthogonal phase imaging[J]. Optics and Lasers in Engineering, 2020, 134: 106303.
[16] Habaza M, Gilboa B, Roichman Y, et al. Tomographic phase microscopy with 180° rotation of live cells in suspension by holographic optical tweezers[J]. Optics Letters, 2015, 40(8): 1881-1884.
[17] 梁言生, 姚保利, 雷铭. 全息光镊在生物学研究中的应用[J]. 中国激光, 2020, 47(2): 0207020.
Article Outline
龚凌冉, 贾希宇, 徐媛媛, 王亚伟, 季颖. 基于正交双波长测量的有核细胞三维形态重建[J]. 中国激光, 2022, 49(20): 2007206. Lingran Gong, Xiyu Jia, Yuanyuan Xu, Yawei Wang, Ying Ji. Three-Dimensional Morphological Reconstruction of Nucleated Cell Based on Orthogonal Dual-Wavelength Measurement[J]. Chinese Journal of Lasers, 2022, 49(20): 2007206.


