核孔复合物单分子定位超分辨图像的筛选和重构
The nuclear pore complex (NPC) is an intricate structure comprising multiple distinct nuclear pore proteins known as nucleoporins (Nups). It plays a crucial role in the transformation of matter and information between the nucleus and cytoplasm. With a total molecular weight of 110‒125 MDa, the NPC is hailed as the "holy grail" of structural biology. Scientists have used such techniques as electron microscopy, atomic force microscopy, and cryoelectron microscopy to collectively reveal the composition, assembly, and ultrastructure of the NPC, providing a solid structural foundation for further exploration of its functions. The diameter of the NPC is approximately 130 nm. Therefore, single-molecule localization microscopy (SMLM) with an imaging resolution of 20 nm is an ideal tool for studying the ultrastructure of NPC. However, during long-term imaging, data loss may occur because of sparse blinking, and the dynamic activities of life also lead to heterogeneity in imaging results, posing challenges for data analysis. To address these issues, corresponding image reconstruction methods must be developed. Clustering algorithms are powerful tools for quantitative extraction, classification, and analysis of SMLM data. The unique clustered distribution structure of the NPC makes clustering methods highly suitable for structural analysis of the NPC. Therefore, to compensate for the limitations of SMLM data and obtain more detailed structural information about the NPC, a processing procedure for SMLM images of the NPC was developed in this study based on clustering algorithms. It involves screening out NPC structures with a more uniform morphology, followed by subjecting these structures to high-throughput statistical analysis and reconstruction.
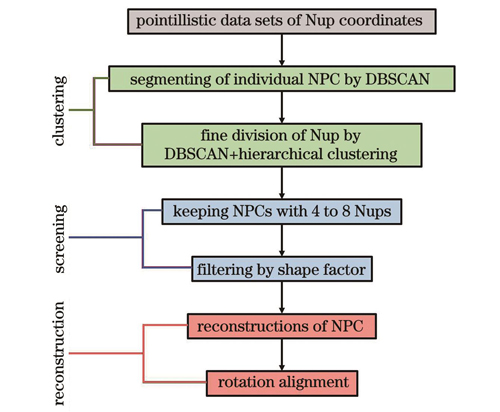
After PFA fixation, permeabilization with a blocking buffer, and labeling with antibodies (Nup133 and Nup98), U2OS cells were imaged by a self-built SMLM imaging system. A total of 50000 frames were captured after appropriate fields of view were selected. Through localization and drift correction processes, corresponding SMLM images were obtained. After the regions of interest were selected, the coordinate data with high localization accuracy were preserved for further analysis. First, a first round of density-based spatial clustering of applications with noise clustering (DBSCAN) analysis was used to remove background noise, identify individual NPCs, and determine the centroids of the NPCs (Fig. 3). To achieve a more accurate delineation of each Nup within every NPC in the case of retaining all signal points, a combination of the DBSCAN algorithm and hierarchical clustering was employed in the second round of delineation. In the second round of DBSCAN analysis, the algorithm was applied to identify the number of individual Nups within each NPC, and the data were further input into a hierarchical clustering algorithm for refinement of Nup localization. Subsequently, NPCs containing four to eight Nups were retained, and a second screening based on shape factors was performed to preserve NPCs with more uniform morphologies. Finally, the centroids of all remaining NPCs were aligned to obtain the complete distribution of labeled Nups in the NPCs. Using the least-squares method with NPC centroids as the center, a reconstruction of the Nup distribution with octagonal symmetry was achieved (Fig. 4). The reconstructed structure can be used to analyze the spatial characteristics of the Nup.
Nup133, as a characteristic "Y"-scaffold-shaped component protein, has received extensive attention in recent research. Through statistical analysis of multiple datasets, the first round of the DBSCAN algorithm identified 10329 NPCs (Fig. 5). Among them, 3076 NPCs containing four to eight Nup133 were present, accounting for approximately 30% of the total. By selecting based on shape factors, a final set of 558 NPCs with relatively regular shape was obtained, accounting for approximately 5% of the total (Table 1). The retained NPCs were aligned by their centroids, resulting in an overlapped NPC image. Gaussian fitting was applied to calculate the radii of all Nup133, with the peak corresponding to a horizontal coordinate of (58.4±0.1) nm. This value is very close to the Nup133 radius of (59.4±0.2) nm calculated using the particle averaging method with antibody labeling. This further demonstrates the high-precision performance of the screening and reconstruction methods used in this study. In addition, the same analysis process was applied to analyze NPCs labeled with Nup98. Compared with that of Nup133, the distribution of Nup98 located in the inner ring of the NPC is more condensed (Fig. 6). A total of 10668 NPCs were analyzed, and 1126 NPCs were ultimately retained, accounting for approximately 10% of the total (Table 1). Similarly, the remaining NPCs labeled with Nup98 were aligned by the centroids, and Gaussian fitting was applied to the overlapped Nup98, resulting in a peak corresponding to a horizontal coordinate of (39.7±0.2) nm (Fig. 6). Compared with that of Nup133, the radius of Nup98 is smaller by 18.7 nm, indicating that Nup98 is closer to the center position of the NPC than Nup133. Finally, the eightfold symmetric structure of Nup133 and Nup98 was successfully reconstructed using the rotation alignment method, which is consistent with the acknowledged model.
The present study proposes a processing workflow based on clustering methods for screening and reconstruction of SMLM images of the NPC. The workflow has three main parts: classification, screening, and reconstruction. By performing two rounds of clustering to identify the NPC and Nup components, NPCs with a uniform shape containing four to eight Nups are selected and subjected to reconstruction analysis. The NPC with an eightfold symmetric structure is successfully reconstructed using the proposed workflow. Experimental results on Nup133 and Nup98 show that the radius of Nup133 is (58.4±0.1) nm, which closely aligns with the radius determined by the particle averaging method. The radius of Nup98 is (39.7±0.2) nm, indicating that Nup98 is situated in closer proximity to the central region of the nuclear pore. The proposed method reproduces the eightfold symmetric structure of the NPC, providing accurate localization information and aiding in a deeper understanding of the composition of this important structure. This clustering-based reconstruction method can also be extended to other nuclear pore-like structures, such as centrioles and basal bodies, or other structures with isotropic symmetric features, offering important strategies and methods for deciphering complex biological structures.
1 引言
核孔复合物(NPC)是细胞结构中最复杂的生命结构之一,是由30多种不同类型的核孔蛋白(Nup)组成的总分子质量高达110~125 MDa(1 Da=1 u)的超大复合物[1-3],一直被认为是结构生物学的“圣杯”。NPC在细胞的生命活动中扮演着举足轻重的角色,充当着细胞核与胞质之间的通道,调控着RNA、蛋白质等生物分子的运输和交流[4-5]。准确解析NPC的结构对于深入理解细胞核功能以及许多重要生命过程的机制至关重要。早在20世纪,科学家们使用电子显微镜[6-7]和原子力显微镜[8]就已经发现了NPC的八重对称结构。最近,研究人员通过冷冻电镜[9-13]揭示了NPC的组成、组装以及基本结构,为后续深入探索NPC的功能和作用打下了坚实的结构基础。
单分子定位超分辨显微(SMLM)技术是一种能够特异性标记目标蛋白并具有超高分辨率的光学成像技术[14-16],有效弥补了电子显微镜在原位成像研究中的不足,已被广泛应用于复杂生物结构的解析。近年来,科学家利用SMLM技术成功解析了黏着斑[17]、伪足小体[18]和出芽酵母菌着丝点[19]等复杂结构。NPC的直径约为130 nm[20],20 nm成像分辨率的单分子定位超分辨显微镜是研究其结构的理想工具。然而,在长时间成像过程中,可能会出现由稀疏闪烁导致的数据缺失以及动态生命活动造成的成像结果的异质性,给数据分析带来了一定困难。为解决这个问题,图像重建算法应运而生。Szymborska等[21]利用粒子平均法分析核孔的SMLM图像,并通过像素图像的分割、对齐和筛选,成功重建了Nup107-160亚复合体结构上Nup的形貌,揭示了它们在NPC中的排列方式,为争议许久的排列提供了新的证据。此后,研究人员进一步发展了改进后的平均算法,实现了目标蛋白的三维重建[22-23]。值得一提的是,SMLM数据含有丰富的定位坐标,Curd等[24]通过分析SMLM数据的相对位置分布,成功拟合出Nup107的超微结构。这些研究表明,发展新的基于坐标的分析方法可以保留高精度的定位信息,从而可以获取更准确、更详细的信息。
聚类算法是一种强大的工具,用于定量描述和分析SMLM数据,可以对SMLM数据进行提取、分类和解释。常见的聚类算法包括根据密度进行分类的DBSCAN(Density-Based Spatial Clustering of Applications with Noise)算法[25]、根据邻近位点的角度进行分类的CDC(Clustering algorithm using the local Direction Centrality)算法[26]、根据空间分布进行划分的泰森多边形聚类算法[27],以及根据样本点之间的距离进行划分的K-means算法[28]和层级聚类算法[29]等。目前,这些聚类方法主要被用于分析膜蛋白纳米簇[30-31]以及两种蛋白的共定位程度[32-34],尚未见到将其应用于亚细胞结构重建的公开报道。NPC具有独特的簇状分布结构特点,这使得聚类方法非常适合用于对NPC的结构进行解析。鉴于此,笔者开发了一套结合多种聚类算法对NPC的SMLM数据进行分析的流程。该流程旨在筛选出缺失较少且形貌较为均匀的NPC,并对这些NPC进行高通量的统计分析和重建处理,弥补超分辨数据的缺失,揭示NPC更加精细的结构信息。
2 原理与方法
2.1 U2OS的NPC成像
将U2OS细胞从培养箱中取出,对其进行多聚甲醛固定、封闭液(含有0.1% Triton X-100和3% BSA的PBS溶液)渗透、抗体(Nup133以及Nup98)孵育后,加入成像缓冲液封片准备进行超分辨成像。制备好的样品安装在自主搭建的SMLM成像系统的载物台上[35],选择合适的视野采集50000帧图像,对采集的图像进行定位和校正后得到NPC的SMLM图像。
2.2 DBSCAN算法和层次聚类算法的原理
DBSCAN算法[25]的原理如

图 1. DBSCAN和层次聚类的原理示意图。(a)DBSCAN算法;(b)层次聚类算法
Fig. 1. Principles of DBSCAN and hierarchical clustering. (a) DBSCAN; (b) hierarchical clustering
层次聚类算法[29]的原理如
2.3 NPC数据处理流程
笔者基于目前常用的聚类方法,发展了一种对NPC超分辨图像进行筛选与重构的流程,如
3 结果与讨论
3.1 NPC的筛选
NPC的SMLM图像可能会因为抗体标记不全或者核孔受到挤压等而不完整或者发生变形,这些因素会引入误差,影响对NPC数据的定量分析。因此,在NPC数据处理的第一步,需要对超分辨数据进行筛选。
笔者模拟了具有一定缺失以及形状扰动的八重对称NPC结构[如
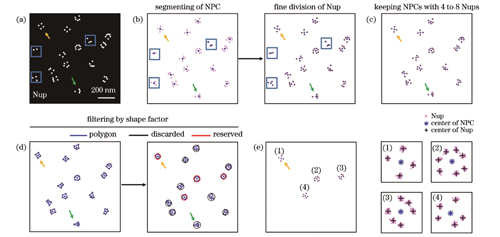
图 3. NPC的筛选。(a)模拟的NPC分布图;(b)NPC的分割以及Nup的分割;(c)保留含有4~8个Nup的NPC;(d)根据轮廓多边形的形状因子筛选NPC;(e)满足筛选条件的NPC
Fig. 3. Screening of NPC. (a) Simulated distribution map of NPCs; (b) segmentation of NPCs and fine division of Nups; (c) keeping NPCs with 4 to 8 Nups; (d) filtering NPCs by shape factor of outline polygons; (e) finally selected NPCs that meet the screening criteria
首先去除少于4个Nup的NPC[如
在理想无缺失以及无变形情况下,每个NPC应有8个Nup,其轮廓多边形是对角线长为2a的正八边形,面积为
高于所设定面积阈值的被舍弃的NPC用黑色圆圈标记,而低于面积阈值的被保留的NPC用红色圆圈标记,如
3.2 NPC八重对称结构重构
第一次应用DBSCAN所划分的簇代表整个NPC,其质心代表NPC最中间的位置,第二次应用DBSCAN并结合层次划分出Nup小簇,其质心位置为Nup位点(center of Nup)。
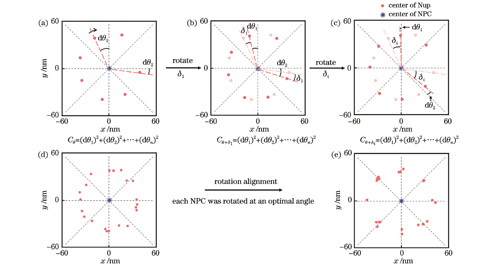
图 4. NPC的重构。(a)~(c)含有7个Nup的NPC以构建的标准方位旋转的示意图:(a)初始状态;(b)从初始状态开始以NPC质心为圆心顺时针旋转
Fig. 4. Reconstruction of NPC. (a)‒(c) A schematic diagram depicting a standard orientation rotation of an NPC composed of 7 Nups: (a) initial state; (b) clockwise rotation
之后将Nup以坐标原点为中心顺时针旋转
以
将3.1节中筛选出的所有NPC的质心重合并置于坐标原点,即可得到所有Nup相对于NPC质心的分布[如
其中,
通过叠加数百个经筛选后的NPC,可以获得精度较高的Nup的半径统计结果。之后根据已设定的标准结构,按照每个NPC的最佳角度旋转,即可复现出八重对称的NPC分布,如
至此,确定了核孔超分辨图像的处理流程,包括划分、筛选以及重构三部分。该流程可以保留形状较为均一的NPC,选取这些NPC进行重构分析可以减小统计误差,得到较为准确的形貌信息。
3.3 在实验数据中的应用
选取了两种代表性核孔蛋白Nup133和Nup98进行分析,其中Nup133作为特征性“Y”形结构的组分蛋白被广泛研究[37]。
通过SMLM对U2OS细胞样本的Nup133进行标记[如
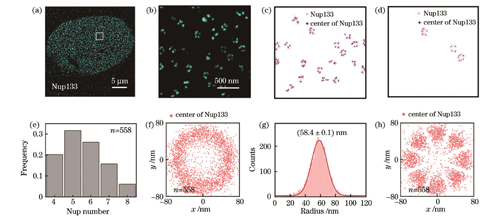
图 5. Nup133 SMLM图像的重构分析。(a)(b)U2OS细胞中Nup133的代表性SMLM图像及其局部放大图;(c)初筛后保留下来的含有4~8个Nup133的NPC;(d)最终筛选出的满足条件的NPC;(e)Nup133数量分布直方图;(f)对齐所有NPC质心的Nup133的空间分布;(g)所有Nup133的半径分布,其中红色线代表高斯拟合的分布曲线,其峰值对应的横坐标为拟合的Nup133半径;(h)旋转对齐后的Nup133的空间分布
Fig. 5. Reconstruction and analysis of Nup133 SMLM images. (a)(b) Typical SMLM image of Nup133 in U2OS cells and its zoomed view; (c) remained NPCs with 4‒8 Nup133s after preliminary screening; (d) finally selected NPCs in accordance with the screening criteria; (e) histogram of Nup133 number distribution; (f) spatial distribution of Nup133 positions aligned to NPC centers; (g) distribution of Nup133 radius, in which the red line represents the Gaussian-fitted distribution curve and its horizontal ordinate of the peak is the fitted Nup133 radius; (h) spatial distribution of Nup133 after rotational alignment
经过多次超分辨成像实验,笔者从10329个标记了Nup133的NPC中共筛选出558个符合筛选标准的NPC结构,总筛选率约为5%(见
表 1. Nup133和Nup98的两次筛选比例
Table 1. Ratios of selected Nup133 and Nup98 after twice screening
|
此外,笔者还使用SMLM对标记了Nup98的NPC进行了观测。Nup98位于NPC的内圈[38]。结果显示,Nup98的分布相比Nup133更加紧凑,如

图 6. Nup98 SMLM图像的重构分析。(a)(b)U2OS细胞中Nup98的代表性SMLM图像及其局部放大图;(c)初筛后保留下来的含有4~8个Nup98的NPC;(d)最终筛选出的满足条件的NPC;(e)Nup98数量分布直方图;(f)对齐所有NPC质心的Nup98的空间分布;(g)所有Nup98的半径分布,其中红色线代表高斯拟合的分布曲线,其峰值对应的横坐标为拟合的Nup98半径;(h)旋转对齐后的Nup98分布;(i)NPC模型图;(j)Nup133和Nup98分布的叠加
Fig. 6. Reconstruction and analysis of Nup98 SMLM images. (a)(b) Typical SMLM image of Nup98 in U2OS cells and its zoomed view; (c) remained NPCs with 4‒8 Nup98s after preliminary screening; (d) finally selected NPCs in accordance with the screening criteria; (e) histogram of Nup98 number distribution; (f) spatial distribution of Nup98 positions aligned to NPC centers; (g) distribution of Nup98 radius, in which the red line represents the Gaussian-fitted distribution curve and its horizontal ordinate of the peak is the fitted Nup98 radius; (h) the distribution of Nup98 after rotational alignment; (i) model diagram of NPC; (j) overlay of Nup133 and Nup98 distributions
对于Nup98,从10668个NPC中共筛选出1126个满足条件的NPC结构,总筛选率约为10%(
与Nup133相似,大部分NPC由4~7个Nup98定位,如
4 结论
针对核孔复合物的单分子定位超分辨图像,笔者提出了一种基于聚类方法的筛选和重构的处理流程。该流程主要包括分类、筛选和重构三部分。通过两次聚类识别NPC以及Nup成分,筛选含有4~8个Nup的形貌均匀的NPC,并进行重构分析,最终通过旋转成功重构出具有八重对称结构的NPC。将所提方法应用于Nup133和Nup98,实验结果显示:Nup133的半径为(58.4±0.1)nm,与粒子平均法计算的半径接近;Nup98的半径为(39.7±0.2)nm,比Nup133的半径小18.7 nm,表明Nup98更靠近核孔的中间位置。这些结果表明所提方法能够重构NPC并复现其八重对称结构,给出了准确的定位信息,有助于深入了解核孔复合物的组成。这种利用聚类分析重建亚细胞结构的方法也可以推广至其他类核孔结构,如中心粒、鞭毛基体等,或者其他具有各向同性对称的结构,为解析复杂生命结构提供了重要策略和方法。
[1] Tai L H, Yin G L, Sun F, et al. Cryo-electron microscopy reveals the structure of the nuclear pore complex[J]. Journal of Molecular Biology, 2023, 435(9): 168051.
[2] Allegretti M, Zimmerli C E, Rantos V, et al. In-cell architecture of the nuclear pore and snapshots of its turnover[J]. Nature, 2020, 586(7831): 796-800.
[3] Lin D H, Hoelz A. The structure of the nuclear pore complex (an update)[J]. Annual Review of Biochemistry, 2019, 88: 725-783.
[4] Schreiner S M, Koo P K, Zhao Y, et al. The tethering of chromatin to the nuclear envelope supports nuclear mechanics[J]. Nature Communications, 2015, 6: 7159.
[5] Sakuma S, D’Angelo M A. The roles of the nuclear pore complex in cellular dysfunction, aging and disease[J]. Seminars in Cell & Developmental Biology, 2017, 68: 72-84.
[6] Alber F, Dokudovskaya S, Veenhoff L M, et al. The molecular architecture of the nuclear pore complex[J]. Nature, 2007, 450(7170): 695-701.
[7] Rout M P, Aitchison J D, Suprapto A, et al. The yeast nuclear pore complex: composition, architecture, and transport mechanism[J]. The Journal of Cell Biology, 2000, 148(4): 635-651.
[8] Stoffler D, Goldie K N, Feja B, et al. Calcium-mediated structural changes of native nuclear pore complexes monitored by time-lapse atomic force microscopy[J]. Journal of Molecular Biology, 1999, 287(4): 741-752.
[9] Bley C J, Nie S, Mobbs G W, et al. Architecture of the cytoplasmic face of the nuclear pore[J]. Science, 2022, 376(6598): eabm9129.
[10] Petrovic S, Samanta D, Perriches T, et al. Architecture of the linker-scaffold in the nuclear pore[J]. Science, 2022, 376(6598): eabm9798.
[11] Mosalaganti S, Obarska-Kosinska A, Siggel M, et al. AI-based structure prediction empowers integrative structural analysis of human nuclear pores[J]. Science, 2022, 376(6598): eabm9506.
[12] Fontana P, Dong Y, Pi X, et al. Structure of cytoplasmic ring of nuclear pore complex by integrative cryo-EM and AlphaFold[J]. Science, 2022, 376(6598): eabm9326.
[13] Zhu X C, Huang G, Zeng C, et al. Structure of the cytoplasmic ring of the Xenopus laevis nuclear pore complex[J]. Science, 2022, 376(6598): eabl8280.
[14] Rust M J, Bates M, Zhuang X W. Sub-diffraction-limit imaging by stochastic optical reconstruction microscopy (STORM)[J]. Nature Methods, 2006, 3(10): 793-796.
[15] Betzig E, Patterson G H, Sougrat R, et al. Imaging intracellular fluorescent proteins at nanometer resolution[J]. Science, 2006, 313(5793): 1642-1645.
[16] Jungmann R, Avendaño M S, Woehrstein J B, et al. Multiplexed 3D cellular super-resolution imaging with DNA-PAINT and Exchange-PAINT[J]. Nature Methods, 2014, 11(3): 313-318.
[17] Kanchanawong P, Shtengel G, Pasapera A M, et al. Nanoscale architecture of integrin-based cell adhesions[J]. Nature, 2010, 468(7323): 580-584.
[18] Hu F, Zhu D L, Dong H, et al. Super-resolution microscopy reveals nanoscale architecture and regulation of podosome clusters in primary macrophages[J]. iScience, 2022, 25(12): 105514.
[19] Cieslinski K, Wu Y L, Nechyporenko L, et al. Nanoscale structural organization and stoichiometry of the budding yeast kinetochore[J]. Journal of Cell Biology, 2023, 222(4): 202209094.
[20] Thevathasan J V, Kahnwald M, Cieśliński K, et al. Nuclear pores as versatile reference standards for quantitative superresolution microscopy[J]. Nature Methods, 2019, 16(10): 1045-1053.
[21] Szymborska A, de Marco A, Daigle N, et al. Nuclear pore scaffold structure analyzed by super-resolution microscopy and particle averaging[J]. Science, 2013, 341(6146): 655-658.
[22] Salas D, le Gall A, Fiche J B, et al. Angular reconstitution-based 3D reconstructions of nanomolecular structures from superresolution light-microscopy images[J]. Proceedings of the National Academy of Sciences of the United States of America, 2017, 114(35): 9273-9278.
[23] Sieben C, Banterle N, Douglass K M, et al. Multicolor single-particle reconstruction of protein complexes[J]. Nature Methods, 2018, 15(10): 777-780.
[24] Curd A P, Leng J, Hughes R E, et al. Nanoscale pattern extraction from relative positions of sparse 3D localizations[J]. Nano Letters, 2021, 21(3): 1213-1220.
[25] EsterM, KriegelH P, SanderJ, et al. A density-based algorithm for discovering clusters in large spatial databases with noise[C]∥Proceedings of the Second International Conference on Knowledge Discovery and Data Mining, August 2-4, 1996, Portland, Oregon. New York: ACM Press, 1996: 226-231.
[26] Peng D H, Gui Z P, Wang D H, et al. Clustering by measuring local direction centrality for data with heterogeneous density and weak connectivity[J]. Nature Communications, 2022, 13: 5455.
[27] Levet F, Hosy E, Kechkar A, et al. SR-Tesseler: a method to segment and quantify localization-based super-resolution microscopy data[J]. Nature Methods, 2015, 12(11): 1065-1071.
[28] Pratim M P. Probabilistic optically-selective single-molecule imaging based localization encoded (POSSIBLE) microscopy for ultra-superresolution imaging[J]. PLoS One, 2020, 15(11): e0242452.
[29] Murtagh F, Contreras P. Algorithms for hierarchical clustering: an overview[J]. Wiley Interdisciplinary Reviews: Data Mining and Knowledge Discovery, 2012, 2(1): 86-97.
[30] Pritchard H A T, Pires P W, Yamasaki E, et al. Nanoscale remodeling of ryanodine receptor cluster size underlies cerebral microvascular dysfunction in Duchenne muscular dystrophy[J]. Proceedings of the National Academy of Sciences of the United States of America, 2018, 115(41): E9745-E9752.
[31] Yan Q Y, Lu Y T, Zhou L L, et al. Mechanistic insights into GLUT1 activation and clustering revealed by super-resolution imaging[J]. Proceedings of the National Academy of Sciences of the United States of America, 2018, 115(27): 7033-7038.
[32] Pageon S V, Nicovich P R, Mollazade M, et al. Clus-DoC: a combined cluster detection and colocalization analysis for single-molecule localization microscopy data[J]. Molecular Biology of the Cell, 2016, 27(22): 3627-3636.
[33] Levet F, Julien G, Galland R, et al. A tessellation-based colocalization analysis approach for single-molecule localization microscopy[J]. Nature Communications, 2019, 10: 2379.
[34] Ejdrup A L, Lycas M D, Lorenzen N, et al. A density-based enrichment measure for assessing colocalization in single-molecule localization microscopy data[J]. Nature Communications, 2022, 13: 4388.
[35] Pan L T, Yan R, Li W, et al. Super-resolution microscopy reveals the native ultrastructure of the erythrocyte cytoskeleton[J]. Cell Reports, 2018, 22(5): 1151-1158.
[36] 杨建宇, 胡芬, 邢福临, 等. 结合多次DBSCAN和层次聚类算法的膜蛋白单分子定位超分辨图像分割[J]. 中国激光, 2023, 50(3): 0307106.
[37] Walther T C, Alves A, Pickersgill H, et al. The conserved Nup107-160 complex is critical for nuclear pore complex assembly[J]. Cell, 2003, 113(2): 195-206.
[38] Hoogenboom B W, Hough L E, Lemke E A, et al. Physics of the nuclear pore complex: theory, modeling and experiment[J]. Physics Reports, 2021, 921: 1-53.
Article Outline
侯梦迪, 胡芬, 杨建宇, 董浩, 潘雷霆. 核孔复合物单分子定位超分辨图像的筛选和重构[J]. 中国激光, 2024, 51(3): 0307106. Mengdi Hou, Fen Hu, Jianyu Yang, Hao Dong, Leiting Pan. Screening and Reconstruction for Single-Molecular Localization Superresolution Images of Nuclear Pore Complexes[J]. Chinese Journal of Lasers, 2024, 51(3): 0307106.
