Aberration correction for deformable-mirror-based remote focusing enables high-accuracy whole-cell super-resolution imaging
1. INTRODUCTION
As a powerful tool for imaging biological samples, single-molecule localization-based super-resolution microscopy allows for optical observation of structural details with unprecedented resolution while providing
To image samples thicker than the DOF of high-NA objective using SMLM [6–8], different implementation approaches have been developed, such as -scan with thin sections imaging [4,9–11], multi-plane imaging [12,13], and engineered PSF with large DOF imaging [14–17]. -scan imaging normally requires physically moving the sample or objective to scan at the axial positions of cells and then combining optical sections to obtain the complete cellular structure. It is therefore prone to stitching artefacts due to vibrations caused by stage movement during repeated scans of different sections. Multi-plane detection allows for simultaneous imaging of different focal planes along the axial direction to achieve volumetric imaging. However, compared to single-plane imaging, multi-plane detection often suffers from lower signal-to-noise ratio (SNR) since the total number of photons is distributed across different imaging planes [13]. Thick sample imaging can also be achieved by engineered PSF with large DOF without the need to scan the sample. There are two main ways to generate these engineered PSFs. One is to fabricate a transmission phase mask with a specialized pattern [15], placed in the Fourier plane of the microscope. Another way is to employ a programmable phase modulator, such as a spatial light modulator and deformable mirror (DM). Although both ways can be used to engineer PSFs with desired DOF, programmable phase modulators are often preferred due to their flexibility and ability to correct for both system and sample-induced aberrations. Especially with the development of DM-based optimal PSF engineering, we were able to design an optimal PSF with predefined DOF without compromising the loss of photons [17]. However, there is normally a trade-off between the localization precision and DOF of the PSF optimized. PSFs with longer DOF normally spread in a larger area which leads to a reduction in SNR and loss of localization precision.
In recent years, adaptive optics (AO) techniques have been widely applied in optical microscopy [18]. In an approach known as remote focusing, fast 3D imaging of thick samples can be achieved by dynamically adjusting the focal plane without physically moving the objective lens or sample [19–23]. This process can be executed at rates of a few kilohertz using a DM or other variable optical elements [19,24,25], avoiding the need for physical movement of the sample or objective. In SMLM, this method has demonstrated the capacity to record volumetric data of whole cells up to 10 μm while maintaining axial sample stabilization using a standard widefield microscope equipped with a DM [20]. However, system aberrations often arise when applying the defocus term to the vibrational device [22,26]. Additionally, the inhomogeneous refractive indices of biological tissues can lead to the blurring and distortion of single-molecule emission patterns [11,27]. All these issues can give rise to imaging artifacts and compromise the achievable resolution of SMLM. Hence, accurate correction and modeling of these aberrations are key to acquire high-accuracy super-resolution images across the entire volume.
Here, we employed a DM to engineer PSFs with optimal 3D localization precision with different DOFs (DMO PSF). Furthermore, the DM was used to fast remote focus to longitudinally record axial stacks of whole cells across an extended range with high accuracy, without the need to physically move the sample. Crucially, we accurately calibrated and corrected system aberrations introduced during refocusing at different imaging planes. Finally, we used
2. RESULTS
2.1 A. Remote Focusing Principle and Optical Setup
As shown in Fig. 1(a), we modified a standard 3D SMLM system by incorporating AO components (for details see Fig. 8 in Appendix B). Remote focusing based on AO is enabled by a DM, which is positioned in conjugate with the objective pupil plane. The DM has emerged as the most prevalent phase modulator for fluorescence detection due to its minimal photon loss and rapid wavefront control capabilities. In this design, the DM serves three purposes: PSF engineering, aberration correction, and focal position shifting for different imaging depths. For precise wavefront control, we meticulously calibrated the experimental DM influence function of each actuator using a Twyman–Green interferometer, which measures the surface deformation of the DM [17,29].

Fig. 1. Schematic diagram illustrating the remote focusing principle. (a) Simplified schematic of a microscope configured for remote focusing using a DM in the imaging path. (b) The DM modulates the wavefront by controlling its defocus phase to shift different refocused focal planes around the nominal focal plane along the optical
Remote focusing is a high-speed volumetric scanning technique that axially shifts the imaging plane by applying a defocus phase at the pupil of the optical system. This technique avoids the need to move the specimen or objective, thereby enabling accurate volumetric super-resolution imaging. We employed the defocus mode of the DM to refocus the focal plane of the imaging optical system. First, we defocused the beads on the coverslip using the objective’s z-piezo stage. Then, we compensated for this defocus by adjusting the DM’s defocus mode to refocus the beads. We calibrated the relationship between the amplitude of the applied defocus wavefront in the DM and real axial shift of the imaging plane [Fig. 1(b)]. As shown in Fig. 1(c), the amplitude of the applied defocus wavefront does not correlate linearly with the changes in the imaging plane. Especially for refocusing planes far away from the zero axial shift focal plane, the deviation is more pronounced. This is probably due to the limited actuators in the DM which cannot accurately modulate the ideal defocus wavefront. Therefore, it is very important to correct the residual aberrations at each focal plane after applying the defocus wavefront to the DM.
2.2 B. System Aberration Correction of Remote Focus Using Fluorescent Beads
Astigmatism-based 3D SMLM imaging is the most widely used 3D super-resolution imaging method as it can be achieved by simply introducing a cylindrical lens into the imaging path. The DOF of the astigmatism PSF is approximately at the range of 1.2 μm around the focus [4]. Beyond this depth range, axial sample scanning [9] or optimized extended DOF PSF is necessary [30], as molecules outside the focus cannot be efficiently identified and localized. Furthermore, the 3D imaging capability of astigmatism is suboptimal as the localization precision decreases rapidly at the defocusing positions. In this study, we integrated our previously published DM-optimized PSF (DMO PSF) framework [17], designed for varying imaging depths, with remote focusing to achieve high-quality 3D super-resolution across the entire cell. To obtain the DMO PSF, we employed the influence function of the DM actuators as the solution space to optimize the pupil function of the engineered PSF by minimizing its 3D Cramér–Rao lower bound (CRLB). Subsequently, the DM was used to modulate both the DMO PSF and astigmatism PSF [Figs. 2(a)–2(d)]. Both experimental PSFs were built by axially scanning the beads on the coverslip and interpolating the beads stack with cubic spline [31]. The localization precision of both experimental PSFs was then compared. As shown in Figs. 2(e)–2(h), the 2 μm DMO PSF exhibited a similar localization precision near the focus compared to the astigmatism PSF. However, the performance of astigmatism deteriorates significantly when the imaging plane is slightly away from the focus. In contrast, the DMO PSF maintains a relatively uniform resolution throughout the optimized axial range. The performance of experimental PSFs in Figs. 2(e)–2(h) agrees well with the theoretical calculations [17].

Fig. 2. Comparison of the localization precision between experimental astigmatism PSF and DMO PSF. (a) Averaged astigmatism PSF of fluorescent beads on the coverslip, with PSFs at axial positions from
We then applied the DM with the defocus wavefront in addition to the optimized pupil function to remotely scan the samples for volumetric super-resolution imaging. To investigate the PSF after adding the defocus wavefront, we imaged the beads on the coverslip with the DM-applied defocus wavefront and refocused the beads using the objective -stage. As shown in Fig. 3(a), the beads were modulated to the DMO PSF and defocus wavefront of (4.62 rad, wavelength 680 nm) amplitude. The beads were then refocused by moving the objective 2 μm above the nominal focal plane. However, the refocused PSF showed significant difference compared to the one at zero-focus position [Figs. 2(c) and 3(a)]. We infer that this is probably due to the mismatch between the theoretical and experimental defocus mode, which leads to residual aberrations. To investigate the residual aberrations introduced besides defocus, we then acquired bead stacks in a range of relative to the focal plane for calibration. We utilized a GPU-based vectorial PSF fitter to fit each bead stack by maximum likelihood estimation (MLE) to retrieve the Zernike-based aberration coefficients [16]. Furthermore, we employed globLoc [32] for the global fitting of images from the bead stacks, enabling high-accuracy estimation of aberrations.
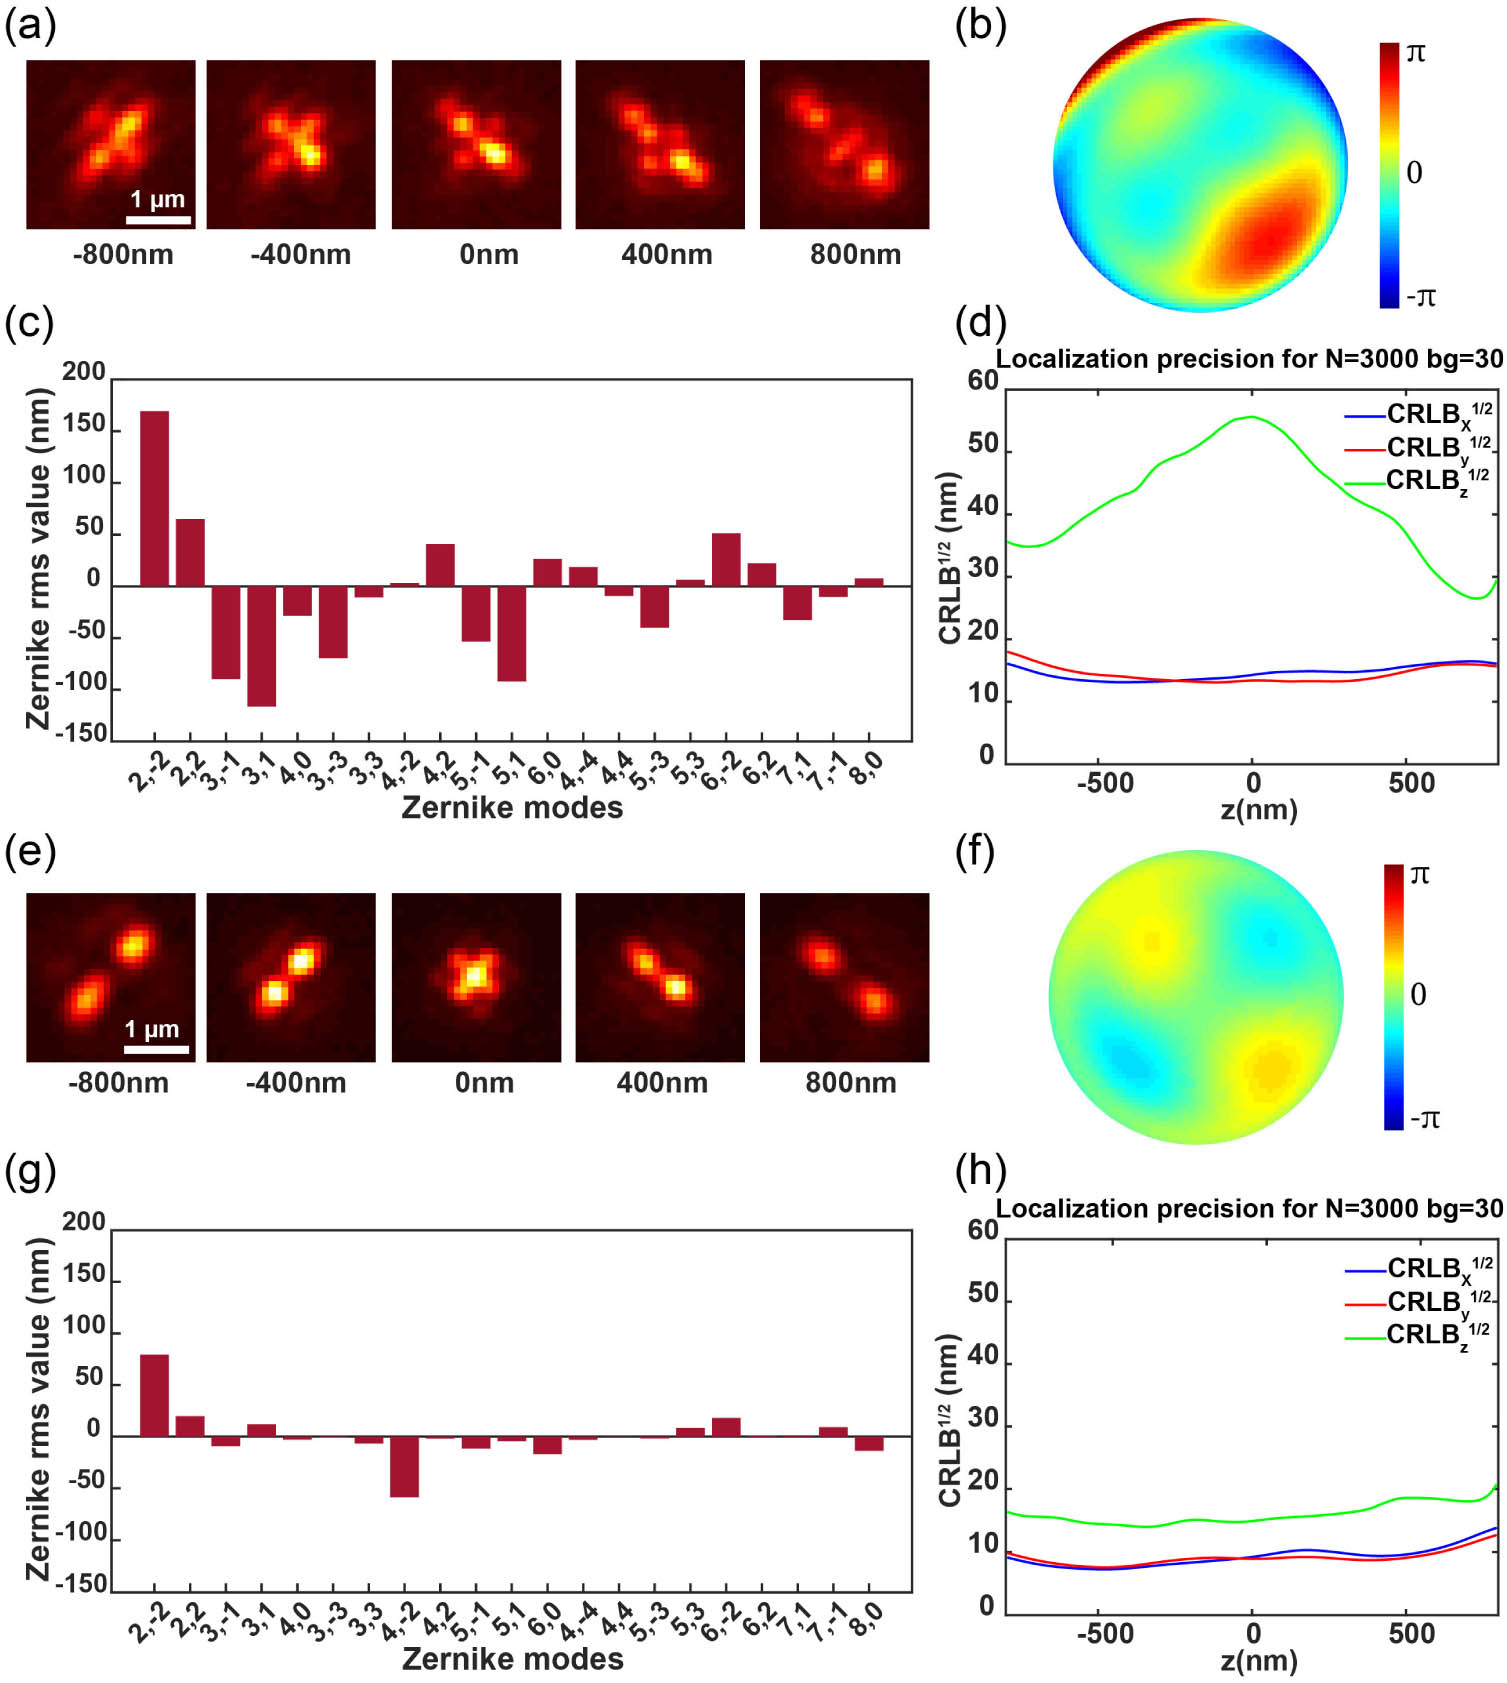
Fig. 3. Correcting aberrations during refocusing with DMO PSF using a DM at various axial positions of the beads on the coverslip. (a) The beads were refocused using a DM to a position 2 μm above the nominal focal plane. (b) The pupil function for the refocused beads. (c) Fitted 21 Zernike coefficients for the beads stack. (d) CRLB for the experimental DMO PSF, calculated using 3000 photons and 30 background photons to simulate the typical photon flux of fluorescent dyes. A comparison of CRLB calculations based on the typical photon flux of fluorescent proteins is shown in Fig. 9 of Appendix C . (e)–(h) The PSF shape, pupil function, Zernike coefficients, and localization precision after aberration correction, respectively. The CRLB exhibits significant improvements, particularly in the
In this study, we retrieved the coefficients of all 21 tertiary Zernike polynomials from the average experimental bead stack [Fig. 3(c)]. Due to the extra aberrations introduced besides defocus, the pupil function of the refocused DMO PSF [Fig. 3(b)] is quite different from that at the zero focal plane [Fig. 2(d)]. The residual aberrations also led to the degradation of localization precision, particularly in the -axis direction [Fig. 3(d)]. Therefore, we compensated for the 21 Zernike aberrations using the DM to counteract the additional aberrations introduced after refocusing, making the aberrations at the refocusing position closer to those of the beads on the coverslip [Figs. 3(e) and 3(f)]. As shown in Fig. 3(h), the resulting localization precisions are close to those of the PSF at zero focal plane [Fig. 2(g)].
We then demonstrated the effectiveness of the residual aberration correction after applying the defocus wavefront using the nucleoporin Nup96 in U2OS cells, a structure often used as a quantitative reference [33]. The top nuclear envelopes of the Nup96-SNAP-AF647 labeled nuclear pore complexes (NPCs) were imaged. The imaging depth is about 4 μm above the coverslip. As shown in Fig. 10(a) of Appendix D, the single-molecule images are very aberrated and the SNR is considerably low due to the additional aberrations introduced when applying the defocus wavefront to the DM. We then applied the calibrated residual aberration correction using the beads on the coverslip as described before. After aberration correction, the single-molecules are clearly visible, and the SNR of the image is improved significantly [Fig. 10(b) in Appendix D]. The number of localized single-molecule events increased sixfold, and the signal background ratio (SBR) of single-molecule events improved by nearly 2.5 times [Fig. 10(c) in Appendix D], with the localization and quantification analysis of single-molecule images implemented in SMAP [34]. The experimental astigmatic PSFs with and without residual aberration correction after applying the defocus wavefront are shown in Fig. 11 of Appendix E. We then applied these two PSFs to image biological samples. As shown in Fig. 12 of Appendix F, the double ring structure of NPCs can be clearly resolved after residual aberration correction [Fig. 12(f) in Appendix F] while it was hardly resolved when only the defocus wavefront was applied to the DM [Fig. 12(c) in Appendix F].
2.3 C. Whole-Cell 3D Imaging with Remote Focusing Using Beads PSF Model
We first demonstrated the whole-cell imaging capability of our approach using a silicone oil objective where we can match the refractive index of the sample medium with silicone oil [35,36]. The whole-cell nucleus was imaged with 2 μm DMO PSF. Five imaging planes spaced by 1 μm were recorded by remote focusing between different imaging planes using the DM (Appendix A). The five optical section data were then stitched together by redundant cross-correlation to reconstruct the whole nucleus (Appendix A). As shown in Fig. 4, we were able to clearly reconstruct the ring structure in both top and bottom nuclear envelope with FRC resolution of 38 nm [Fig. 4(b)]. In the side-view of the nucleus, we were also able to resolve the double ring structure in the entire nucleus over a depth of . Moreover, both the reconstructed diameter and the spacing between the upper and lower rings of the Nup96 structure agree with the reference structure [Figs. 4(h), 4(i) and 4(j), 4(k)]. We then imaged the nucleus with 6 μm DMO PSF (Fig. 13 in Appendix G) for comparison and observed a reduced FRC resolution (, Fig. 14 in Appendix H). It is also difficult to observe the double ring structure of Nup96 from the side-view images.
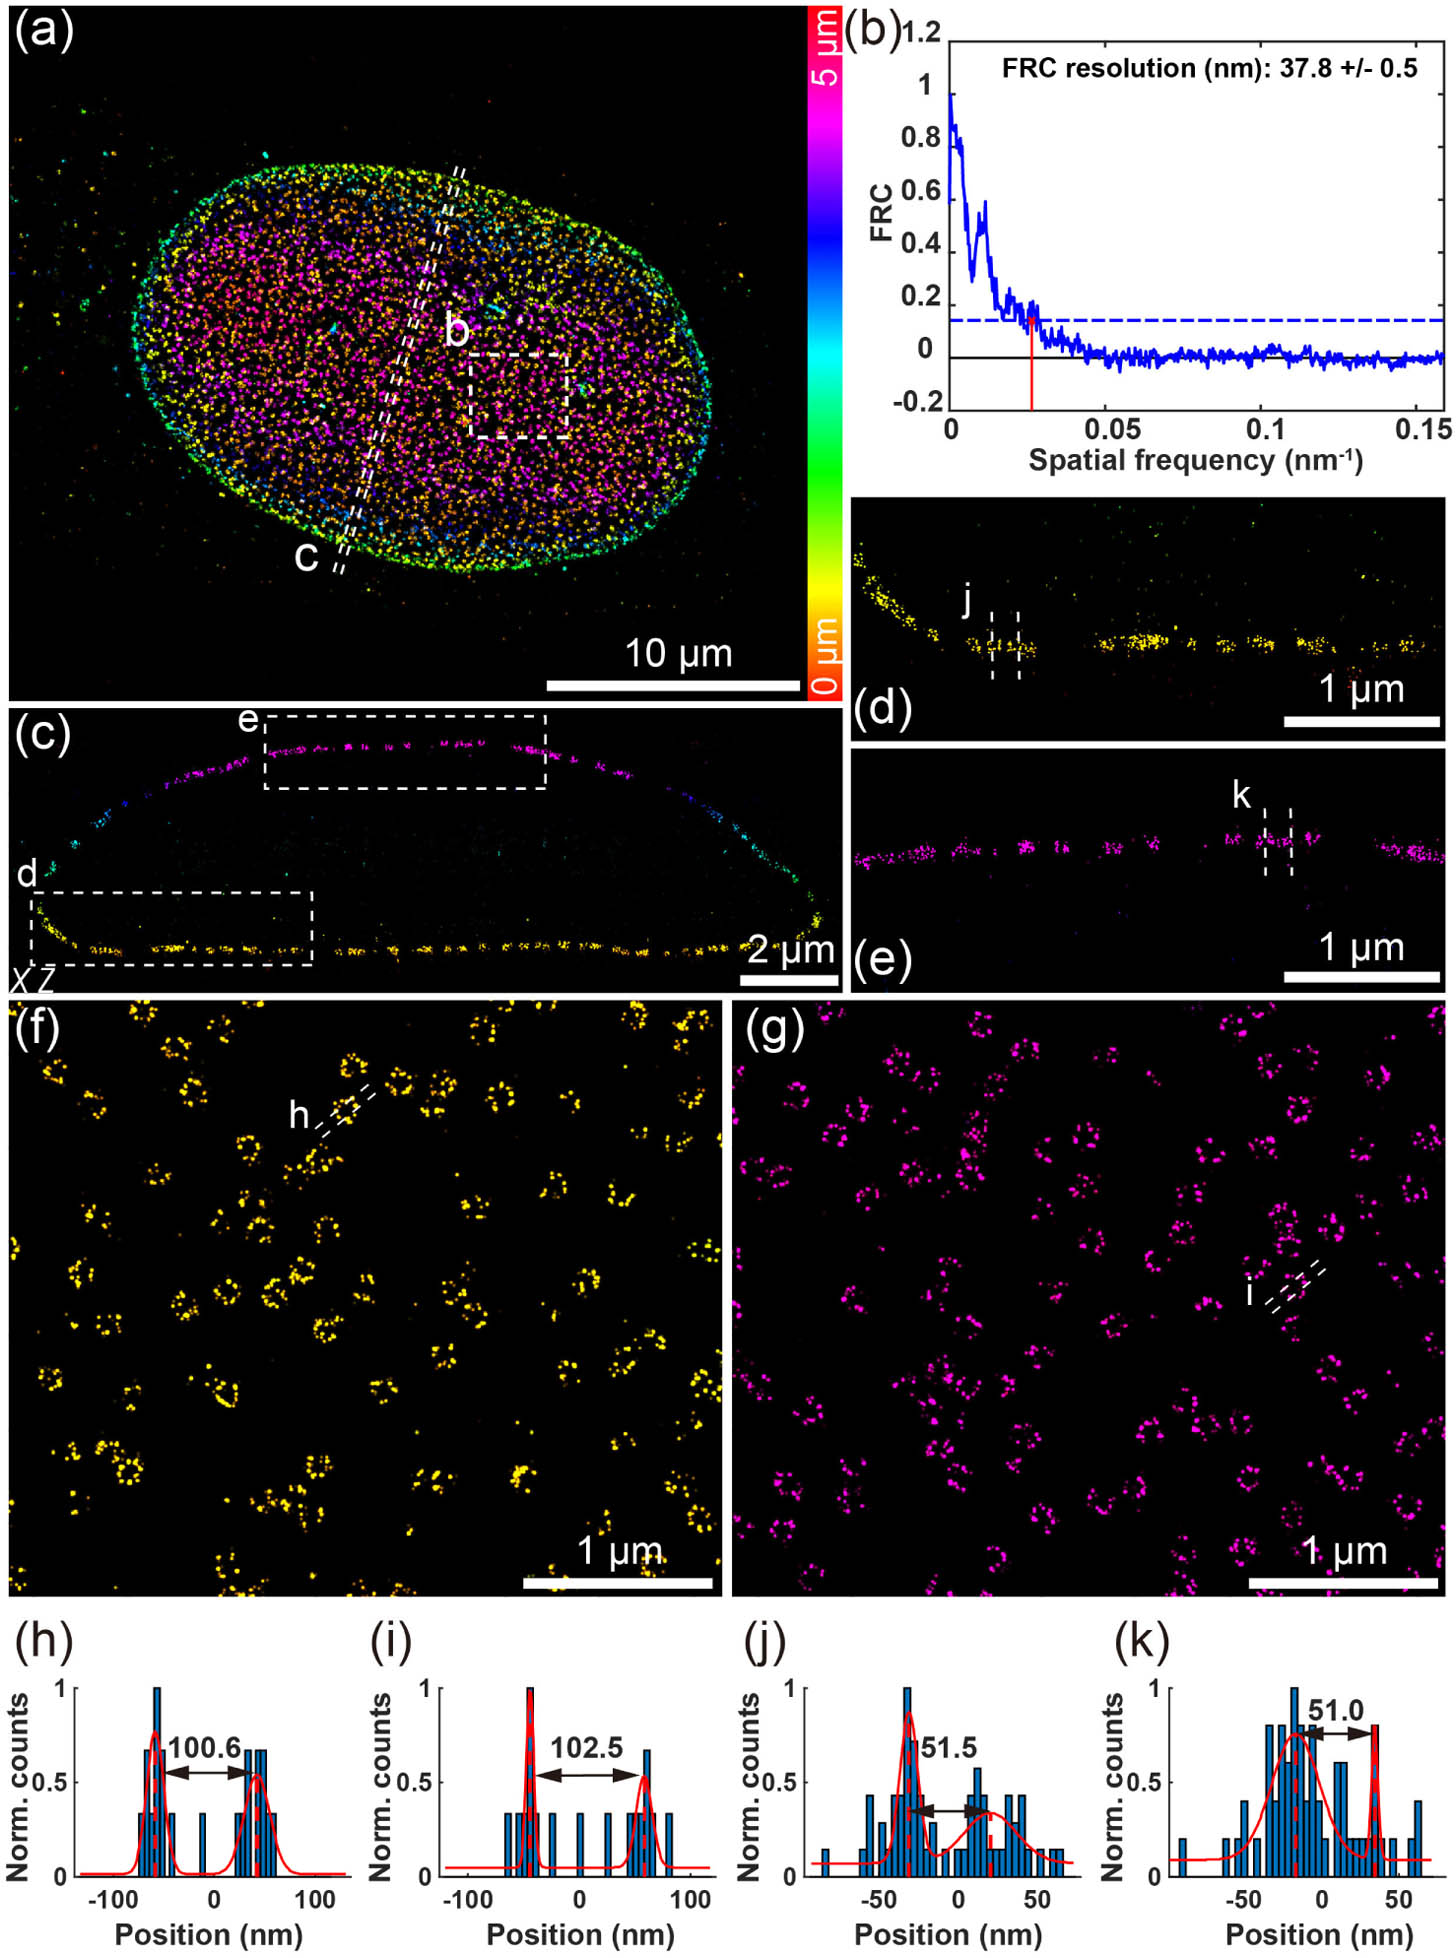
Fig. 4. Whole-cell 3D super-resolution imaging of NPC. (a) Overview of the panoramic whole-cell 3D imaging of NPC using DMO PSF, merging five optical sections. (b) FRC analysis of the region boxed in (a). (c) Side-view cross section of the region denoted by the dashed line in (a). (d), (e) Magnified view of the area denoted by the box in (c). (f) View of the bottom surface of the boxed area in (a). (g) View of the top surface of the boxed area in (a). (h), (i) Intensity profile along the white dashed lines in (f) and (g). (j), (k) Intensity profile along the white dashed lines in (d) and (e). The data were acquired from 8000 frames per cycle over 20 cycles from five optical sections, with 120 mW laser power and 20 ms exposure time.
To further demonstrate that image quality is maintained throughout the entire cell, we imaged microtubules in COS-7 cells. The 3D reconstruction was assembled from seven optical sections with step sizes of 1 μm, resulting in a whole-cell microtubule super-resolution image with a DOF of 8 μm [Fig. 5(a)]. We were able to clearly observe the microtubule structures throughout the whole cell, with the ability to resolve finer structural details of the microtubules as shown in both the top and bottom layers of the cell [Figs. 5(b) and 5(c)]. Benefitting from the stitching method by redundant cross-correlation, no significant stitching artifacts were observed in the axial profile of the whole-cell microtubule volume, which is aligned of seven optical sections [Fig. 5(d)].
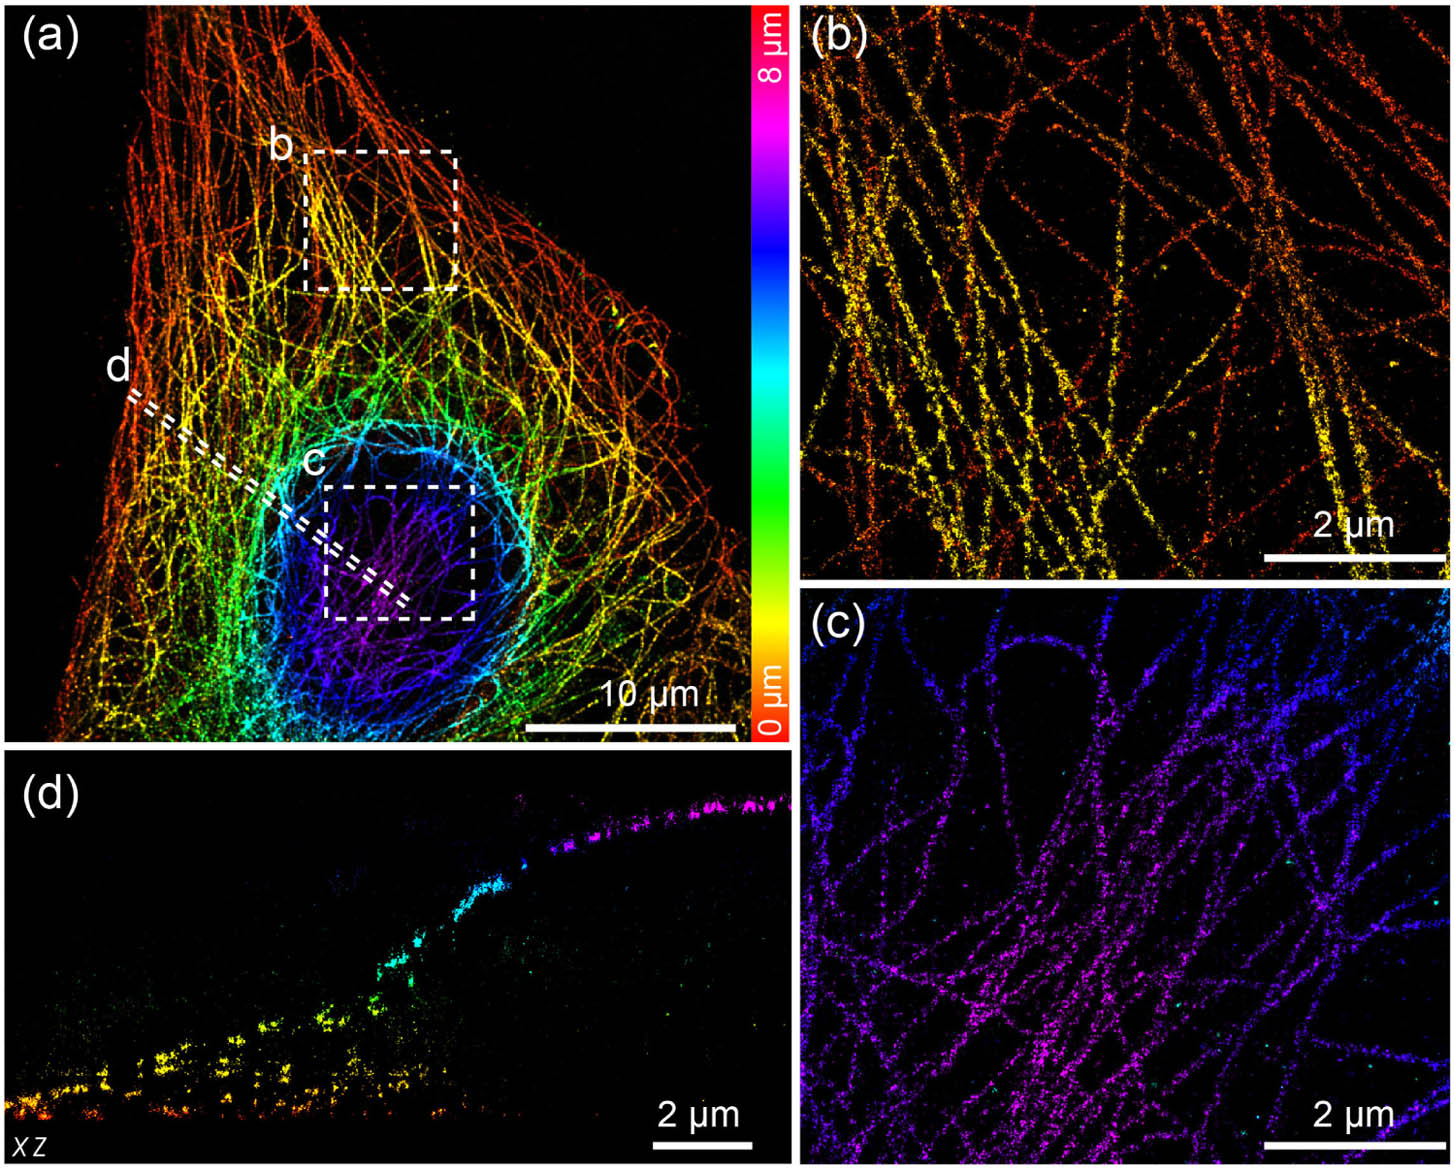
Fig. 5. Whole-cell 3D super-resolution imaging of microtubules. (a) Overview of the panoramic whole-cell 3D imaging of microtubule using DMO PSF, merging seven optical sections. (b) Zoomed bottom surface view of the boxed area denoted in (a). (c) Zoomed top surface view of the boxed area denoted in (a). (d) Side-view cross section of the region denoted by the dashed line in (a). The data were acquired from 7000 frames per cycle over 40 cycles from seven optical sections, with 200 mW laser power and 15 ms exposure time.
2.4 D. In situ Aberration Correction of Remote Focus Using Blinking Single-Molecules
The bead-based PSF model normally works well only when the
Here, we employed a 1.5 NA oil-immersion objective to image the whole cells. Similar to the silicone oil objective imaging, we first calibrated the residual aberrations at different focal planes after applying the defocus wavefront to the DM. As shown in Figs. 6(a) and 6(b), an ideal DMO PSF could be obtained after applying the residual aberration correction. We then applied this PSF to image COS-7 cell at a depth of about 2.5 μm [Fig. 6(c)]. The single-molecule blinking data were used to estimate the
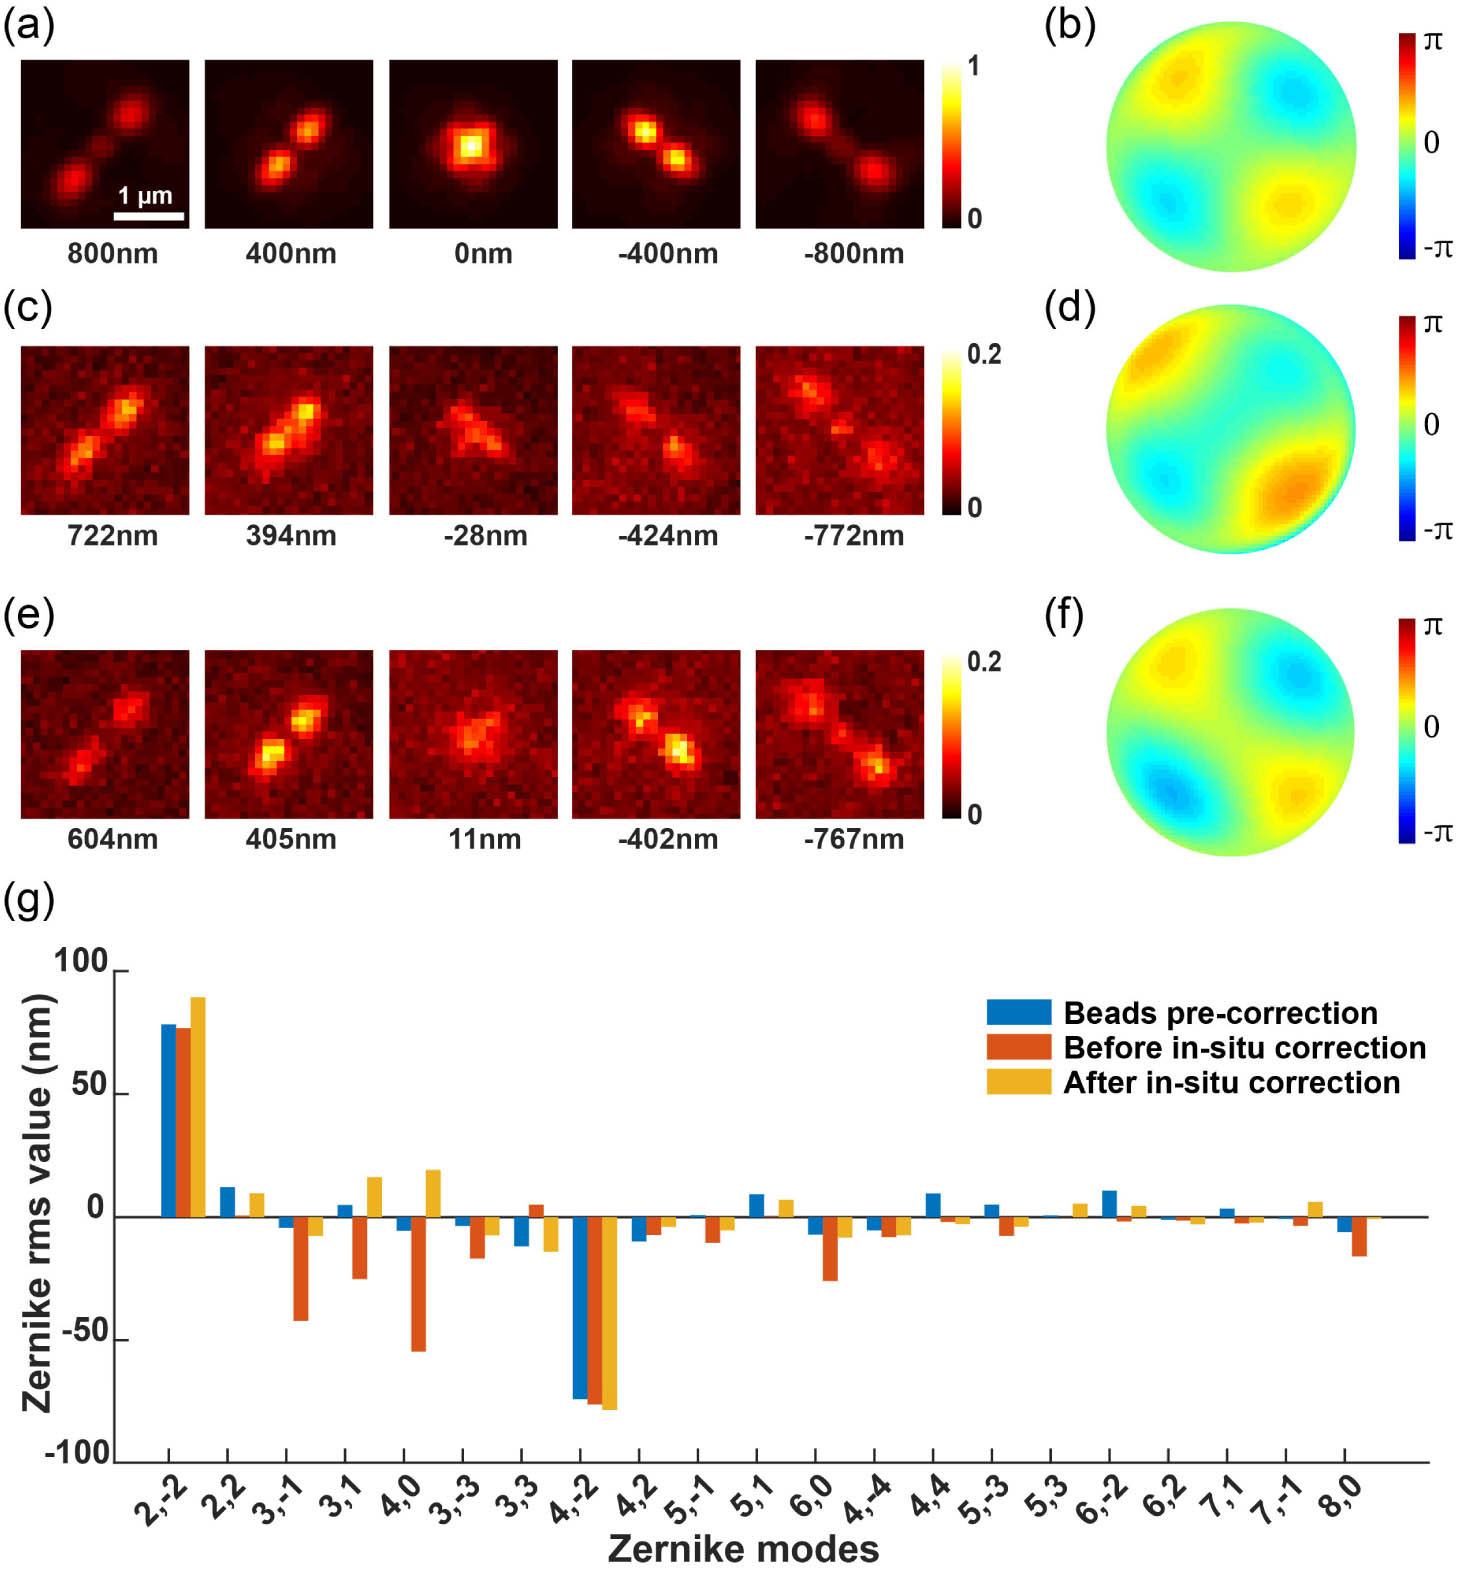
Fig. 6. In situ aberration correction using blinking single-molecules under remote focusing. (a) The beads on the coverslip were refocused using the DM to 1 μm above the nominal focal plane, with a pre-correction for aberrations applied to the imaging system. (b) Pupil function derived from the PSF of refocused beads. (c) The refocused PSF was obtained from single-molecule blinking data of immunofluorescence-labeled TOM20, recorded at a depth of 2.5 μm in COS-7 cells. (d) Pupil function calculated from the in situ PSF. (e), (f) The PSF shape and its corresponding pupil function after in situ aberration correction. (g) The fitted 21 Zernike coefficients were obtained from the PSF of refocused beads after system aberration correction, the in situ blinking single-molecule, and the in situ PSF after aberration correction using blinking single-molecule.
Subsequently, we compensated for the aberrations by controlling the DM and then re-collected single-molecule data from the same location for
2.5 E. Whole-Cell 3D Imaging with Remote Focusing Using the In situ PSF Model
We then combined remote focusing with uiPSF-based aberration correction using the DM and an oil objective to image the whole-cell mitochondria. Here, we employed 2 μm DMO PSF and imaged the whole-cell mitochondria with three remote focusing imaging planes spaced by 1 μm. For each refocused position,
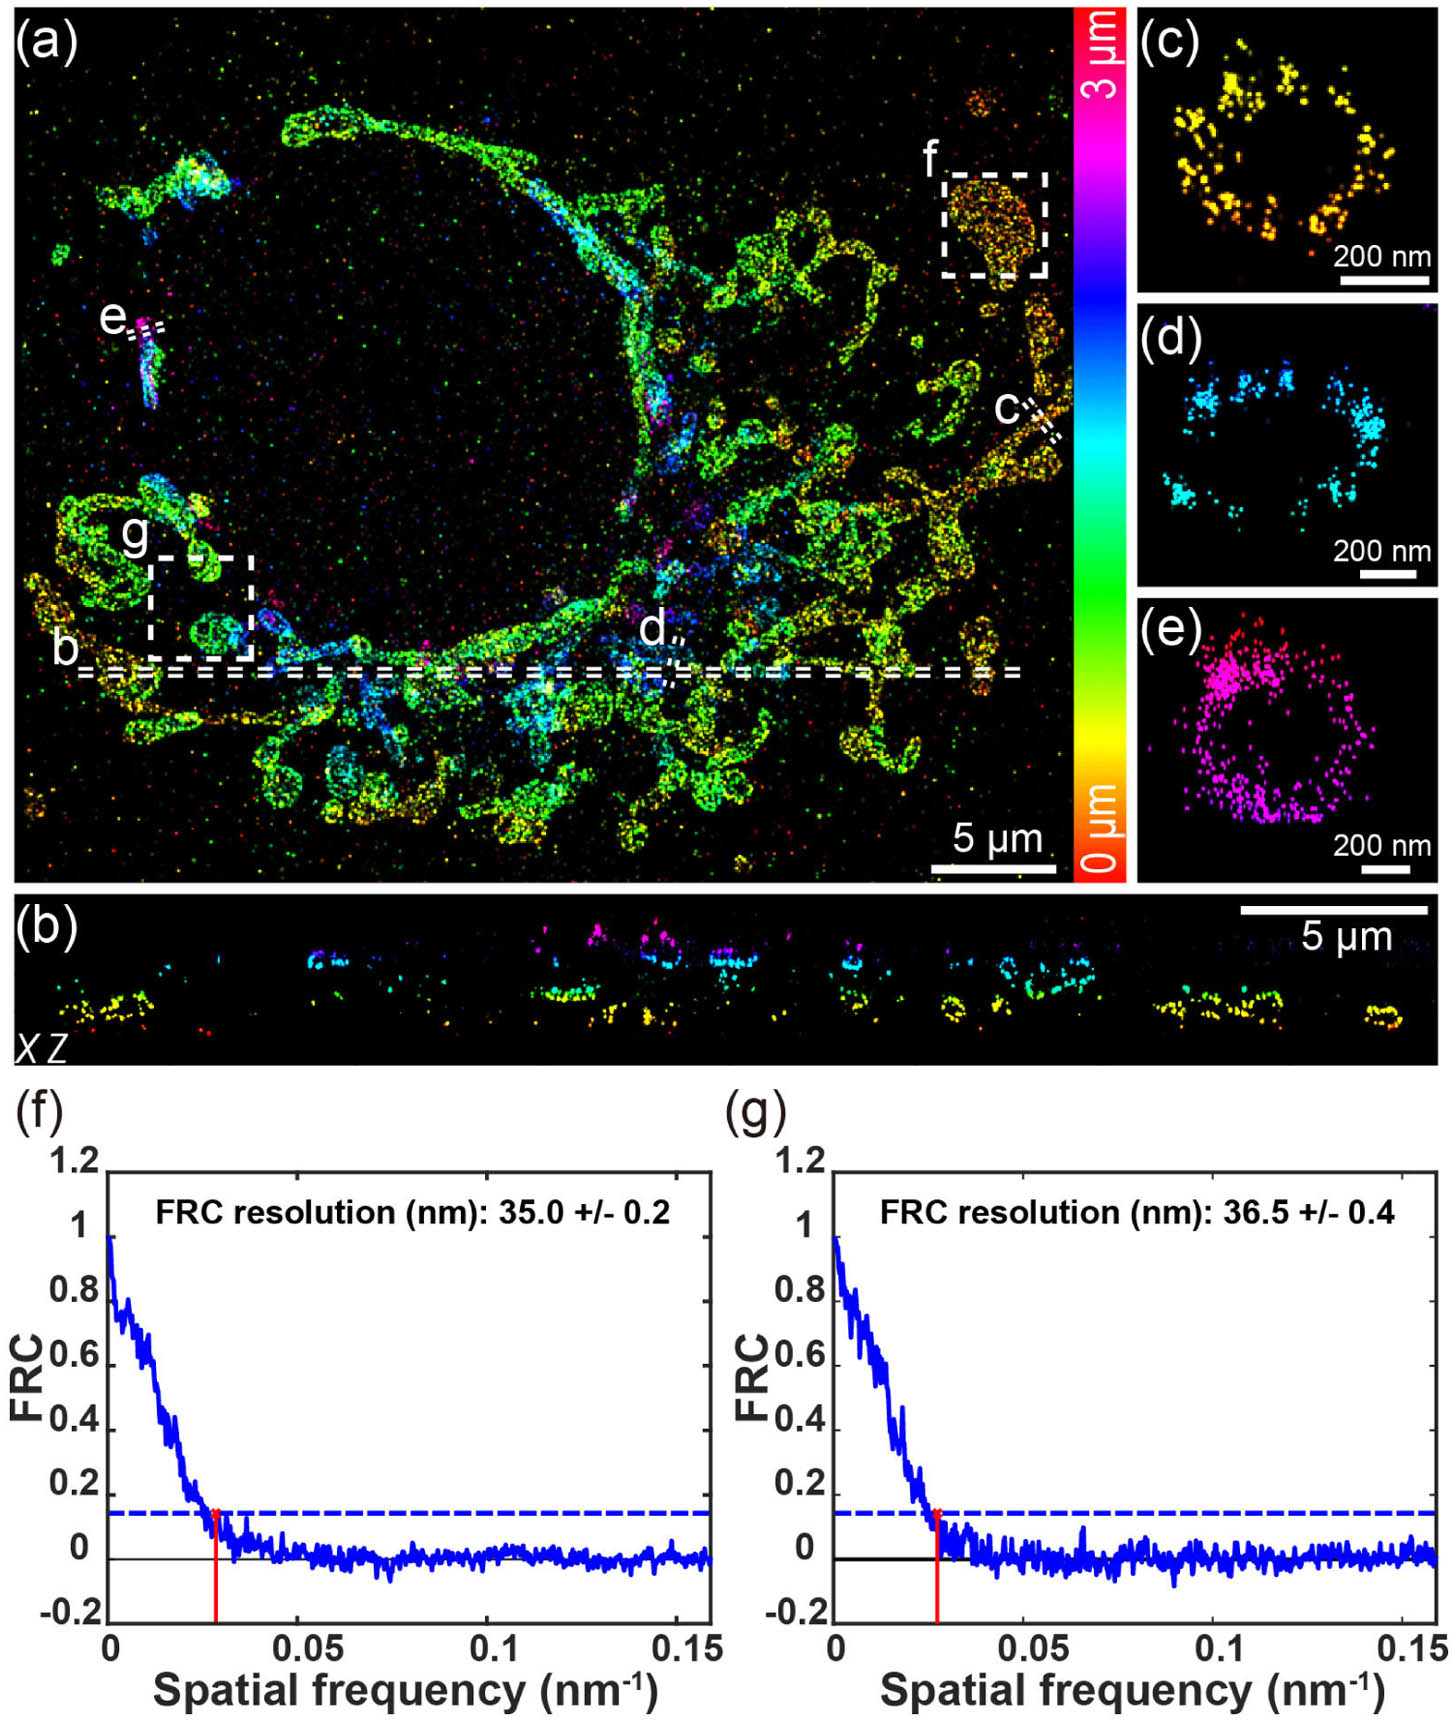
Fig. 7. Whole-cell 3D super-resolution imaging of mitochondria. (a) Overview of the panoramic whole-cell 3D imaging of mitochondria using DMO PSF by merging three optical sections. (b) Side-view cross section of the region indicated by the dashed line in (a). (c)–(e) Zoomed-in side-view cross sections from distinct depth areas, as indicated by the dashed lines in (a). (f), (g) FRC analysis of regions enclosed by the boxes in (a), with (f) near the cell’s bottom surface and (g) near the top. The data were acquired from 3000 frames per cycle over 70 cycles from three optical sections, with 200 mW laser power and 15 ms exposure time.
3. DISCUSSION
In this work, we employed a DM to perform super-resolution imaging of the whole cells by remote focusing. We systematically corrected the residual aberrations after applying the defocus wavefront and sample-induced aberrations with uiPSF. Furthermore, we utilized the DMO PSF, which could achieve optimal 3D resolution within a predefined DOF using the DM. These resulted in a significant SNR improvement in single-molecule data post aberration correction. We demonstrated the performance of our approach by conducting whole-cell imaging of nucleoporin Nup96, microtubules, and mitochondria. Compared to the PSF directly optimized by the DM with a large DOF of 6 μm, which exhibited a resolution of approximately 50 nm, our reconstructed super-resolution images exhibited a marked improvement in resolution (). Moreover, we employed uiPSF to precisely estimate the sample-induced aberrations using the
In summary, the remote focusing enabled high-resolution whole-cell imaging, particularly in scenarios with high labeling density where large DOF PSF imaging could result in a strong background. With the precise
4 Acknowledgment
Acknowledgment. The authors thank Shuang Fu and Mengfan Li for helpful suggestions on DM calibration and PSF optimization.
[26]
[29]
[37]
[42]
Article Outline
Wei Shi, Yingchuan He, Jianlin Wang, Lulu Zhou, Jianwei Chen, Liwei Zhou, Zeyu Xi, Zhen Wang, Ke Fang, Yiming Li. Aberration correction for deformable-mirror-based remote focusing enables high-accuracy whole-cell super-resolution imaging[J]. Photonics Research, 2024, 12(4): 821.

