基于多元定标法的矿物铀元素光纤式激光诱导击穿光谱定量分析【增强内容出版】
The nuclear industry is a strategic high-tech industry and an important cornerstone of national security. It involves various areas, such as ore exploration and mining, uranium extraction, isotope separation, reactor power generation, and spent fuel reprocessing. The uranium content of uranium ores is an important criterion for identifying uranium ore types and evaluating their developmental value. The rapid collection of uranium distribution information is necessary for geographical exploration. In particular, this is true for China, where uranium deposits are scattered and ore bodies are relatively small. Laser-induced breakdown spectroscopy (LIBS) is an atomic emission spectroscopy technique that involves irradiating the sample surface with nanosecond pulse lasers (typically at irradiance levels above GW/cm2). The irradiated material on the sample surface is rapidly heated, melted, vaporized, and partially ionized, forming laser-induced plasma (LIP). The elemental composition of the sample material can be measured by analyzing the emission spectra of the plasma. Fiber-optic LIBS (FO-LIBS) is an LIBS system that utilizes optical fibers for laser transmission and simultaneous collection of plasma emission spectra. It uses flexible, long optical fibers to transmit pulse lasers and spectral signals, which make it more suitable for complex and confined spaces in the field than conventional LIBS. Measurement distances can reach tens of meters. This study addresses the demand for the rapid, in-situ, and on-site detection of uranium in the nuclear industry and establishes a laboratory-based FO-LIBS system for investigating the evolution characteristics of uranium emission spectral lines in plasma under a helium atmosphere. Furthermore, it provides parameter optimization schemes and explores the matrix effects of uranium ore samples. A multivariate calibration method for quantitative analysis is proposed, which effectively improves calibration and prediction accuracy while ensuring model generalization performance. This provides a new approach for the rapid elemental analysis of ores.
We conducted experiments using natural samples and their mixtures to better align the results with practical applications. Spectra of the pressed samples were acquired using the FO-LIBS system. An air-blowing device was used to create a helium atmosphere, and the spectral information in a helium atmosphere was compared with that in an air atmosphere. The detection delay was optimized by comparing the signal-to-noise ratio, signal-to-background ratio, and net spectral intensity of the spectral lines. A multivariate linear calibration algorithm based on an internal standard method was proposed to address the matrix effects caused by the compositional differences among the samples. The model was fitted using partial least squares regression (PLSR) and a constrained genetic algorithm (GA), and the results were compared with calibration results based on spectral net intensity.
Among the U I 356.659 nm, U II 367.007 nm, and U II 409.013 nm lines in the uranium ore, only the U II 409.013 nm line exhibits a higher signal-to-noise ratio and is unaffected by interference from other lines at low mass fraction (Fig.3). In a helium atmosphere, the signal-to-noise ratio of U II 409.013 nm increases by 1.37 times from 13.29 to 31.45. Additionally, the signal-to-noise ratio reaches 8.9 at a mass fraction of 0.0726%. During the study of the variation in the detection delay using FO-LIBS in a helium atmosphere (Fig.4), the signal-to-noise ratio of the characteristic spectral lines remains above 10 until a delay of 1000 ns; however, it rapidly decreases to approximately 5 after a delay of more than 1000 ns. The signal-to-background ratio exhibits a peak of approximately 2.4 at a delay of 1000 ns and continues to increase subsequently when the delay is over 1200 ns, primarily owing to the rapid decay of the background intensity in the later stage of the plasma compared to those of the spectral lines. Therefore, a detection delay of 1000 ns is selected as the optimal value. Finally, a comparison of the results of the univariate calibration, multivariate linear regression using PLSR, and multivariate linear regression using constrained GA (Fig.8) shows that the prediction results obtained using multivariate linear regression are closer to the reference values than those obtained using univariate calibration based on spectral intensity alone. This indicates that the multivariate regression approach can correct for the matrix effects. The R2 (coefficient of determination) values of the calibration models based on PLSR and GA have both the training set and leave-one-out cross-validation (LOOCV) greater than 0.99, indicating the accuracy and robustness of these models. A comparison of PLSR and GA shows that the PLSR model exhibits superior calibration accuracy with a higher R2 and lower root mean square error in LOOCV. By constraining parameter k to positive values using the GA, the calibration accuracy decreases slightly; however, the relative standard deviation (RSD) decreases, resulting in improved prediction stability. The limits of detection and quantification are estimated as 142 mg/kg and 426 mg/kg, respectively.
This study investigates a uranium detection method based on FO-LIBS to meet the demand for rapid, on-site, and in-situ uranium detection in the nuclear industry. Among the dense spectra containing multiple elements, the uranium spectral line U II 409.013 nm is selected. The enhancement effect of the helium atmosphere on the uranium spectral line is explored. For the sample with a uranium mass fraction of 0.425%, the helium atmosphere improves the signal-to-noise ratio of the spectral line by 1.37 times. In addition, the detection delay of the system is optimized, and a peak in the signal-to-background ratio is observed at 1000 ns, which is determined to be the optimal delay for quantitative analysis. Under optimal conditions, the signal-to-noise ratio of the uranium spectral line is 8.9 in a sample with a mass fraction of 0.0726%. A multivariate linear regression model based on the internal standard method is proposed to address the matrix effect caused by differences in the chemical compositions of the natural samples in the experiments. The spectral lines of the matrix elements are introduced for calibration. The fitting parameters are obtained using PLSR and a constrained GA, with PLSR exhibiting superior quantitative performance in terms of R2 and RMSEC. The calibration model achieves an R2 of 0.9984 for uranium and an RMSEC of 0.0404%. Furthermore, the limit of detection for uranium using FO-LIBS is estimated to be 142 mg/kg, and the limit of quantification is 426 mg/kg.
1 引言
核工业是高科技战略产业,是****的重要基石[1],涉及矿石勘探开采、铀提取、同位素分离、反应堆发电、乏燃料后处理等。铀元素在核材料中的测量是研究和生产过程中的重要共性技术,可为核燃料循环、核保障监督、核库存管理等提供重要支撑[2]。当前,铀元素的常规检测方法包括化学滴定法、电感耦合等离子体质谱法/光谱法(ICP-MS/OES)[3-4]等。这些方法虽然准确率高,但样品,特别是具有放射性的样品,处理流程比较复杂,处理大量样本时耗时较长。
激光诱导击穿光谱(LIBS)技术是一种原子发射光谱技术,其原理为:纳秒脉冲激光辐照样品表面(辐照度通常高于GW/cm2量级),样品被迅速加热后熔化、气化并被部分电离,形成激光诱导等离子体(LIP),通过分析等离子体发射光谱可以实现对样品中元素组分的定性识别和定量测量[5]。LIBS技术以其快速检测、无损、无需预处理等优势,在生物医学、冶金分析、环境检测等领域被广泛应用[6-8]。
LIBS应用于铀元素测量时,由于等离子体中激发态铀粒子能量分布的能级比较广泛,自发衰减跃迁方式多样,因此其发射谱线的数量较多,而且强度低于铝、铜、铬等金属元素,很容易被其他谱线和背景噪声所覆盖[9]。近年来,在优化铀元素谱线的LIBS检测方面,研究人员对气氛条件[10]、激光辐照度[11]、二维光谱测量[12]、双脉冲系统[13]、空间约束[14]等开展了探索。2009年,Chinni等[15]在氩气气氛下研究了土壤基质中的铀谱线,他们通过优化气氛条件使检测限最终达到了0.26%。2012年,Kim等[16]在10 mJ的能量下,通过积累690幅光谱和使用铁光谱内标法,使铀元素的检测限达到了158 mg/kg。2016年,Skrodzki等[17]对比了双脉冲和单脉冲激光设置对铀谱线的增强效果,结果显示:双脉冲条件下U I 356.18 nm谱线的信噪比相比单脉冲条件下增加了1.5倍,等离子体的平均激发温度上升了10%。舒开强等[18]引入支持向量机和主成分回归模型校正铀矿基质效应造成的光谱抖动,将决定系数R2从0.93提升到0.99。张志威等[19]对铀元素含量不同的土壤样品和二氧化硅样品进行激发(结合光电双脉冲增强),使土壤中铀元素的检测限达到了108 mg/kg。清华大学的王哲课题组[20]先将光束整形至平顶模式,以有效降低等离子体屏蔽效应和波动性;然后在160 mJ激光能量下,采用LIBS技术对矿石中的铀元素进行探测,实现了21.2 mg/kg的检测限。
上述工作表明,铀元素检测限可达到百mg/kg等级[21]。但是,这些都是在实验室内采用高斯单模激光直接聚焦实现的,在实际应用中,含铀样品具有一定的放射性,高斯单模激光难以应用。光纤式激光诱导击穿光谱系统采用数十米长的柔性光纤传输脉冲激光和光谱信号,激光器和光谱可以远离待测样品,更适合应用于具有复杂排布的场景或狭小空间。英国Applied Photonics公司研制了核电用光纤式激光诱导击穿光谱(FO-LIBS)装置,其光纤长度达到了75 m,并成功完成了英国Hinkley Point B核电机组蒸汽过热器管道的Cu元素测量,检测限达到了1%,定量误差为15%[22]。为检查福岛核电站事故后核反应堆残骸的元素组分,日本开发了FO-LIBS装置,并采用该装置对水下反应堆模拟碎片样品进行了测量,结果显示Zr/Ce、Fe/Ce的检测限分别为0.0161、0.0139[23]。在FO-LIBS系统中,光束经由多模光纤传输后呈“平顶”形貌,降低了聚焦光斑的峰值辐照度[24],导致等离子体发光弱、痕量元素的探测灵敏度降低[25]。因此,采用FO-LIBS系统对铀元素进行检测更具挑战。
针对上述问题,本课题组建立了FO-LIBS系统,研究了环境气氛对铀发射谱线演化特性的影响规律,给出了优化的探测延时参数,探讨了铀矿样品的基质效应,提出了多元定标定量分析方法。所提多元定标定量分析方法在保证模型泛化性能的同时有效提高了定标和预测精度,为铀矿石的快速成分分析提供了一种新手段。
2 实验与方法
2.1 FO‑LIBS实验系统
所采用的实验系统示意图如
为降低铀矿石样品中元素不均匀分布以及激光能量波动造成的影响,在每个位置累加20激光发次的光谱。本文报道的数据点均是对每种样品重复采集40组光谱后取平均值得到的。
2.2 样品制备
使用国家铀矿石标准物质系列样品开展实验,标准物质的铀含量在
表 1. 标准样品中铀元素及其他组分的质量分数
Table 1. Mass fraction of uranium element and other components in standard samples
| |||||||||||||||||||||||||||||||||||
表 2. 混合样品的混合比例和铀含量
Table 2. Mixing ratio and uranium content of mixed samples
|
3 结果与讨论
3.1 系统参数优化
由于铀元素谱线强度低且数量多,而且矿石样本中的元素种类丰富,进一步增加了光谱识别的难度,因此,铀谱线易与其他谱线重叠或被背景遮盖。为了确定高强度的铀元素谱线,选择铀质量分数为3.29%的矿石样本进行分析,其原始光谱如

图 2. GBW04101样本中铀及其他元素谱线的识别
Fig. 2. Identification of spectral lines of uranium and other elements in GBW04101 sample
相比于单模高斯光束直接聚焦在样品表面的常规LIBS,FO-LIBS中光纤馈出激光时的发散角导致了更低的能量密度,需要采取额外的增强手段。首先通过调节环境气氛和系统参数的方法提高谱线的信噪比。

图 3. 铀质量分数分别为0.0726%、0.219%、0.425%的样本在空气和氦气气氛下的铀谱线。(a)(b)U I 356.659 nm;(c)(d)U II 367.007 nm;(e)(f)U II 409.013 nm
Fig. 3. Uranium spectral lines of the samples with mass fraction of 0.0726%, 0.219%, and 0.425% in air and He atmosphere. (a)(b) U I 356.659 nm; (c)(d) U II 367.007 nm; (e)(f) U II 409.013 nm
在氦气环境中,铀质量分数为0.425%的样本的U II 409.013 nm谱线的信噪比为31.45,相比空气中的信噪比(13.29)增大了1.37倍;同时,铀质量分数为0.0726%的样本的U II 409.013 nm谱线的信噪比达到了8.9,满足谱线信噪比大于3的定性识别要求。

图 4. 氦气气氛中铀谱线及其信背比、信噪比和净强度随探测延时的变化。(a)谱线随探测延时的变化;(b)谱线信背比、信噪比和净强度随探测延时的变化
Fig. 4. Variations of uranium spectral lines and their signal-to-background ratio (SBR), signal-to-noise ratio (SNR), and net intensity with detection delay in He atmosphere. (a) Variation of spectral line with detection delay; (b) variation of SBR, SNR, and net intensity of the spectral lines with detection delay
3.2 基质校正算法及铀元素定标
不同类型矿石在成分、微观结构上的差异使得其在同等制样条件下的表面强度存在显著差异,导致明显的基质效应,进而导致光谱信号发生波动。
根据激光诱导等离子体理论,原子特征谱线发射强度为
式中:Iji为谱线发射强度;λji为发射谱线的波长;Aji为跃迁概率;Ej为激发态能级的能量;gj为激发态的统计权重;Te为等离子体温度;KB、h、c分别为玻尔兹曼常数、普朗克常数和光速;Ns为等离子体中该元素的原子或离子的数密度;Uj(Te)为相应的跃迁粒子的配分函数。上述参数均可从美国国家标准与技术研究院(NIST)原子光谱数据库中查询得到。
通常采用内标法来减小测量过程中的不稳定性。内标法表达式为
式中:I为谱线强度;n为元素的质量分数;k为定标模型的斜率。由于天然矿石样本中的每种元素的含量有明显的区别,因此,基于内标法原理,在引入除目标元素外的多个基质元素后,将
式中:IU和Ii分别为目标元素和基质元素的光谱强度;nU、ni分别为目标元素和基质元素的质量分数。当选取的基质元素质量分数之和接近100%时,
在诸如
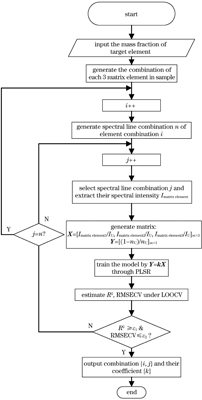
此外,定标所用样本数量有限,若同时使用数量过多的谱线进行拟合,则可能会造成严重的过拟合现象。因此,应适当限制同时使用的基质元素的数量,并采用留一法交叉验证(LOOCV),以便在不影响定标精度的前提下保证模型的泛化能力。综合考虑后,笔者选择了3个元素。同时,笔者建立了一套通过查找谱线库来训练定标模型的流程,如

图 6. 基质校正训练流程图(R2:决定系数;RMSECV:交叉验证的均方根误差;ε1:准许的最小决定系数;ε2:准许的最大均方根误差)
Fig. 6. Flow chart of matrix correction training (R2: coefficient of determination; RMSECV: root mean square error of cross verification; ε1: acceptable minimum coefficient of determination; ε2: acceptable maximum root mean square error of cross verification)
在解决多元线性拟合问题时,笔者对比了偏最小二乘法回归(PLSR)和遗传算法(GA)的拟合效果。其中:PLSR通过构建自变量与因变量相互正交的特征向量来建立自变量与因变量的特征向量之间的一元线性回归关系,不仅克服了共线性问题,还在选取特征向量时强调了自变量对因变量的解释和预测作用,去除了对回归无益的噪声的影响,使模型包含最少的变量数。GA是在自然进化理论启发下发展的一系列搜索算法,它通过模仿自然选择和繁殖的过程,为涉及搜索、优化和学习的各种问题提供高质量的解决方案;由于类似于自然进化,GA可以克服传统搜索和优化算法遇到的一些障碍,在解决具有大量参数和复杂数学表示形式的问题上具有巨大优势。对于基于
接下来分别采用PLSR、GA获取拟合参数。采用PLSR得到的最优谱线组合为Si I 298.7645 nm、Fe I 370.9246 nm和Ca I 422.673 nm,这些谱线的信息如
表 3. 输入多元线性回归模型的元素谱线信息
Table 3. Information of element spectral lines used in multiple linear regression model
|
基于多元线性回归模型和

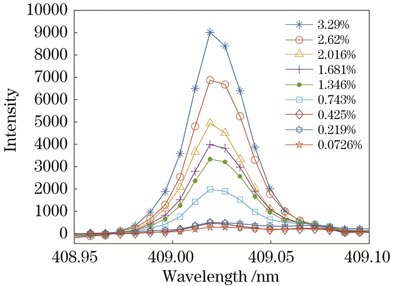
图 7. 铀质量分数不同的标准样品和混合样品的U II 409.013 nm谱线
Fig. 7. U II 409.013 nm spectral line of standard and mixed samples with different uranium mass fractions
模型的评价指标包括决定系数R2、校准均方根误差(在公式中记为eRMSEC)、交叉验证的均方根误差(在公式中记为eRMSECV)、相对标准偏差(在公式中记为dRSD)、检测限(LOD,在公式中记为fLOD)、定量限(LOQ,在公式中记为fLOQ)和,它们的计算公式分别为
式中:n为每m次检测的质量分数的数量;Ncv为交叉验证的样本数;

图 8. 定标曲线。(a)传统光谱信息定标;(b)PLSR基质校正;(c)GA回归基质校正
Fig. 8. Calibration curves. (a) Traditional spectral information calibration; (b) PLSR matrix correction; (c) GA regression matrix correction
表 4. 三种回归方法下的定标指标
Table 4. Calibration indices under three regression methods
| ||||||||||||||||||||||||||
相对于光谱净强度单变量定标,多元线性回归的预测结果更接近参考值,这意味着其能够达到校正基质效应的目的。
本研究与其他研究的定标结果比较如
表 5. 本研究与其他研究的实验参数和定标结果比较
Table 5. Comparison of experimental parameters and calibration results between this study and other studies
|
4 结论
面向核工业对铀元素快速、原位、现场检测的需求,笔者研究了基于FO-LIBS的铀元素含量检测方法。在具有多种元素的密集光谱中筛选出U II 409.013 nm铀谱线,探究了氦气气氛对铀谱线的增强效果。在铀元素质量分数为0.425%的矿石样本中,氦气气氛可使谱线的信噪比提高1.37倍。同时,优化了系统探测延时,在1000 ns处信背比出现峰值,故将1000 ns设为定量分析的最佳延时。在最优条件下,铀质量分数为0.0726%的矿石样本中铀谱线的信噪比达到了8.9。
为解决实验中天然样品化学成分差距导致的基质效应,提出了基于内标法的多元线性回归模型,引入基质元素谱线加以校正。分别通过PLSR和有约束的GA获取拟合参数,结果显示,PLSR在R2和RMSEC等定量指标上表现更加优异:对铀元素的定标决定系数R2达到了0.9984,RMSEC为0.0404%。另外,计算得到FO-LIBS对铀的检测限为142 mg/kg,定量限为426 mg/kg。本文在10 mJ级激光能量下达到了与实验室直接聚焦相近的检测限,对铀矿石、反应堆异物和核电站事故堆芯产物中铀元素的现场原位检测提供了技术支撑。
[1] 潘建均, 康椰熙, 李筱珍, 等. 我国核工业标准化研究的演进、热点与前沿: 基于中国知网1980—2021年文献的科学计量分析[J]. 科技管理研究, 2022, 42(9): 31-40.
Pan J J, Kang Y X, Li X Z, et al. Evolution, hotspots, and frontiers of standardization research in China’s nuclear industry: scientific econometric analysis based on the literature of CNKI from 1980 to 2021[J]. Science and Technology Management Research, 2022, 42(9): 31-40.
[2] Wu J, Qiu Y, Li X W, et al. Progress of laser-induced breakdown spectroscopy in nuclear industry applications[J]. Journal of Physics D: Applied Physics, 2020, 53(2): 023001.
[3] 付琳, 王玉学, 魏代东, 等. 电感耦合等离子体光谱-质谱法联合测定铀化合物粉末中20种杂质元素[J]. 化学分析计量, 2022, 31(8): 17-21.
Fu L, Wang Y X, Wei D D, et al. Determination of 20 impurity elements in uranium compound by inductively coupled plasma spectroscopy and mass spectrometry[J]. Chemical Analysis and Meterage, 2022, 31(8): 17-21.
[4] 侯列奇, 王树安, 李洁, 等. 电感耦合等离子体原子发射光谱法测定铀-钼合金中15种微量杂质元素[J]. 理化检验-化学分册, 2007, 43(3): 179-181, 184.
Hou L Q, Wang S A, Li J, et al. ICP-AES determination of micro-amounts of 15 elements present as impurities in uranium-molybdenum alloy[J]. Physical Testing and Chemical Analysis Part B (Chemical Analysis), 2007, 43(3): 179-181, 184.
[5] 杨雪, 张丹, 陈安民, 等. 聚焦透镜到样品表面的距离对激光诱导硅等离子体原子谱线强度和离子谱线强度的影响[J]. 中国激光, 2019, 46(11): 1111001.
[6] 李铸, 张庆永, 孔令华, 等. 基于激光诱导击穿光谱与随机森林识别GCr15钢的硬度[J]. 中国激光, 2022, 49(9): 0911002.
[7] 孟德硕, 赵南京, 刘文清, 等. 激光诱导击穿光谱结合标准加入法定量检测土壤中Cr[J]. 中国激光, 2014, 41(7): 0715002.
[8] 陈兴龙, 董凤忠, 陶国强, 等. 激光诱导击穿光谱在地质录井岩性快速识别中的应用[J]. 中国激光, 2013, 40(12): 1215001.
[9] Barefield J E, Judge E J, Campbell K R, et al. Analysis of geological materials containing uranium using laser-induced breakdown spectroscopy[J]. Spectrochimica Acta Part B: Atomic Spectroscopy, 2016, 120: 1-8.
[10] Taylor N R, Phillips M C. Differential laser absorption spectroscopy of uranium in an atmospheric pressure laser-induced plasma[J]. Optics Letters, 2014, 39(3): 594-597.
[11] Sarkar A, Alamelu D, Aggarwal S K. Laser-induced breakdown spectroscopy for determination of uranium in thorium-uranium mixed oxide fuel materials[J]. Talanta, 2009, 78(3): 800-804.
[12] Phillips M C, Brumfield B E, LaHaye N, et al. Two-dimensional fluorescence spectroscopy of uranium isotopes in femtosecond laser ablation plumes[J]. Scientific Reports, 2017, 7: 3784.
[13] Zhang Z, Wu J, Hang Y H, et al. Quantitative analysis of chlorine in cement pastes based on collinear dual-pulse laser-induced breakdown spectroscopy[J]. Spectrochimica Acta Part B: Atomic Spectroscopy, 2022, 191: 106392.
[14] 李佶龙, 王傲松, 刘彦章, 等. 平板约束下激光诱导等离子体的动态仿真[J]. 光子学报, 2020, 49(2): 0230002.
[15] Chinni R C, Cremers D A, Radziemski L J, et al. Detection of uranium using laser-induced breakdown spectroscopy[J]. Applied Spectroscopy, 2009, 63(11): 1238-1250.
[16] Kim Y S, Han B Y, Shin H S, et al. Determination of uranium concentration in an ore sample using laser-induced breakdown spectroscopy[J]. Spectrochimica Acta Part B: Atomic Spectroscopy, 2012, 74/75: 190-193.
[17] Skrodzki P J, Becker J R, Diwakar P K, et al. A comparative study of single-pulse and double-pulse laser-induced breakdown spectroscopy with uranium-containing samples[J]. Applied Spectroscopy, 2016, 70(3): 467-473.
[18] 舒开强, 陈友元, 彭郑英, 等. 铀矿中多目标元素的激光诱导击穿光谱定量分析方法研究[J]. 分析化学, 2023, 51(7): 1195-1207.
Shu K Q, Chen Y Y, Peng Z Y, et al. Laser-induced breakdown spectroscopy for quantitative analysis of multi-target elements in uranium ore[J]. Chinese Journal of Analytical Chemistry, 2023, 51(7): 1195-1207.
[19] 张志威, 邱荣, 姚胤旭, 等. 铀元素的激光诱导击穿光谱测量分析[J]. 光谱学与光谱分析, 2023, 43(1): 57-61.
[20] Ji J X, Song W R, Hou Z Y, et al. Raw signal improvement using beam shaping plasma modulation for uranium detection in ore using laser-induced breakdown spectroscopy[J]. Analytica Chimica Acta, 2022, 1235: 340551.
[21] Han S K, Park S H, Ahn S K. Quantitative analysis of uranium in electro-recovery salt of pyroprocessing using laser-induced breakdown spectroscopy[J]. Plasma Science and Technology, 2021, 23(5): 055502.
[23] Saeki M, Iwanade A, Ito C, et al. Development of a fiber-coupled laser-induced breakdown spectroscopy instrument for analysis of underwater debris in a nuclear reactor core[J]. Journal of Nuclear Science and Technology, 2014, 51(7/8): 930-938.
[24] 吕启深, 邱岩, 唐峰, 等. 采用光纤传输激光的激光诱导击穿光谱系统参数[J]. 高电压技术, 2020, 46(9): 3301-3310.
Lü Q S, Qiu Y, Tang F, et al. Parameters of laser-induced breakdown spectroscopy system using fiber-optic transmission laser[J]. High Voltage Engineering, 2020, 46(9): 3301-3310.
[25] Qiu Y, Wu J, Zhang Z, et al. Comparisons of laser-produced plasma in atmosphere between fiber-delivery and direct-focusing laser pulse[J]. Spectrochimica Acta Part B: Atomic Spectroscopy, 2019, 155: 12-23.
[26] Iida Y. Effects of atmosphere on laser vaporization and excitation processes of solid samples[J]. Spectrochimica Acta Part B: Atomic Spectroscopy, 1990, 45(12): 1353-1367.
[27] 曹椋焱, 李光布, 李景辉. 遗传算法的分析及其改进[J]. 计算机仿真, 2009, 26(7): 228-231.
Cao L Y, Li G B, Li J H. Analysis of genetic algorithm and its modification[J]. Computer Simulation, 2009, 26(7): 228-231.
[28] Jung E C, Lee D H, Yun J I, et al. Quantitative determination of uranium and europium in glass matrix by laser-induced breakdown spectroscopy[J]. Spectrochimica Acta Part B: Atomic Spectroscopy, 2011, 66(9/10): 761-764.
郭歆宇, 吴坚, 时铭鑫, 朱欣欣, 邱岩, 李京徽, 吴迪, 宋自远. 基于多元定标法的矿物铀元素光纤式激光诱导击穿光谱定量分析[J]. 中国激光, 2024, 51(8): 0811001. Xinyu Guo, Jian Wu, Mingxin Shi, Xinxin Zhu, Yan Qiu, Jinghui Li, Di Wu, Ziyuan Song. Quantitative Measurement of Uranium in Ore Using Fiber‑Optic Laser‑Induced Breakdown Spectroscopy and Multivariate Calibration[J]. Chinese Journal of Lasers, 2024, 51(8): 0811001.


