利用FLUKA程序模拟长脉冲激光等离子体相互作用中自生磁场的质子成像诊断  下载: 576次
在激光等离子体相互作用中,各种不同的物理机制将会激发产生强度高达100 T量级的自生磁场。针对前人开展的纳秒激光与等离子体相互作用中自生磁场的质子成像诊断实验,通过分析实验结果并提取磁流体力学模拟中所呈现出的磁场基本特征,对磁场形式进行了假设,并应用蒙特卡罗粒子输运程序FLUKA对质子成像过程进行了大量模拟,得到了与实验结果吻合度较高的磁场分布。通过比较发现:FLUKA模拟得到的磁场的峰值强度以及峰值强度随时间的演化规律与前人LASNEX模拟结果基本吻合,而磁场分布范围大于LASNEX模拟中的结果,这可能是由于磁扩散的影响和欠稠密等离子体的存在。
In laser-plasma interactions,a magnetic field with a strength up to 100 T magnitudes can be generated as a result of different physical mechanisms.In recent years,many achievements have been made in theoretical and experimental research on self-generated magnetic fields,including proton radiography diagnostics of magnetic fields.
In Ref.[12],time-resolved monoenergetic proton radiography was used to measure the magnetic field generated in nanosecond laser foil interactions.The 2D hydrodynamic program LASNEX was used to simulate magnetic field generation and evolution,and the hybrid particle-in-cell program LSP was used to calculate the image formed by the proton beam deflection due to the applied magnetic field.
The circular ring structure and overall deformation structure are reproduced almost exactly by LASNEX+LSP simulations.However,considering the mean radius of the ring and the deflection of each beamlet,there remain differences between the experimental results and the LASNEX+LSP results at 0.6 ns,0.9 ns,and 1.2 ns.
In this study,we attempt to determine the magnetic field distribution that matches the experimental results using the Monte Carlo particle transport program.
FLUKA is a versatile Monte Carlo particle transport program that can perform calculations about particle transport and interactions with matter.As it can reasonably consider the interaction between protons and matter and couple a magnetic field with a certain spatial distribution into the program,it can be used in the calculations of the proton radiography of the self-generated magnetic field,which is the focus of this study.
Based on the understanding of the generation mechanisms of the magnetic field,the features of the magnetic field distributions obtained via LASNEX simulations,and the displacement of each proton beamlet obtained from the experimental results in Ref.[12],we assume that the magnetic fields have the form
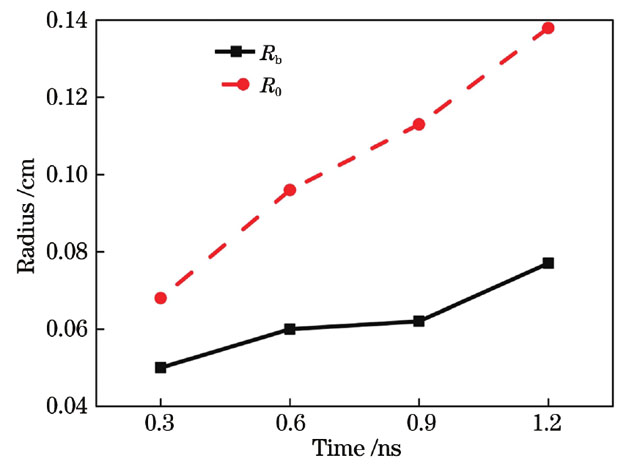
The spatial distributions and time evolution of the magnetic field deduced from FLUKA and those calculated from LASNEX are compared and analyzed.First,we find that the peak intensity of the magnetic field increases during the laser pulse,reaching 38 T at 0.9 ns,and decreases when the laser is switched off(Fig.4),which is consistent with the LASNEX results.Second,we roughly estimate the speed of plasma expansion when the laser is on according to the evolution of the radius of magnetic field(Fig.6).Third,we find that the range of the magnetic field inferred from the FLUKA calculations(Fig.7 and Table 1)is larger than that calculated from the LASNEX simulations.One main reason for this is the influence of magnetic field dissipation.Another reason is the existence of an under-dense plasma region with a small temperature gradient before the critical surface.
The distribution of the magnetic field in long-pulse laser-plasma interactions is achieved in this study.We achieve good consistency with the proton radiography images obtained in Ref.[12]using the FLUKA simulations.The evolution of the peak intensity and bubble radius are examined.The range of the magnetic field is compared with that calculated using the hydrodynamic program,LASNEX.The field range is found to be larger than that obtained from the LASNEX simulations,and possible reasons for this are analyzed.FLUKA can be an efficient tool for obtaining a detailed and reasonable interpretation of experimental data,which is vital in proton radiography studies.
1 引言
随着激光等离子体物理的发展,超强激光与等离子体相互作用中产生的自生磁场受到广泛关注。近年来,关于自生磁场的理论研究和实验研究均取得了较多成果[1-3]。在实验上,利用质子成像技术[4-7]对电场、磁场的成像以及时间演化过程的诊断已经取得了一些进展,比如诊断自生磁场[8]、磁重联[9]、瑞利泰勒不稳定性[10-11]等实验工作。然而,如何应用数据反演方法获得与实验结果吻合的磁场分布,仍是一个亟待解决的问题,它对超强激光与等离子体相互作用中自生磁场的研究具有重要意义。
Li等[12]在激光设备上,采用20束驱动激光照射填充了D3He的靶,驱动了内爆过程,引发了核聚变,产生的各向同性的单能质子束可作为背照质子源;利用功率密度约为1014W/cm2、波长为0.351µm、脉宽为1 ns的激光照射CH薄膜靶产生了目标等离子体和磁场;在质子源与磁场之间加入网格,应用质子成像技术研究了纳秒激光与平面靶相互作用中产生的磁场的时间演化过程。研究者还使用2D磁流体力学程序LASNEX对激光等离子体相互作用中产生的自生磁场进行了模拟,并结合粒子模拟程序LSP计算了质子束在上述磁场作用下偏转后形成的图像,并与实验数据进行了对比。从早期(0.3、0.6、0.9、1.2 ns时刻)结果的对比中可以看出:质子成像结果中的圆环结构和网格的形变基本得到了复现,这表明磁流体力学程序LASNEX模拟得到的磁场与实验中的真实磁场在基本性质上是吻合的。然而,通过比较发现,0.6、0.9、1.2 ns时刻圆环结构的平均半径以及质子束的偏移量与实验结果之间存在一定的差别。以0.9 ns为例,圆环的平均直径在实验中约为11.5个原始网格周期,圆环内在直径方向上约有7个形变网格结构;而利用LASNEX计算得到的圆环平均直径仅约为9个原始网格周期,圆环内在直径方向上仅有5个形变网格结构。这说明利用磁流体力学程序模拟得到的磁场分布与实验中的磁场分布仍有差异。
本文通过对实验结果的分析以及对磁流体力学模拟中所呈现出的磁场基本特征的提取,对磁场形式进行了假设,并利用FLUKA[13]蒙特卡罗粒子输运程序模拟了自生磁场的质子成像实验过程。通过大量的计算以及与实验结果的细致比对,获得了与实验结果较为吻合的磁场分布。最后,对这一磁场的空间分布和时间演化过程进行了讨论。
2 FLUKA模拟
2.1 FLUKA参数设定
蒙特卡罗粒子输运程序FLUKA已被广泛用于解决三维粒子输运问题[13-16]。由于它能比较合理地考虑质子与各种三维几何构型的材料之间的相互作用过程,并能将具有一定空间分布形式的磁场耦合到程序中,因此可以对目前我们关心的自生磁场的质子成像进行理论计算。我们根据文献[12]中的质子成像实验的相应参数对FLUKA程序的输入文件进行了设置,如
2.2 FLUKA对质子成像的模拟
由于质子成像实验是利用质子束在三维磁场作用下偏转后形成的二维图像对磁场进行诊断,磁场的解具有非唯一性,这是质子成像研究无法避免的问题。因此,我们在计算过程中基于对磁场产生机制的理解,并借鉴磁流体力学程序模拟结果所呈现出的磁场基本特征,对磁场形式进行了合理的构造,并最终通过FLUKA进行了详细验算。在长脉冲激光与等离子体的相互作用过程中,磁场产生的主要机制是等离子体密度梯度和温度梯度的不平行性。在这一机制下,磁场的峰值会出现在温度梯度最大的位置处,磁场分布呈现出半球状空泡结构,磁场的能量主要分布在空泡表面附近。这一特征在文献[12]中的磁流体力学模拟中也得到了支持。此外,从质子成像的实验结果中可以看出,在激光脉冲持续时间内,磁场仍保持较好的轴对称性。根据上述特征,我们在计算过程中在磁场区域内构造了轴对称的具有半球状空泡结构的磁场形式。
同时,从文献[12]的实验结果中可以看到,网格的形变和质子束的偏转距离显著依赖于半径,因此我们在磁场形式中引入参数
我们对质子成像的图像进行了定量的分析,以确定磁场强度与距离d之间的依赖关系。
![磁场强度与距离d关系的确定过程。(a)偏转质子图像的一维分布[12];(b)未受扰动质子图像的分布;(c)有无磁场时的波束位置;(d)偏转距离ξ与d2的关系](/richHtml/zgjg/2022/49/24/2401001/img_02.jpg)
图 2. 磁场强度与距离d关系的确定过程。(a)偏转质子图像的一维分布[12];(b)未受扰动质子图像的分布;(c)有无磁场时的波束位置;(d)偏转距离ξ与d2的关系
Fig. 2. Determination of relationship between magnetic field intensity and distance d.(a)One-dimensional distribution of deflected proton images[12];(b)distribution of unperturbed proton images;(c)positons of each beamlet with magnetic field and without magnetic field;(d)ξ versus d2
由于质子束的偏转距离ξ与质子在积分路径上的∫B×dl(B为磁感应强度大小,dl为积分路径微元)成正比关系,因此我们假设磁场的基本形式为

图 3. 不同时刻的质子成像图。(a1)(b1)0.3 ns;(a2)(b2)0.6 ns;(a3)(b3)0.9 ns;(a4)(b4)1.2 ns
Fig. 3. Proton images at different moments.(a1)(b1)0.3 ns;(a2)(b2)0.6 ns;(a3)(b3)0.9 ns;(a4)(b4)1.2 ns

图 4. FLUKA程序模拟的不同时刻的磁场空间分布。(a)0.3 ns;(b)0.6 ns;(c)0.9 ns;(d)1.2 ns
Fig. 4. Spatial distributions of magnetic fields at different moments simulated by FLUKA program.(a)0.3 ns;(b)0.6 ns;(c)0.9 ns;(d)1.2 ns
除此之外,我们对质子束偏转后的一维强度分布进行了定量分析,进一步检验模拟中磁场的准确性。以质子成像图的中心位置作为参考位置,沿径向进行一维的强度分析,结果如

图 5. 不同时刻的质子束一维强度。(a)0.3 ns;(b)0.6 ns;(c)0.9 ns;(d)1.2 ns
Fig. 5. One-dimensional intensities of proton beams at different moments.(a)0.3 ns;(b)0.6 ns;(c)0.9 ns;(d)1.2 ns
3 长脉冲激光与等离子体相互作用中的自生磁场的讨论
在第2节中,我们利用FLUKA程序对长脉冲激光与固体等离子体相互作用过程中的早期自生磁场进行了反演,得到了不同时刻下磁场的形式。从磁场强度的演化上来看,在激光脉冲持续时间内,磁场的峰值强度逐渐增强,可达到38 T。在激光辐照结束后,峰值强度有所降低。利用FLUKA程序得到的磁场强度随时间的演化规律与文献[12]中利用LASNEX模拟得到的演化规律是吻合的。此外,38 T的峰值强度与Li等[12,17]提到的约50 T的峰值强度也基本吻合。
此外,从
表 1. FLUKA程序模拟得到的磁场空间分布数据
Table 1. Spatial distribution data of magnetic field obtained by FLUKA program simulation
|
接下来,我们着重比较并讨论磁场的空间分布。以0.6 ns时刻为例,磁流体力学模拟的磁场分布和FLUKA模拟结果之间的对比如
![0.6 ns时刻的磁场空间分布。(a)文献[12]中的结果;(b)FLUKA程序得到的结果](/richHtml/zgjg/2022/49/24/2401001/img_07.jpg)
图 7. 0.6 ns时刻的磁场空间分布。(a)文献[12]中的结果;(b)FLUKA程序得到的结果
Fig. 7. Spatial distributions of magnetic fields at 0.6 ns.(a)Result in Ref.[12];(b)result obtained by FLUKA program
从上述数据可以看出,利用FLUKA程序模拟得到的磁场的分布范围(我们认为这一磁场分布更贴近实验中的真实磁场)大于二维磁流体力学程序LASNEX计算得到的磁场范围。研究者已针对磁场演化后期(激光脉冲结束后)磁场空泡内外的不稳定性以及LASNEX的适用性进行了详细的讨论。在本文中,我们将主要针对激光等离子体相互作用早期的磁场分布及演化进行分析。
在激光与等离子体的相互作用中,磁场随时间的演化可描述为
另一方面的原因可能与电子的温度分布有关。激光在等离子体中传播时,将通过各种机制将能量传递给等离子体。在不同的密度区域,激光与等离子体相互作用的能量吸收机制不同。在亚临界密度面区域,等离子体主要通过逆韧致吸收、受激拉曼散射等机制被加热。此外,在临界密度面处,激光能量将通过共振吸收机制将能量传递给超热电子。在临界面附近,由于电子热传导受等离子体密度的影响很大,电子烧蚀深度较小,因此温度梯度很大,这也是自生磁场的峰值位置出现在这一位置的原因。然而,需要注意的是,由于激光在到达临界密度面之前会在等离子体内传播较长一段距离,在这个区域内,逆韧致吸收和受激拉曼散射等机制使得等离子体温度升高,而电子热传导将部分等离子体能量输送到高密度区,因此,在临界面外部也会存在一个温度变化相对缓慢、梯度较小的区域。这一温度分布在入射激光束波长短、脉冲长以及聚焦光斑大的情况下尤其需要注意。这可能是在相互作用早期磁场的空间分布范围就已经比较大的另一原因。
4 结论
针对前人开展的纳秒激光与等离子体相互作用中自生磁场的质子成像诊断实验结果,通过对磁场形式进行假设,结合蒙特卡罗程序FLUKA,对质子成像过程进行了大量计算。通过与实验结果的细致比对,获得了与实验结果吻合度较高的磁场分布。对磁场的峰值强度、空泡半径以及分布范围进行了讨论。实验中磁场的分布范围大于磁流体力学模拟结果,其主要原因可能是磁扩散的影响和欠稠密等离子体的存在。
[1] Zhang Z, Zhu B J, Li Y T, et al. Generation of strong magnetic fields with a laser-driven coil[J]. High Power Laser Science and Engineering, 2018, 6: e38.
[2] Tian J M, Cai H B, Zhang W S, et al. Generation mechanism of 100 MG magnetic fields in the interaction of ultra-intense laser pulse with nanostructured target[J]. High Power Laser Science and Engineering, 2020, 8: e16.
[3] Shokov D, Murakami M, Honrubia J J. Laserscalingfor generation of megatesla magnetic fields by microtube implosions[J]. High Power Laser Science and Engineering, 2021: 1-17.
[4] Rosenberg M J, Zylstra A B, Séguin F H, et al. A direct-drive exploding-pusher implosion as the first step in development of a monoenergetic charged-particle backlighting platform at the National Ignition Facility[J]. High Energy Density Physics, 2016, 18: 38-44.
[5] Masson-Laborde P E, Laffite S, Li C K, et al. Interpretation of proton radiography experiments of hohlraums with three-dimensional simulations[J]. Physical Review E, 2019, 99(5): 053207.
[6] Levy M C, Ryutov D D, Wilks S C, et al. Development of an interpretive simulation tool for the proton radiography technique[J]. The Review of Scientific Instruments, 2015, 86(3): 033302.
[7] Volpe L, Batani D, Vauzour B, et al. Proton radiography of laser-driven imploding target in cylindrical geometry[J]. Physics of Plasmas, 2011, 18(1): 012704.
[8] Sarri G, Macchi A, Cecchetti C A, et al. Dynamics of self-generated,large amplitude magnetic fields following high-intensity laser matter interaction[J]. Physical Review Letters, 2012, 109(20): 205002.
[9] Li C K, Séguin F H, Frenje J A, et al. Observation of megagauss-field topology changes due to magnetic reconnection in laser-produced plasmas[J]. Physical Review Letters, 2007, 99(5): 055001.
[10] Gao L, Nilson P M, Igumenschev I V, et al. Magnetic field generation by the Rayleigh-Taylor instability in laser-driven planar plastic targets[J]. Physical Review Letters, 2012, 109(11): 115001.
[11] Du B, Cai H B, Zhang W S, et al. A demonstration of extracting the strength and wavelength of the magnetic field generated by the Weibel instability from proton radiography[J]. High Power Laser Science and Engineering, 2019, 7: e40.
[12] Li C K, Séguin F H, Frenje J A, et al. Observation of the decay dynamics and instabilities of megagauss field structures in laser-produced plasmas[J]. Physical Review Letters, 2007, 99(1): 015001.
[13] FerrariA,SalaP R,FassoA,et al.FLUKA:a multi-particle transport code[R].New York: Office of Scientific and Technical Information(OSTI),2005.
[14] 鞠志萍, 曹午飞, 刘小伟. 质子散射角分布的蒙特卡罗模拟[J]. 物理学报, 2009, 58(1): 174-177.
Ju Z P, Cao W F, Liu X W. Study of scattering angular distribution of proton using Monte-Carlo method[J]. Acta Physica Sinica, 2009, 58(1): 174-177.
[15] 滕建, 曹磊峰, 范伟, 等. 微型轫致辐射X射线光源扰动器设计[J]. 强激光与粒子束, 2012, 24(5): 1107-1110.
[16] 闫永宏, 赵宗清, 吴玉迟, 等. 超短超强激光产生正电子的蒙特卡罗模拟[J]. 强激光与粒子束, 2012, 24(6): 1396-1400.
[17] Li C K, Séguin F H, Frenje J A, et al. Measuring E and B fields in laser-produced plasmas with monoenergetic proton radiography[J]. Physical Review Letters, 2006, 97(13): 135003.
高英英, 江小丹, 徐妙华, 李英骏. 利用FLUKA程序模拟长脉冲激光等离子体相互作用中自生磁场的质子成像诊断[J]. 中国激光, 2022, 49(24): 2401001. Yingying Gao, Xiaodan Jiang, Miaohua Xu, Yingjun Li. Proton Imaging Diagnosis of Spontaneous Magnetic Field in Long-Pulse Laser-Plasma Interactions Simulated by FLUKA Program[J]. Chinese Journal of Lasers, 2022, 49(24): 2401001.


