液晶与显示, 2023, 38 (4): 495, 网络出版: 2023-04-25
基于经验模态分解的激光散斑噪声抑制方法
Laser speckle noise suppression method based on empirical mode decomposition
图 & 表
图 1. 基于Mach-Zehnder干涉仪的数字记录光路原理图及实物图。(a)原理图;(b)实物图。
Fig. 1. Schematic diagram and physical diagram of digital recording optical path based on Mach-Zehnder interferometer.(a)Schematic diagram;(b)Physical diagram.
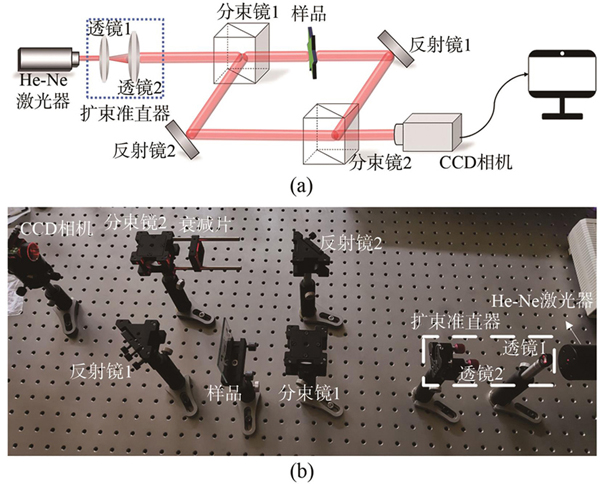
图 2. 样品及全息图。(a)样品板;(b)样品A;(c)样品B;(d)样品C;(e)样品D;(f)样品E;(g)样品A对应的全息图A;(h)样品B对应的全息图B;(i)样品C对应的全息图C;(j)样品D对应的全息图D;(k)样品E对应的全息图E。
Fig. 2. Samples and holograms.(a)Sample plate;(b)Sample A;(c)Sample B;(d)Sample C;(e)Sample D;(f)Sample E;(g)Hologram A corresponding to sample A;(h)Hologram B corresponding to sample B;(i)Hologram C corresponding to sample C;(j)Hologram D corresponding to sample D;(k)Hologram E corresponding to sample E.
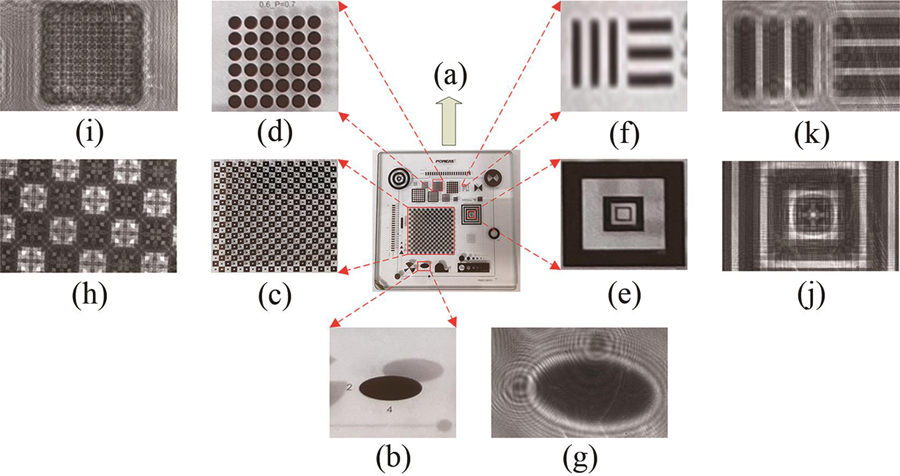
图 3. 选取不同IMF分量的重构结果。(a)选取
Fig. 3. Reconstruction results with different IMF components selected.(a)Reconstructed image with
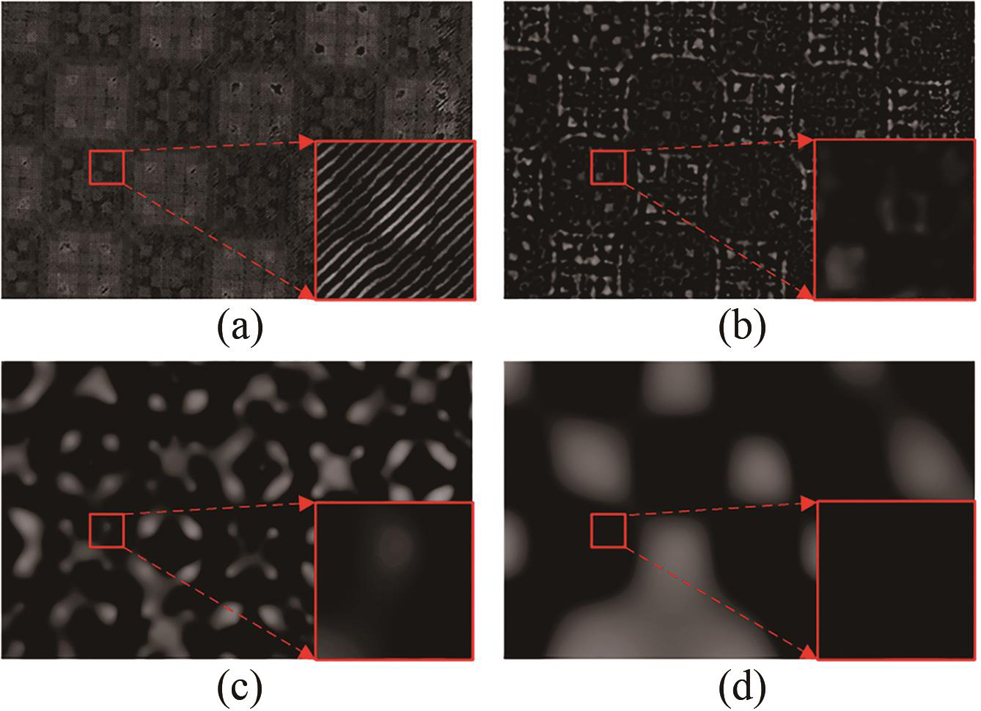
图 4. Canny算子边缘检测结果。(a)Canny算子对图3(a)的边缘检测结果;(b)Canny算子对图2(h)的边缘检测结果。
Fig. 4. Canny operator edge detection results.(a)Edge detection results of Canny operator for Fig.3(a);(b)Edge detection results of Canny operator for Fig.2(h).
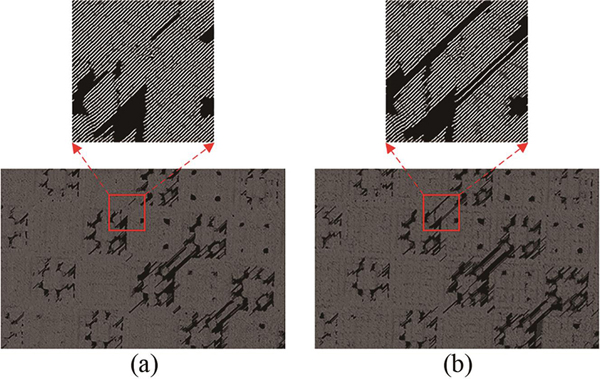
图 5. 经过所提出方法处理后的全息图。(a)全息图A;(b)全息图B;(c)全息图C;(d)全息图D;(e)全息图E。
Fig. 5. Holograms processed by the proposed method.(a)Hologram A;(b)Hologram B;(c)Hologram C;(d)Hologram D;(e)Hologram E.
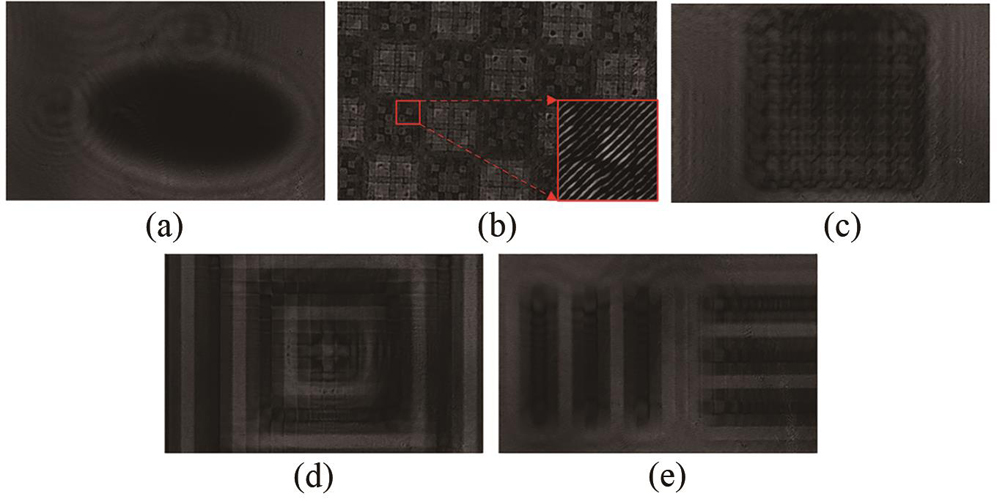
图 6. 经过所提出方法处理后的重建相位图和未去噪全息图的重建相位图对比。(a)全息图A经过所提出方法处理后重建的相位图;(b)全息图B经过所提出方法处理后重建的相位图;(c)全息图C经过所提出方法处理后重建的相位图;(d)全息图D经过所提出方法处理后重建的相位图;(e)全息图E经过所提出方法处理后重建的相位图;(f)未去噪全息图A的重建相位图;(g)未去噪全息图B的重建相位图;(h)未去噪全息图C的重建相位图;(i)未去噪全息图D的重建相位图;(j)未去噪全息图E的重建相位图。
Fig. 6. Comparison of the reconstructed phase maps after processing by the proposed method and the reconstructed phase maps without denoising holograms.(a)Reconstructed phase map of hologram A after processing by the proposed method;(b)Reconstructed phase map of hologram B after processing by the proposed method;(c)Reconstructed phase map of the hologram C after processing by the proposed method;(d)Reconstructed phase map of hologram D after processing by the proposed method;(e)Reconstructed phase map of the hologram E after processing by the proposed method;(f)Reconstructed phase map of hologram A without denoising;(g)Reconstructed phase map of hologram B without denoising;(h)Reconstructed phase map of hologram C without denoising;(i)Reconstructed phase map of hologram D without denoising;(j)Reconstructed phase map of hologram E without denoising.
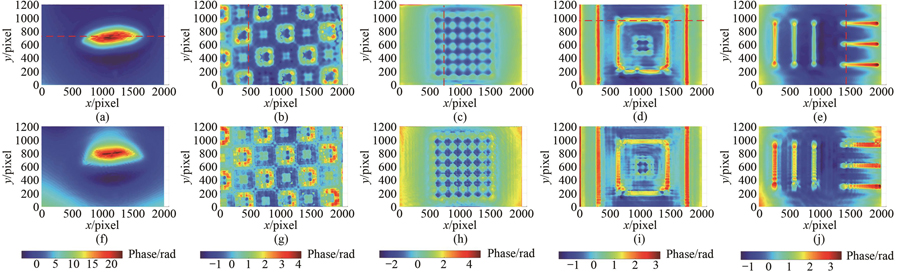
图 7. 全息图A、B、C、D、E经过基于Canny算子改进P-M方程法、均值滤波法与中值滤波法处理后重建的相位图。(a)~(e)经过基于Canny算子改进P-M方程法处理后重建的相位图;(f)~(j)经过均值滤波法处理后重建的相位图;(k)~(o)经过中值滤波法处理后重建的相位图。
Fig. 7. Reconstructed phase maps of hologram A,B,C,D and E after processing by the improved P-M equation method based on the Canny operator,mean filter method and median filter method.(a)~(e)Reconstructed phase maps after processing by the improved P-M equation method based on Canny operator;(f)~(j)Reconstructed phase maps after processing by the mean filtering method;(k)~(o)Reconstructed phase maps after processing by the median filter method.
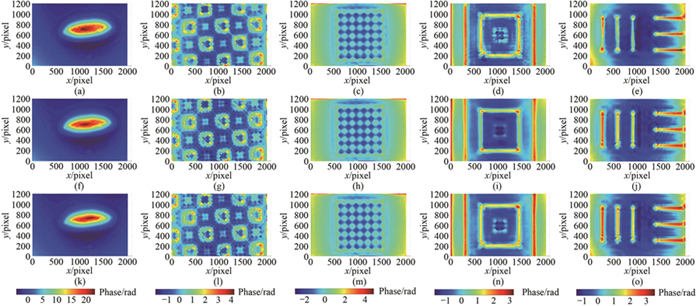
图 8. 图6(a)、图7(a)、图7(f)和图7(k)所示相位图与原始相位图在y=711处的截面曲线对比。
Fig. 8. Phase maps shown in Fig.6(a),Fig.7(a),Fig.7(f)and Fig.7(k)compared with the cross-sectional curves of the original phase map at y=711.
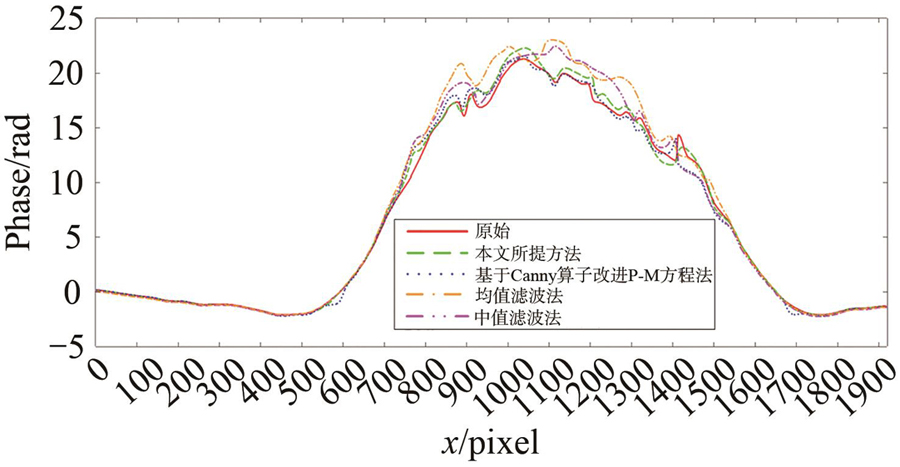
图 9. 图6(b)、图7(b)、图7(g)和图7(l)所示相位图与原始相位图在x=415处的截面曲线对比。
Fig. 9. Phase maps shown in Fig.6(b),Fig.7(b),Fig.7(g)and Fig.7(l)are compared with the cross-sectional curves of the original phase map at x=415.
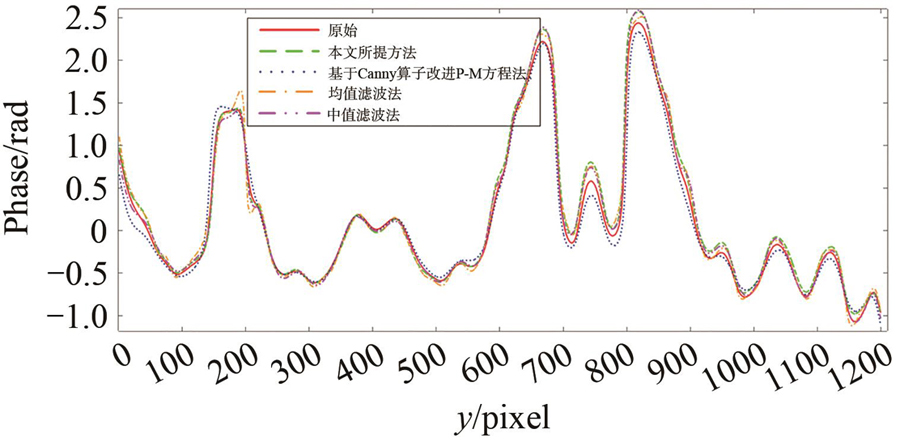
图 10. 图6(c)、图7(c)、图7(h)和图7(m)所示相位图与原始相位图在x=589处的截面曲线对比。
Fig. 10. Phase maps shown in Fig.6(c),Fig. 7(c),Fig.7(h)and Fig.7(m)compared with the cross-sectional curves of the original phase map at x=589.
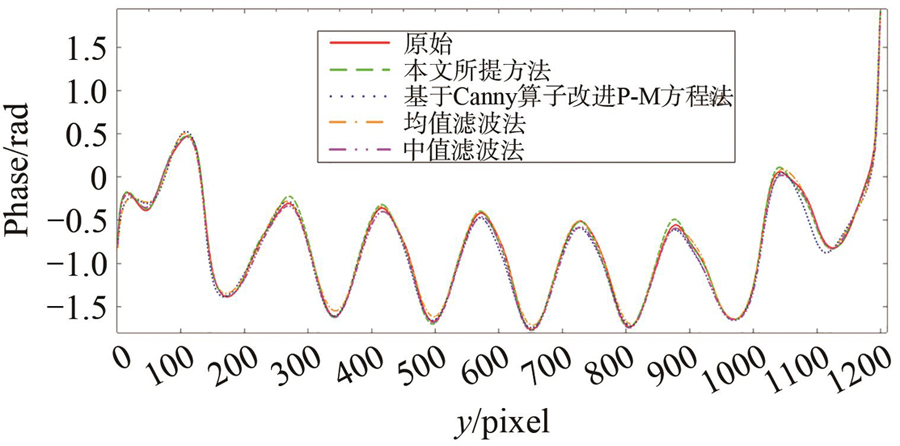
图 11. 图6(d)、图7(d)、图7(i)和图7(n)所示相位图与原始相位图在y=959处的截面曲线对比。
Fig. 11. Phase maps shown in Fig.6(d),Fig.7(d),Fig.7(i)and Fig.7(n)compared with the cross-sectional curves of the original phase map at y=959.
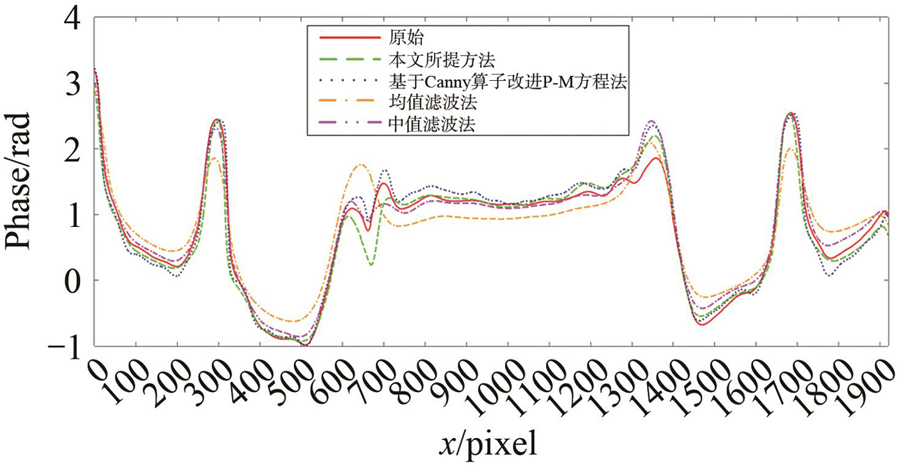
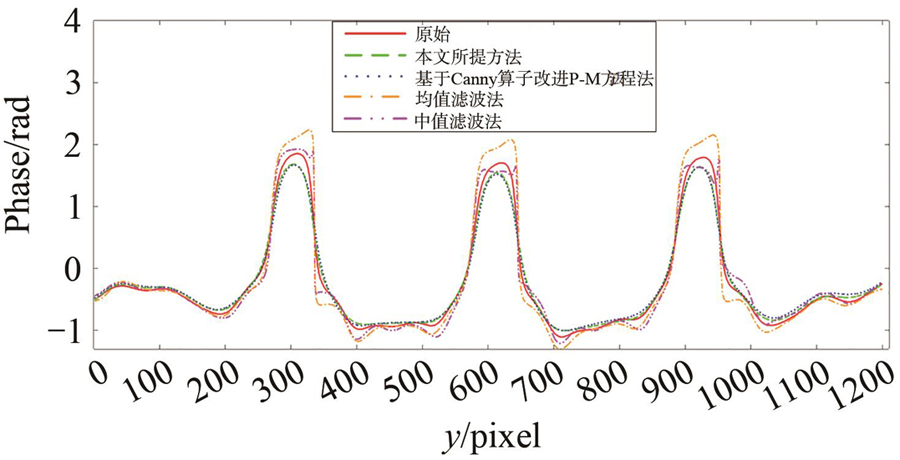
表 1不同散斑抑制方法的SSIM、EPI、SSI计算结果
Table1. Calculation results of SSIM,EPI and SSI for different speckle suppression methods
|
表 2绿色虚线、蓝色点、橙色点线和紫色双点线与红色实线的最大、最小、平均偏差
Table2. Maximum,minimum and average deviation of the green dashed line,the blue point,the orange point line and the purple double point line from the red solid line
|
詹晓江, 甘楚立, 丁毅, 胡轶, 许彬, 习江涛, 邓定南. 基于经验模态分解的激光散斑噪声抑制方法[J]. 液晶与显示, 2023, 38(4): 495. Xiao-jiang ZHAN, Chu-li GAN, Yi DING, Yi HU, Bin XU, Jiang-tao XI, Ding-nan DENG. Laser speckle noise suppression method based on empirical mode decomposition[J]. Chinese Journal of Liquid Crystals and Displays, 2023, 38(4): 495.


 PDF全文
PDF全文
