基于太赫兹光谱的华法林钠快速定性定量检测
Warfarin sodium stands out as the primary oral anticoagulant for treating pulmonary embolism, necessitating individualized dosage adjustments guided by post-administration blood concentration, typically maintained in the range of 2.23?2.30 nmol/mL. Common quantitative methods such as mass spectrometry (MS), liquid chromatography-mass spectrometry (LC-MS), and high-performance liquid chromatography-fluorescence detection (HPLC-FLD) suffer from the problems of expensive equipment, high consumable costs, and long analysis time (>30 min). In contrast, terahertz (THz) spectroscopy offers a solution by acquiring molecular fingerprinting properties. When combined with density functional theory (DFT) simulation, it is capable of predicting molecular spectral properties and analyzing vibrational modes. This combination has been widely used in drug studies. This study aims to establish a new method using THz spectroscopy for rapid qualitative and quantitative analysis in the clinical detection of warfarin sodium. The proposed method achieves high-sensitivity quantitative analysis of warfarin sodium with two indexes, and the minimum detection limit reaches 0.01 nmol/mL, which is lower than the clinical blood concentration.
This study employs the quantum chemistry software Gaussian 09 to theoretically analyze the molecular vibrational properties of warfarin sodium. Specifically, the DFT/B3LYP/3-21G basis set is used to predict the vibrational properties in the range of 10?16 THz. Concurrently, a Fourier transform infrared spectrometer is employed to perform qualitative and quantitative analysis on warfarin sodium. The samples for analysis are prepared by doping 20 μL warfarin sodium solutions on high-resistance silicon surface, followed by drying under vacuum conditions at 20 ℃. THz absorption spectra of warfarin sodium solutions, with concentrations in the range of 2?100 nmol/mL, are obtained at a resolution of 4 cm-1.
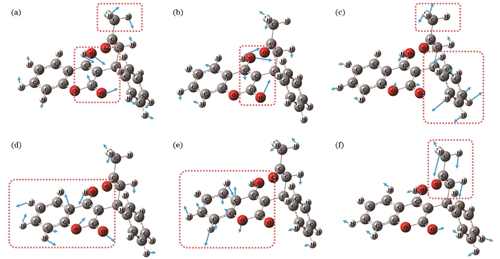
In this study, qualitative experimental tests on 2 mg warfarin sodium are performed to obtain the THz characteristic absorption spectrum. The results reveal clear absorption peaks at 11.10, 11.94, 13.05, 13.74, and 15.43 THz, along with a shoulder peak at 14.01 THz (Fig. 1). Meanwhile, the molecular theoretical spectrum of warfarin, obtained by DFT calculation, demonstrates six characteristic absorption peaks within the frequency range of 10?16 THz. These theoretical peaks are located at 11.07, 11.70, 13.28, 13.82, 14.27, and 15.71 THz (Fig. 2). Comparison of the theoretical spectra with the experimental spectra exhibits consistency (Table 1), and different experimental peaks arise from different molecular vibrational modes (Fig. 3). For quantitative analysis, experimental peaks at 12.05, 13.79, and 15.58 THz are selected owing to their distinct vibration modes and strong absorbance. The peak area and intensity of these peaks exhibit linear relationships with the concentration of warfarin sodium solutions (Fig. 4 and Fig. 5), with correlation coefficients exceeding 0.96, conforming to Beer-Lambert law. Based on these results, the detection sensitivity and limit of detection (LOD) are further determined (Table 2). The lowest LOD reaches 0.01 nmol/mL, which is lower than the clinical blood concentration. Therefore, a rapid and reliable quantitative analysis method for warfarin sodium is established based on its multiple THz characteristic peaks.
In this study, a rapid qualitative and quantitative analysis method for the anticoagulant drug warfarin sodium is developed based on THz spectroscopy. Through THz spectral experiments and DFT calculations, it is clarified that six characteristic peaks of warfarin sodium exist in the range of 10?16 THz, corresponding to the frequencies of 11.10, 11.94, 13.05, 13.74, 14.01, and 15.43 THz, respectively. The attribution of these peaks is analyzed, and a qualitative identification method for warfarin sodium is established. Subsequently, the THz spectra of warfarin sodium solutions with different concentrations are analyzed. The correlation between drug concentration and the peak intensity, along with the peak area is analyzed, and the quantitative detection curve of warfarin sodium is given. The sensitivity and detection limit are calculated. The results demonstrate that the peak intensity and peak area increase linearly with the increase in warfarin sodium concentration (the correlation coefficient is >0.96). Based on the peak area at 15.58 THz, the detection limit reaches 0.01 nmol/mL, which is lower than the clinical blood concentration (2.23?2.30 nmol/mL). This study proposes a rapid quantitative detection method of warfarin sodium and contributes to the development of blood drug concentration monitoring technology.
1 引言
肺栓塞(PE)是深静脉血栓[1]脱落后随着血液循环进入到肺部而引发的慢性疾病[2-3],其发病率高达2‰[4],在患者确诊后一年内的死亡率高达23%以上[5]。因此,预防血栓形成是PE治疗的关键,有助于降低患者死亡率并且改善患者的生存质量[6-7]。当前,抗凝疗法被认为是预防血栓形成的主要措施[8]。华法林钠(warfarin sodium)作为当前临床上应用最广泛的口服抗凝药物[9],具有显著的抗凝效果和经济优势,备受青睐[10]。其作用机制主要是抑制维生素K氧化还原酶的活化。该辅酶是肝脏细胞合成凝血因子和凝血酶的关键一环。一旦受到抑制,会影响凝血级联反应,降低血液的凝结能力,从而防治PE及其相关疾病[11]。研究数据已经证实,华法林钠能使PE的再发率从13%降至低于6%[12]。然而,由于患者在生理状况、体重、年龄等各方面存在差异,临床上必须根据每位患者用药后的血药浓度(通常在2.23~2.30 nmol/mL区间[13]),对华法林钠的给药剂量及疗程作出个性化调整,以确保患者能够获得最佳的治疗效果[14]。
目前,华法林钠的常规定量检测方法主要包括质谱法(MS)、液相色谱-质谱连用(LC-MS)、高效液相色谱-荧光检测法(HPLC-FLD)。2007年,Hou等[15]利用MS对人的血浆中的华法林的含量进行了测定,最低检测限为0.1 μg/mL。2015年,张雪等[16]采用LC-MS技术对犬的血浆中的华法林钠的浓度进行了测定,最低检测限达5 ng/mL。2022年,Putriana等[17]采用HPLC-FLD对血浆中的华法林的浓度进行了测定,最低检测限为18.6 ng/mL。然而,MS仪器价格昂贵,样品前处理过程繁琐(包括化学衍生化处理和反复提纯处理),难以满足临床血液分析低成本、高通量的使用需求;LC-MS技术在复杂生物样品检测(如血液分析)中具有高灵敏的突出优势,但需要使用高成本耗材(如色谱柱和质谱离子源部件),且分离纯化流程耗时长;HPLC-FLD的样品预处理流程相对简单,降低了成本,但对测试环境的要求较高,易出现假阳性和假阴性误判。综上所述,现有华法林钠定量测定方法存在着耗时(>30 min)较长、经济成本高等问题。如何能够快速、经济、准确地对华法林钠进行定性和定量分析,仍然是当前临床研究亟须解决的问题。
太赫兹(THz)辐射处于中红外和微波波段之间,其频率范围为0.1~20.0 THz[18]。这一频段涵盖了生物分子的大部分转动和振动能级。因此,太赫兹光谱技术具有探测分子内部相互作用和分子间相互作用引起的低频振动模式的能力,可为分子结构研究提供重要的信息[19-21]。同时,太赫兹光谱技术具有无损[22-23]、高分辨率[24-25]和高灵敏度[26-27]等优势,在化学药物分子的定性鉴别与定量研究中得到广泛应用[28-29]。在药物定性鉴别方面,太赫兹光谱技术能够实现手性分子、同分异构体以及同质多晶的鉴别分析,例如海藻绿素[30]、β-内酰胺类抗生素[31]和辛伐他汀[32]等;在药物定量分析方面,太赫兹光谱技术已经成功地用于单组分和多组分药物的定量分析,包括口服抗凝剂拜瑞妥[33]、鱼粉基质中的培氟沙星和氟罗沙星[34]等。然而,关于华法林钠的太赫兹光谱特性研究及定量分析的报道较少。2010年,Kostova等[35]利用密度泛函理论计算了华法林钠分子的振动光谱特性,并结合红外光谱技术,分析了华法林钠的中红外光谱特性。2013年,Mishra等[36]利用密度泛函理论,结合红外光谱技术,对华法林的两个手性异构体(S型和R型)进行了中红外光谱表征。上述研究结果表明,红外光谱与密度泛函理论模拟的组合是识别分子运动模式并解析官能团信息的有效方法。但这些工作尚未涉及华法林钠的太赫兹特征光谱,且尚未开展定量检测研究。
本文针对华法林钠的临床检测需求,提出了一种基于太赫兹光谱的快速定性定量检测分析新方法。主要研究内容包括:1)利用太赫兹光谱技术获取了华法林钠在10~16 THz波段的实验吸收谱。基于密度泛函理论进行了量化计算,分析了华法林钠太赫兹特征吸收峰对应的分子运动模式。结合实验谱图和理论分析,从分子基团层面建立了华法林钠的定性识别方法。2)研究了不同浓度的华法林钠水溶液在太赫兹波段的吸收特性,分析了其太赫兹特征峰属性(峰高和峰下面积)与药物浓度之间的相关性,建立了华法林钠的定量检测曲线,从而实现了对该药物的双指标高灵敏定量检测,满足了临床血药浓度监测需求。
2 材料与方法
2.1 材料
本文采用的材料为华法林钠标准品(C19H15NaO4,质量分数>99%),贮藏方式为在2~8 ℃下冷藏密封保存。去离子水由实验室水净化系统提供。
华法林钠定性实验样本的制备:使用精密电子天平称取2 mg华法林钠粉末,在3 MPa压力下将其制成片剂样品,其形状为直径为8 mm的圆形,上下表面平行且光滑。制样时确保质量损失不超过1%。样品配制完成后,放入密封袋以防受潮,并置于冰箱冷藏保存(2~8 ℃)。
华法林钠定量实验样本的制备:根据相关研究[13],人的血浆中的华法林的浓度范围为2.23~2.30 nmol/mL。因此,本文在配制定量实验样本时,将样本浓度设置在nmol/mL量级。使用精密电子天平称取0.33 mg华法林钠粉末并将其溶解在10 mL去离子水中,得到浓度为100 nmol/mL的华法林钠水溶液。以该溶液为母液进行梯度稀释,分别得到浓度为2、25、50、75 nmol/mL的华法林钠水溶液。制备好后的样本用封口膜密封,然后置于冰箱冷藏保存(2~8 ℃)。
2.2 方法
2.2.1 实验测试法
本文所用设备是傅里叶变换红外光谱仪。在远红外模式下,该设备的可测光谱范围为1~20 THz。在测试过程中,向样本仓注入高纯氮气,驱赶仓内水汽,从而降低水汽对实验结果的影响。在光谱中,每个数据点对应64次光谱扫描的平均结果,光谱分辨率设置为4 cm-1。
在定性实验中,测试样本为两个平行制备的压片,每个压片包含2 mg华法林钠,并进行2次光谱数据采集。在定量实验中,测试样本为浓度为2~100 nmol/mL的华法林钠水溶液。本文选用在太赫兹波段具有低电导率、高透过率的高阻硅片[37]作为背景基底。每个样本取20 μL,采用实验室自主研发的自动化滴样设备,以均匀的吐液速度将样本滴加在高阻硅片表面,然后在生物蒸发浓缩仪中在20 ℃真空条件下进行干燥处理,得到样品薄膜。利用精度为0.001 mm的数显测厚仪测量薄膜厚度,结果为(25±5)μm。接下来,将附有样本薄膜的高阻硅片置于光谱仪中,采集太赫兹吸收图谱。每个样本重复测量3次,计算平均值和标准偏差。
2.2.2 理论仿真法
华法林钠被人体吸收后,会转化为钠离子(Na+)和华法林分子,其中华法林分子发挥抗凝血作用。因此本文利用实际发挥抗凝作用的华法林分子构造分子仿真模型。基础模型来自PubChem Structure数据库,编号为54678486。本文使用Gaussian 09量子化学计算程序包[38]进行华法林钠分子的理论计算,具体包括分子结构优化、能量计算、振动频率计算。计算时选用密度泛函理论(DFT)方法,该方法利用电子密度描述多体量子系统,可避免波函数的复杂性,计算效率高。通过最小化系统总能量,利用交换相关能泛函预测原子和分子的结构和性质[39]。目前,DFT方法在预测分子光谱特性和分析分子振动模式方面已得到广泛应用,如原卟啉IX(大分子)[40]、啶虫脒(非刚性分子)[41]、谷氨酸(氨基酸)[42]、咪唑和吡唑(同分异构化合物)[43]等,预测结果均与实验数据吻合较好[44-45]。本文在DFT/B3LYP/3-21G基组条件下对华法林分子模型进行理论计算,对该药物在10~16 THz下的分子运动模式进行分析,通过高斯展宽(半峰全宽为0.12 THz)获得理论光谱图。
3 分析与讨论
3.1 华法林钠的定性实验分析
本文对华法林钠的太赫兹吸收特性进行了实验分析。采集到的信号频域图如

图 1. 华法林钠的太赫兹吸收特性。(a)频域图,插图为检测示意图;(b)华法林钠的太赫兹吸收谱图
Fig. 1. Terahertz absorption characteristics of warfarin sodium. (a) Frequency domain diagram with schematic of detection shown in inset; (b) terahertz absorption spectra of warfarin sodium
3.2 华法林钠的理论仿真分析
为了分析华法林钠在10~16 THz波段内的太赫兹吸收特性对应的分子振动模式,本文对华法林钠进行了理论仿真分析。华法林钠的分子式为C19H15NaO4,相对分子质量为330.31,

图 2. 华法林分子的理论仿真结果。(a)华法林钠分子模型;(b)华法林分子模型;(c)华法林理论光谱与华法林钠实验光谱
Fig. 2. Theoretical simulation results of warfarin molecules. (a) Molecular model of warfarin sodium; (b) molecular model of warfarin; (c) theoretical spectrum of warfarin and experimental spectrum of warfarin sodium
表 1. 理论仿真峰位与实测峰位的对应关系及相应的分子运动模式
Table 1. Comparison between theoretical peaks and measured peaks as well as corresponding molecular motions
|
利用GuassView软件对理论仿真结果进行可视化分析,观测华法林分子模型中特征吸收峰对应的基团振动。如

图 3. 华法林在不同理论峰位处的振动模式图,箭头为振动方向,箭头长度表征振动强度。(a) 11.07 THz;(b) 11.70 THz;(c) 13.28 THz;(d) 13.82 THz;(e) 14.27 THz;(f) 15.71 THz
Fig. 3. Vibrational modes of warfarin at different theoretical peak positions, in which arrow presents vibration direction and length of arrow presents intensity of vibration. (a) 11.07 THz; (b) 11.70 THz; (c) 13.28 THz; (d) 13.82 THz; (e) 14.27 THz; (f) 15.71 THz
在上述理论仿真和实验测试结果的基础上,明确11.10、11.94、13.15、13.70、14.01、15.43 THz处的峰均为与华法林分子基团相关的THz特征峰,可用于华法林钠的定性识别。
3.3 华法林钠的定量实验分析
考虑到华法林钠在人体内实际存在的状态和浓度,本文制备了不同浓度(2~100 nmol/mL)的华法林钠水溶液并进行定量分析,检测结果如

图 4. 不同浓度华法林钠溶液的太赫兹吸收光谱。(a)未去基线的吸收图;(b)去基线后的吸收图
Fig. 4. Terahertz absorption spectra of warfarin sodium solutions with different concentrations. (a) Before baseline removal; (b) after baseline removal
为进一步解析华法林钠浓度与其三个特征吸收峰之间的相关性,须去除实验谱图的基线,准确测定吸收峰的峰高和峰下面积。本文利用光谱一阶导数的极小值点确定三个吸收峰的频率范围,分别为11.58~12.68 THz、12.68~14.31 THz 、15.12~16.56 THz。接着以吸收峰两侧最低点的切线作为基线进行去基线操作,得到了
式中:

图 5. 华法林钠浓度与太赫兹特征峰之间的关系。(a)浓度与峰高之间的关系;(b)浓度与峰下面积之间的关系
Fig. 5. Relationship between THz characteristic peak and warfarin sodium concentration. (a) Relationship between concentration and peak height; (b) relationship between concentration and peak area
仪器响应的不均匀性会导致峰展宽或偏移,从而引起误差。为了减小这种误差,对华法林钠进行了更加精准的定量分析,本文研究了华法林钠三个THz特征吸收峰的峰下面积与其水溶液浓度之间的关系,结果如
式中:
本文进一步计算了峰高和峰下面积在华法林钠定量检测中的最低检测限(LOD,
式中:
结果如
表 2. 基于太赫兹光谱的双指标华法林钠定量分析方法的检测性能
Table 2. Detection performances of double-index quantitative analysis method for warfarin sodium based on terahertz spectroscopy
| ||||||||||||||||||||||||||||||||||
4 结论
基于太赫兹光谱,针对肺栓塞治疗药物华法林钠建立了一种快速定性定量分析方法。结合太赫兹光谱测试和DFT量化计算,明确了华法林钠光谱在10~16 THz范围内存在6个特征峰,对应频率分别为11.10、11.94、13.05、13.74、14.01、15.43 THz,并分析了上述特征吸收峰的归属,阐明了相应的分子运动模式,从而建立了华法林钠定性识别方法。在此基础上,对不同浓度的华法林钠水溶液在太赫兹波段的吸收特性进行了研究,分析了药物浓度与其太赫兹特征峰峰高、峰下面积之间的相关性,给出了华法林钠定量检测曲线,计算了定量检测的灵敏度和最低检测限。结果显示:随着华法林钠浓度的增加,太赫兹特征吸收峰的峰高和峰下面积增大(
[1] Zhao W G, Zhang W L, Zhang Y Z. Characteristics of deep venous thrombosis in isolated lower extremity fractures and unsolved problems in guidelines: a review of recent literature[J]. Orthopaedic Surgery, 2022, 14(8): 1558-1568.
[2] Khan F, Tritschler T, Kahn S R, et al. Venous thromboembolism[J]. Lancet, 2021, 398(10294): 64-77.
[3] Wu Y P, Wang C, Guo J Q, et al. An RGD modified water-soluble fluorophore probe for in vivo NIR-II imaging of thrombosis[J]. Biomaterials Science, 2020, 8(16): 4438-4446.
[4] Ortel T L, Neumann I, Ageno W, et al. American society of hematology 2020 guidelines for management of venous thromboembolism: treatment of deep vein thrombosis and pulmonary embolism[J]. Blood Advances, 2020, 4(19): 4693-4738.
[5] Tagalakis V, Patenaude V, Kahn S R, et al. Incidence of and mortality from venous thromboembolism in a real-world population: the Q-VTE study cohort[J]. The American Journal of Medicine, 2013, 126(9): 832.
[6] Mekaj Y H, Daci F T, Mekaj A Y. New insights into the mechanisms of action of aspirin and its use in the prevention and treatment of arterial and venous thromboembolism[J]. Therapeutics and Clinical Risk Management, 2015, 11: 1449-1456.
[7] Zhang W, Li M M, Wang X, et al. Precision navigation of venous thrombosis guided by viscosity-activatable near-infrared fluorescence[J]. Analytical Chemistry, 2023, 95(4): 2382-2389.
[8] Lutsey P L, Zakai N A. Epidemiology and prevention of venous thromboembolism[J]. Nature Reviews Cardiology, 2023, 20: 248-262.
[9] Hernandez I, Baik S H, Piñera A, et al. Risk of bleeding with dabigatran in atrial fibrillation[J]. JAMA Internal Medicine, 2015, 175(1): 18-24.
[10] 李伟, 孟昭慧, 刘兆华. 心房颤动患者卒中防治药物利伐沙班与华法林的药物经济学分析[J]. 中国药物经济学, 2021, 16(2): 28-31.
Li W, Meng Z H, Liu Z H. Pharmacoeconomic analysis of rivaroxaban and warfarin for stroke prevention and treatment in patients with atrial fibrillation[J]. China Journal of Pharmaceutical Economics, 2021, 16(2): 28-31.
[11] 王琎, 高琳艳, 张兰, 等. 华法林钠片在健康受试者生物等效性试验中的安全性分析[J]. 现代药物与临床, 2022, 37(9): 1927-1931.
Wang J, Gao L Y, Zhang L, et al. Safety analysis on bioequivalence studies of Warfarin Sodium Tablets in healthy subjects[J]. Drugs & Clinic, 2022, 37(9): 1927-1931.
[12] Pengo V, Denas G, Zoppellaro G, et al. Rivaroxaban vs warfarin in high-risk patients with antiphospholipid syndrome[J]. Blood, 2018, 132(13): 1365-1371.
[13] 王宪德, 丁力, 唐闽, 等. 华法林血浆浓度的测定在患者出院前后抗凝监测中的作用比较[J]. 河北医科大学学报, 2006, 27(5): 344-346.
Wang X D, Ding L, Tang M, et al. Significance of warfarin plasma concentration in in-patient and out-patient's anticoagulation monitoring[J]. Journal of Hebei Medical University, 2006, 27(5): 344-346.
[14] Giugliano R P, Ruff C T, Braunwald E, et al. Edoxaban versus warfarin in patients with atrial fibrillation[J]. The New England Journal of Medicine, 2013, 369(22): 2093-2104.
[15] Hou J G, Zheng J, Shamsi S A. Separation and determination of warfarin enantiomers in human plasma using a novel polymeric surfactant for micellar electrokinetic chromatography-mass spectrometry[J]. Journal of Chromatography A, 2007, 1159(1/2): 208-216.
[16] 张雪, 贺吉香, 魏轩, 等. LC-MS/MS法测定犬血浆中华法林钠的浓度及其应用[J]. 中国临床药学杂志, 2015, 24(3): 166-170.
Zhang X, He J X, Wei X, et al. Determination of warfarin sodium in canine plasma by LC-MS/MS and its pharmacokinetic study[J]. Chinese Journal of Clinical Pharmacy, 2015, 24(3): 166-170.
[17] Putriana N A, Rusdiana T, Rostinawati T, et al. Validation of warfarin enantiomer analysis method in plasma using high-performance liquid chromatography fluorescence detector[J]. Journal of Advanced Pharmaceutical Technology & Research, 2022, 13(1): 18-24.
[18] HarwoodT. The use of terahertz spectroscopy for biomolecular analysis[D]. Strathclyde: University of Strathclyde, 2016.
[19] Yang X, Zhao X, Yang K, et al. Biomedical applications of terahertz spectroscopy and imaging[J]. Trends in Biotechnology, 2016, 34(10): 810-824.
[20] Qu F F, Lin L, He Y, et al. Spectral characterization and molecular dynamics simulation of pesticides based on terahertz time-domain spectra analyses and density functional theory (DFT) calculations[J]. Molecules, 2018, 23(7): 1607.
[21] 郭以恒, 燕芳, 赵渺钰, 等. 基于太赫兹光谱的三聚氰胺定量分析[J]. 光学学报, 2023, 43(19): 1930001.
[22] Danciu M, Alexa-Stratulat T, Stefanescu C, et al. Terahertz spectroscopy and imaging: a cutting-edge method for diagnosing digestive cancers[J]. Materials, 2019, 12(9): 1519.
[23] 朱华利, 张勇, 叶龙芳, 等. 基于人工表面等离激元的太赫兹低损耗传输线及带阻滤波器设计[J]. 光学学报, 2022, 42(20): 2024001.
[24] Peng Y, Zhu Y M, Gu M, et al. Terahertz spatial sampling with subwavelength accuracy[J]. Light: Science & Applications, 2019, 8: 72.
[26] Zhou R Y, Wang C, Huang Y X, et al. Label-free terahertz microfluidic biosensor for sensitive DNA detection using graphene-metasurface hybrid structures[J]. Biosensors and Bioelectronics, 2021, 188: 113336.
[29] Sun L, Xu L, Wang J Y, et al. A pixelated frequency-agile metasurface for broadband terahertz molecular fingerprint sensing[J]. Nanoscale, 2022, 14(27): 9681-9685.
[30] Huang L L, Li C, Li B, et al. Studies on qualitative and quantitative detection of trehalose purity by terahertz spectroscopy[J]. Food Science & Nutrition, 2020, 8(4): 1828-1836.
[31] 戴浩, 徐开俊, 金飚兵, 等. β-内酰胺类抗生素药物的太赫兹光谱[J]. 红外与激光工程, 2013, 42(1): 90-95.
Dai H, Xu K, Jin B, et al. Terahertz spectroscopy of β-lactam antibiotics[J]. Infrared and Laser Engineering, 2013, 42(1): 90-5.
[32] Tan N Y, Zeitler J A. Probing phase transitions in simvastatin with terahertz time-domain spectroscopy[J]. Molecular Pharmaceutics, 2015, 12(3): 810-815.
[33] 魏小柯, 吴旭, 陆小森, 等. 抗血栓药物拜瑞妥的远红外光谱研究[J]. 中国激光, 2023, 50(15): 1507207.
[34] 曹瑶瑶, 李霞, 白军朋, 等. 基于THz-TDS技术的培氟沙星和氟罗沙星抗生素定性定量检测研究[J]. 光谱学与光谱分析, 2022, 42(6): 1798-1803.
[35] Kostova I, Amalanathan M, Joe I H. Molecular first order hyperpolarizability and vibrational spectral investigation of Warfarin sodium[J]. Chemical Physics, 2010, 378(1/2/3): 88-102.
[36] Mishra A, Srivastava S K, Swati D. Study of structure-activity relationship of enantiomeric, protonated and deprotonated forms of warfarin via vibrational spectroscopy and DFT calculations[J]. Spectrochimica Acta Part A: Molecular and Biomolecular Spectroscopy, 2013, 113: 439-446.
[37] Kalnev N A, Magden I N. Investigation of characteristics of monocrystal silicon on high temperature working[J]. Izvestiya Akademia Nauk Armyanskoi SSR Fizika, 1974, 9(4): 322-327.
[38] Jensen J O. Vibrational frequencies and structural determination of adamantane[J]. Spectrochimica Acta Part A: Molecular and Biomolecular Spectroscopy, 2004, 60(8/9): 1895-1905.
[39] Bursch M, Mewes J M, Hansen A, et al. Best-practice DFT protocols for basic molecular computational chemistry[J]. Angewandte Chemie (International Ed. in English), 2022, 61(42): e202205735.
[40] Billes F, Várady B. A DFT study on the vibrational spectroscopy of protoporphyrin IX[J]. Spectrochimica Acta Part A: Molecular and Biomolecular Spectroscopy, 2008, 70(4): 729-734.
[41] Wallace S, Lambrakos S G, Shabaev A, et al. IR absorption spectra for pesticides using density functional theory[J]. Proceedings of SPIE, 2022, 12091: 120910D.
[42] 郑转平, 刘榆杭, 曾方, 等. 基于太赫兹光谱的DL-谷氨酸及其一水合物的定性及定量研究[J]. 物理学报, 2023, 72(8): 083201.
Zheng Z P, Liu Y H, Zeng F, et al. Qualitative and quantitative study on DL-glutamic acid and its monohydrate using terahertz spectra[J]. Acta Physica Sinica, 2023, 72(8): 083201.
[43] 殷贤华, 李镜彤, 陈慧聪, 等. 咪唑和吡唑的太赫兹吸收峰形成机理[J]. 激光与光电子学进展, 2023, 60(9): 0930005.
[44] Hakey P M, Allis D G, Ouellette W, et al. Cryogenic terahertz spectrum of (+)-methamphetamine hydrochloride and assignment using solid-state density functional theory[J]. The Journal of Physical Chemistry A, 2009, 113(17): 5119-5127.
[45] Ruggiero M T, Bardon T, Strlič M, et al. Assignment of the terahertz spectra of crystalline copper sulfate and its hydrates via solid-state density functional theory[J]. The Journal of Physical Chemistry A, 2014, 118(43): 10101-10108.
Article Outline
吴静, 吴旭, 黄星皓, 李嘉伟, 张金晶, 彭滟, 陆林. 基于太赫兹光谱的华法林钠快速定性定量检测[J]. 中国激光, 2024, 51(3): 0307206. Jing Wu, Xu Wu, Xinghao Huang, Jiawei Li, Jinjing Zhang, Yan Peng, Lin Lu. Rapid Qualitative and Quantitative Detection of Warfarin Sodium Based on Terahertz Spectroscopy[J]. Chinese Journal of Lasers, 2024, 51(3): 0307206.


