基于标定直接吸收光谱方法的近红外乙烯检测【增强内容出版】
The real-time detection of ethylene (C2H4) is significant for the safety of coal mines, the petrochemical industry, and other industries. Currently, the mainstream methods for C2H4 gas concentration detection include gas chromatography and electrochemical sensors. Gas chromatography can separate multicomponent gases and avoid mutual interference. However, this method requires long-term preheating and frequent calibration, making it difficult to complete real-time measurements in industrial scenarios. Although electrochemical sensors have the advantages of small size and low cost, their selectivity is poor, and it is difficult to avoid cross-interference. In contrast, tunable diode laser absorption spectroscopy (TDLAS) has the advantages of real-time measurements, high sensitivity, and strong selectivity. They are widely used in industrial gas detection and environmental monitoring. Unfortunately, there are still some difficulties in real-time high-precision detection of C2H4. First, information regarding the absorption line of C2H4 in the near-infrared band cannot be obtained. Second, the absorption spectrum of C2H4 is described as complex band absorption. Third, the absorption spectra of C2H4 and CH4 in the near-infrared band interfere with each other. Therefore, real-time high-precision detection of C2H4 is a common problem that urgently needs to be addressed.
First, the gas concentration can be calculated using traditional direct absorption spectroscopy if the accurate parameters of the absorption line are known. However, for C2H4, it does not contain an absorption line intensity within the near-infrared band in the HITRAN database. This results in an inability to use a calibration-free method to directly calculate the C2H4 concentration. Notably, the concentration calculation method in wavelength modulation spectroscopy does not require accurate spectral line intensity. Therefore, the calibration concept of wavelength modulation spectroscopy is applied to the direct absorption spectroscopy, forming a method named calibrated direct absorption spectroscopy. In addition, faced with the problems of the band absorption of C2H4 and the interference of CH4, a high-precision pressure control system is utilized to complete the spectral line separation under low pressure. In contrast to previous studies, it is necessary to select an appropriately calibrated spectrum in this study. Specifically, standard CH4 and C2H4 gases are measured at a pressure of 100 mbar (1 bar=105 Pa) and the corresponding direct absorption spectra are obtained. By comparing with the simulated spectrum of CH4 in the HITRAN database, the appropriate calibrated spectrum of C2H4 is determined.
Stable pressure plays a vital role in the experiments. After the pressure value stabilizes to 100 mbar, the pressure results of the continuous measurement within 1 h are collected, and the distribution of the pressure results is well fitted by a Gaussian function; the full width at half maximum is 0.008 mbar, which proves the stability of the experimental system for pressure control. The subsequent experiments are conducted at 100 mbar. Within the volume fraction of less than 100×10-6, the direct absorption spectrum signals of five sets of C2H4 are acquired and the concentration results are also calculated. The correlated coefficient of linear fitting between the result and the standard concentration is greater than 0.999, and the maximum measurement error is -1.47×10⁻⁶. In addition, a direct absorption spectrum signal of 10×10-6 C2H4 is selected for limit of detection (LoD) analysis. The peak value of the signal is 5.80×10⁻⁴, and that of the background signal is 0.80×10⁻⁴, which can be calculated to obtain a signal-to-noise ratio (SNR) of 7.25. The concentration corresponding to one SNR is defined as the LoD, and its value is 1.38×10⁻⁶. Finally, C2H4 with a volume fraction of 20×10-6 is continuously measured for 40 min, and Allan variance analysis is performed on the volume fraction results. At an integral time of 1 s, the precision of measurement for C2H4 is 0.61×10⁻⁶. As the integral time increases, the detection precision can reach 0.04×10⁻⁶.
To address the challenges faced in near-infrared ethylene detection, a calibrated method in wavelength modulation spectroscopy is applied to direct absorption spectroscopy, forming a new method known as calibrated direct absorption spectroscopy. An experimental device for C2H4 detection with a high-precision pressure-control system is established, and the direct absorption spectrum of C2H4 is measured at approximately 1626 nm. Based on experimental verification, the calibrated direct absorption spectroscopy method can complete the real-time detection of C2H4, overcoming the limitations of traditional direct absorption spectroscopy. We also hope to address real-time detection problems of other similar gases, which can significantly expand the application of direct absorption spectroscopy.
1 引言
煤层自然发火早期会释放C2H4气体,因此将C2H4作为煤炭发火的主要指标气体进行实时在线检测,能够提前预警并保障煤矿的生产安全[1-4]。除此之外,在石油化工、电力等行业对C2H4进行实时高精度检测也具有非常重要的经济价值和现实意义[4-5]。燃烧释放的C2H4体积分数通常为1×10⁻⁶~50×10-6,因此对C2H4气体的检测精度要求达到10-6量级[6]。目前常用的C2H4气体浓度检测方法包括气相色谱法、电化学传感器等[1]。气相色谱仪能够实现多种气体组分的分离,避免互相干扰,但是需要长时间预热和频繁标定[7],难以完成工况环境下的实时测量。电化学传感器虽然具有体积小、成本低等优势,但是其选择性差,易受环境温度和湿度的影响[8]。
激光吸收光谱技术(TDLAS)具有实时原位测量、灵敏度高、选择性强等优点[9-14],已经被广泛应用于工业气体检测、环境监测、燃烧诊断等领域[15-20]。目前也有基于TDLAS技术实现C2H4检测的相关研究[21-23]。Wang等[24]利用多线拟合方法在1626 nm附近对波长调制光谱进行了多线拟合,并根据提取到的谱线信息实现了C2H4的浓度检测,在体积分数为100×10-6~700×10-6的范围内最大相对误差不超过2.40%。Gao等[25]使用1620 nm分布反馈式激光器基于差分吸收光谱在高温高压条件下实现了C2H4气体浓度和温度的同时检测,实验结果显示,当温度为900 K、压强为1 atm(1 atm=101325 Pa)时,C2H4的检测精度为19×10-6。Zou等[26]结合频分复用和时分复用方法,对变压器油中溶解的多组分气体进行了同时检测,其中近红外C2H4检测选择了发射波长为1626 nm的激光器,Allan方差分析证明该系统在积分时间为1 s时对C2H4的检测精度达到了0.98×10⁻⁶,但并未对二次谐波原始信号进行分析,无法获得精确的检测下限。Tanaka等[5]使用中心波长为3356 nm的激光器搭建了中红外C2H4检测系统,以2倍信噪比对应的C2H4浓度作为检测下限,计算得到检测下限为0.096×10⁻⁶。值得注意的是,在中红外波段对C2H4气体浓度进行检测可以达到10-6量级的检测精度,但这在近红外波段难以实现。使用中红外波段激光器虽然能够实现更低的检测下限和更高的检测精度,但是中红外激光器价格昂贵且难以与光纤耦合进行传输,导致了光路结构复杂且稳定性较差,难以在恶劣工况环境下应用[27]。
为了实现近红外C2H4的高精度实时检测,将波长调制光谱的标定方法与直接吸收光谱法结合,提出了标定直接吸收光谱方法,并完成了C2H4检测。本文首先分析了直接吸收光谱原理公式,阐述了传统直接吸收光谱不适用于近红外C2H4浓度检测的原因。然后详细介绍了标定直接吸收光谱的实施步骤,并分析了其在参数不确定情况下进行气体浓度检测的优势。同时搭建了C2H4检测系统,在100 mbar(1 bar=105 Pa)压强条件下对1626 nm附近的CH4和C2H4直接吸收光谱进行了测量并选择了合适的标定光谱范围。最后针对C2H4检测设计和实施了系统性实验验证,并对实验结果进行了详细的分析和讨论。
2 理论分析
基于Lambert-Beer定律的激光吸收光谱技术,可以表述为待测气体对特定波长的光会产生吸收作用。吸收前的激光光强(I0)和吸收后的激光光强(It)[28]可以表示为
式中:
利用传统直接吸收方法反演气体浓度时,首先根据获得的直接吸收光谱信号计算气体在波数范围内的积分吸光度
式中:
对
由
3 实验设计
3.1 吸收谱线仿真及实验装置
如
实验系统原理图如
3.2 吸收光谱测量及标定范围选择
虽然通过仿真模拟获得了

图 3. 100 mbar压强下CH4和C2H4的吸收光谱图。(a)宽扫描范围下CH4和C2H4的吸收光谱;(b)缩小波长扫描范围后C2H4的吸收光谱
Fig. 3. Absorption spectra of CH4 and C2H4 at 100 mbar. (a) Absorption spectra of CH4 and C2H4 in wide scanning range; (b) absorption spectrum of C2H4 after reducing wavelength scanning range
但值得注意的是,此时为了测量较宽波长范围内的CH4和C2H4的吸收谱线,激光器的扫描电流范围过大,而实验系统所采用的电路系统采样率是固定的,扫描范围过大会导致信号欠采样,也就会造成直接吸收光谱峰值降低。调节电路系统中驱动激光器的温度系数和电流系数以缩小激光器的扫描范围,使得激光器出射波长能够覆盖
4 结果分析与讨论
基于

图 4. 压强数据及频率分布直方图和高斯拟合结果。(a)压强数据;(b)频率分布直方图和高斯拟合结果
Fig. 4. Pressure data, frequency distribution histogram, and Gaussian fitting result. (a) Pressure data; (b) frequency distribution histogram and Gaussian fitting result
在100 mbar压强条件下,采集5组不同体积分数的C2H4的直接吸收光谱信号,其在

图 5. 不同体积分数的C2H4的吸收光谱、测量线性度及误差。(a)不同体积分数的C2H4的吸收光谱;(b)测量结果及线性拟合结果;(c)绝对误差
Fig. 5. Absorption spectra, measurement linearity values and errors of C2H4 with different volume fractions. (a) Absorption spectra of C2H4 with different volume fractions; (b) measurement and linear fitting results; (c) absolute error
为了获得该系统对C2H4的检测下限,选择体积分数为10×10-6的C2H4气体的直接吸收原始信号进行分析,结果如
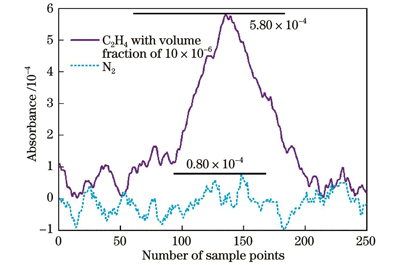
图 6. 体积分数为10×10-6的C2H4的吸收光谱
Fig. 6. Absorption spectrum of C2H4 with volume fraction of 10×10-6
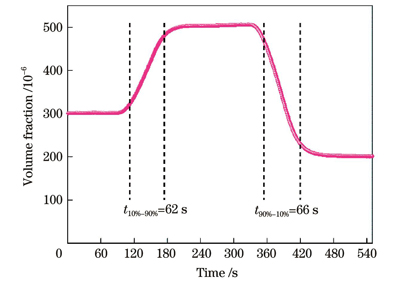
不同于波长调制光谱,直接吸收光谱进行浓度测量时没有吸光度小于0.05的限制,因此该方法也同样能够实现高体积分数C2H4气体的测量,这再次体现了标定直接吸收光谱方法的优势。采用3组高体积分数C2H4气体进行了系统响应时间的分析,实验过程中的气体体积分数变化如
对体积分数为20×10-6的C2H4气体进行了40 min的连续测量,测量结果如
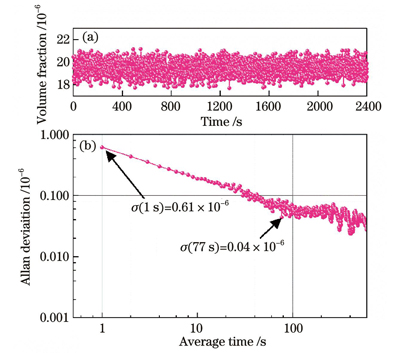
图 8. Allan方差分析结果。(a) C2H4体积分数;(b) Allan方差
Fig. 8. Allan variance analysis results. (a) Volume fraction of C2H4; (b) Allan variance
5 结论
针对C2H4气体近红外波段谱线强度不明确和谱带吸收的特点,将波长调制光谱中的标定计算方法应用于直接吸收光谱,得到了一种标定直接吸收光谱方法。搭建了带有高精度压强控制系统的C2H4气体激光吸收光谱检测系统,并获得了C2H4气体在1626 nm附近的直接吸收光谱,对其与CH4气体的模拟和实测吸收光谱进行对比,确定了标定光谱的范围并进行了一系列实验。经过实验验证,该方法在体积分数小于100×10-6的范围内对C2H4气体检测的线性拟合优度为0.999,最低检测限能够达到1.38×10⁻⁶。通过Allan方差分析可知,该系统对C2H4的检测精度在1 s时为0.61×10⁻⁶,在77 s时能够达到0.04×10⁻⁶。除此之外,在系统动态响应实验中,对高浓度C2H4气体的浓度变化进行了实时检测,对系统响应时间以及高浓度C2H4测量进行了同时验证。基于以上分析,标定直接吸收光谱方法能够实现C2H4气体的实时在线监测,突破了传统直接吸收光谱需要精确谱线强度信息的限制,也有希望解决其他类似气体的实时检测问题,可以在很大程度上拓展直接吸收光谱的应用范围。
[1] Chen K, Zhang B, Guo M, et al. Photoacoustic trace gas detection of ethylene in high-concentration methane background based on dual light sources and fiber-optic microphone[J]. Sensors and Actuators B: Chemical, 2020, 310: 127825.
[2] Xie J, Xue S, Cheng W M, et al. Early detection of spontaneous combustion of coal in underground coal mines with development of an ethylene enriching system[J]. International Journal of Coal Geology, 2011, 85(1): 123-127.
[3] Deng J, Xiao Y, Li Q W, et al. Experimental studies of spontaneous combustion and anaerobic cooling of coal[J]. Fuel, 2015, 157: 261-269.
[4] 陈颖, 高光珍, 蔡廷栋. 基于光声光谱的乙烯探测技术[J]. 中国激光, 2017, 44(5): 0511001.
[5] Tanaka K, Akishima K, Sekita M, et al. Measurement of ethylene in combustion exhaust using a 3.3-μm distributed feedback interband cascade laser with wavelength modulation spectroscopy[J]. Applied Physics B, 2017, 123(8): 219.
[6] Teodoro C G, Schramm D U, Sthel M S, et al. CO2 laser photoacoustic detection of ethylene emitted by diesel engines used in urban public transports[J]. Infrared Physics & Technology, 2010, 53(2): 151-155.
[7] Zhang L W, Zhang Z R, Wang Q J, et al. A sensitive carbon monoxide sensor for industrial process control based on laser absorption spectroscopy with a 2.3 μm distributed feedback laser[J]. Optics and Lasers in Engineering, 2022, 152: 106950.
[8] 孙利群, 邹明丽, 王旋. 可调谐半导体激光吸收光谱法在呼吸诊断中的应用[J]. 中国激光, 2021, 48(15): 1511001.
[9] 庞涛, 孙鹏帅, 张志荣, 等. 宽温紧凑型全量程激光甲烷传感探头设计[J]. 光子学报, 2020, 49(10): 1012002.
[10] Liu N W, Xu L G, Zhou S, et al. Simultaneous detection of multiple atmospheric components using an NIR and MIR laser hybrid gas sensing system[J]. ACS Sensors, 2020, 5(11): 3607-3616.
[11] Gu M S, Chen J J, Zhang Y P, et al. Portable TDLAS sensor for online monitoring of CO2 and H2O using a miniaturized multi-pass cell[J]. Sensors, 2023, 23(4): 2072.
[12] Zhang J, Du J Y, Jiang C, et al. Measurement of δ18O in water vapor using a tunable diode laser-based spectrometer[J]. Applied Physics B, 2023, 129(5): 80.
[13] 李金义, 杨雪, 张宸阁, 等. 参数优化的 Kalman 滤波用于激光吸收光谱气体测量[J]. 光学学报, 2022, 42(18): 1830001.
[14] 孙亚丽, 朱昕玥, 吴达坤, 等. 基于反谐振空芯光纤的中红外TDLAS系统设计及应用实验研究[J]. 光学学报, 2023, 43(13): 1306005.
[15] 张志荣, 孙鹏帅, 庞涛, 等. 激光吸收光谱技术在工业生产过程及安全预警标识性气体监测中的应用[J]. 光学 精密工程, 2018, 26(8): 1925-1937.
[16] Raza M, Xu K, Lu Z M, et al. Simultaneous methane and acetylene detection using frequency-division multiplexed laser absorption spectroscopy[J]. Optics & Laser Technology, 2022, 154: 108285.
[17] Shao L G, Chen J J, Wang K Y, et al. Highly precise measurement of atmospheric N2O and CO using improved White cell and RF current perturbation[J]. Sensors and Actuators B: Chemical, 2022, 352: 130995.
[18] Yi Y, Kun D, Li R, et al. Accurate temperature prediction with small absorption spectral data enabled by transfer machine learning[J]. Optics Express, 2021, 29(25): 40699-40709.
[19] 曹章, 高欣, 陆方皞, 等. 激光吸收光谱层析成像及复杂燃烧场动态监测[J]. 中国激光, 2022, 49(19): 1904002.
[21] Zhang G, Gao G Z, Zhang T, et al. Absorption spectroscopy of ethylene near 1.62 µm at high temperatures[J]. Journal of Quantitative Spectroscopy and Radiative Transfer, 2020, 241: 106748.
[22] Zhang T, Zhang G, Liu X, et al. A TDLAS sensor for simultaneous measurement of temperature and C2H4 concentration using differential absorption scheme at high temperature[J]. Frontiers in Physics, 2020, 8: 44.
[23] Li J Y, Du Z H, Zhang Z Y, et al. Hollow waveguide-enhanced mid-infrared sensor for fast and sensitive ethylene detection[J]. Sensor Review, 2017, 37(1): 82-87.
[24] Wang W F, Yang B, Liu H F, et al. A multiline fitting method for measuring ethylene concentration based on WMS-2f/1f[J]. Scientific Reports, 2023, 13(1): 15302.
[25] Gao G Z, Zhang T, Zhang G, et al. Simultaneous and interference-free measurements of temperature and C2H4 concentration using a single tunable diode laser at 1.62 µm[J]. Optics Express, 2019, 27(13): 17887-17904.
[26] Zou M L, Sun L Q, Wang X. Multigas sensing based on wavelength modulation spectroscopy using frequency division multiplexing combined with time division multiplexing[J]. IEEE Sensors Journal, 2022, 22(13): 12930-12938.
[27] 王振, 杜艳君, 丁艳军, 等. 波长调制-直接吸收方法在线监测大气中CH4和CO2浓度[J]. 物理学报, 2020, 69(6): 064205.
Wang Z, Du Y J, Ding Y J, et al. Monitoring of ambient methane and carbon dioxide concentrations based on wavelength modulationdirect absorption spectroscopy[J]. Acta Physica Sinica, 2020, 69(6): 064205.
[28] Li S M, Sun L Q. Natural logarithm wavelength modulation spectroscopy: a linear method for any large absorbance[J]. Spectrochimica Acta Part A: Molecular and Biomolecular Spectroscopy, 2021, 254: 119601.
[29] Gordon I E, Rothman L S, Hill C, et al. The HITRAN2016 molecular spectroscopic database[J]. Journal of Quantitative Spectroscopy and Radiative Transfer, 2017, 203: 3-69.
王前进, 孙鹏帅, 张志荣, 蔡永军, 黄文彪, 庞涛, 夏滑, 吴边. 基于标定直接吸收光谱方法的近红外乙烯检测[J]. 中国激光, 2024, 51(8): 0811004. Qianjin Wang, Pengshuai Sun, Zhirong Zhang, Yongjun Cai, Wenbiao Huang, Tao Pang, Hua Xia, Bian Wu. Near-infrared C2H4 Detection Based on Calibrated Direct Absorption Spectroscopy[J]. Chinese Journal of Lasers, 2024, 51(8): 0811004.
