基于光声热测量法的血液流速无创测量
Photoacoustic imaging is a multimodal imaging technique that integrates principles of optics and acoustics, enabling the observation and acquisition of structural and functional information within tissues. Blood flow velocity serves as a crucial indicator for evaluating vascular function and is closely associated with the occurrence and development of diseases. Accurate measurement of blood flow is particularly crucial for the diagnosis of various conditions, such as burns, stroke, atherosclerosis, diabetes, and cancer. Furthermore, the dynamics of blood flow have a significant impact on the effectiveness of pharmaceutical interventions in the human body, which emphasizes the importance of precise quantitative measurement of blood flow in clinical medicine. Photoacoustic measurement technology is a non-contact measurement approach based on the photoacoustic effect. It involves the application of pulsed laser energy to the target object, inducing thermal expansion and pressure waves that generate acoustic signals. The resulting acoustic signals are detected by an ultrasound transducer, and relevant algorithms are applied to measure fluid flow information (Fig. 1). Compared with traditional flow velocity measurement techniques, photoacoustic measurement technology offers higher resolution, greater imaging depth, increased contrast, and does not involve ionizing radiation.
This study employs the photoacoustic thermal measurement method to measure blood flow velocity. The principle of the photoacoustic thermal measurement method is rooted in the dependence of the photoacoustic signal amplitude on the temperature of the flowing medium. This dependence can be modulated through external heating and is influenced by the flow velocity. In the photoacoustic thermal measurement method, a pulsed laser beam is directed onto the fluid (blood). The absorbed optical energy induces a transient increase in local fluid temperature, creating a "thermal marker" and generating a corresponding ultrasound signal. Due to the acceleration of thermal transfer caused by fluid motion, the equilibrium temperature of the "thermal marker" varies at different flow velocities under the same laser irradiation, and it is correlated with the flow velocity. In this study, the fundamental theory for measuring blood flow velocity is deduced based on the thermal measurement method, establishing the relationship between velocity and the average photoacoustic signal amplitude. Furthermore, an experimental system for photoacoustic velocity measurement and imaging is constructed (Fig. 2). Utilizing LabVIEW for centralized control of the mechanical displacement stage and the signal acquisition system, experiments on photoacoustic velocity measurement and imaging are being conducted.
Through experimental investigation, quantitative relationships between photoacoustic pressure and fluid velocity are obtained. The study includes uncertainty analysis, and the experimental validation reveals an average measurement error of 8.2% for flow velocity within a relatively large range (0-200 mm/s) (Figs. 7 and 8), ascertaining the accuracy of the measurement. The lateral resolution of the imaging system is determined to be 10 μm (Fig. 9). Subsequent experiments involve two-dimensional scanning imaging, confirming the structural imaging capability of the system (Fig. 10). Finally, morphological and velocity photoacoustic co-measurements are conducted, demonstrating the system multimodal imaging functionality (Fig. 11). While the study does not consider the potential impact of vascular viscoelasticity on results, its underlying principle is based on the thermal equilibrium of laser heating, conduction, and blood convection within the heated volume, mitigating the effects of blood being a non-Newtonian fluid with shear forces and viscosity. Challenges in photoacoustic blood flow measurement, including measurement depth and signal interference, will be the focus of future research. Additionally, further experiments under different conditions, such as phantom and animal blood flow measurements, will be conducted to validate the feasibility of this method.
This study develops a thermal measurement-based photoacoustic experimental system for concurrent measurement of vascular morphology and blood flow velocity. The system utilizes a single light source to achieve synchronized measurements of vascular morphology and flow velocity. The experimental setup comprises optical excitation and laser shaping modules, photoacoustic detection module, sample pool, scanning motion module, and data acquisition module. The LabVIEW platform is employed for the control and storage of photoacoustic data. Through in vitro single-point velocity experiments, quantitative relationships between the photoacoustic pressure and fluid velocity are established. The system velocity measurement average error is validated to be 8.2%, with a maximum measurable velocity range of up to 200 mm/s. Building upon this foundation, a two-dimensional mechanical scanning approach is implemented to achieve concurrent photoacoustic morphology and flow velocity measurements with a resolution of 10 μm. Subsequent work will involve in vivo measurements of blood flow velocity and vascular morphology using this experimental system, aiming to further enhance the system imaging resolution and velocity measurement accuracy.
1 引言
血液流动状况是生物组织中一项重要的功能参数。准确地测量血液流动对于一些疾病的诊断十分重要,例如烧伤[1]、中风[2]、动脉粥样硬化[3]、糖尿病[4]、癌症[5-6]等。并且,血液流动情况对药物在人体内的作用效果的影响显著[7-8],因此对血液流动进行准确定量测量在临床医学上十分重要[9-11]。
光声测量技术是一种基于光声效应的非接触测量技术。脉冲激光作用于被测对象,产生热膨胀和压力波,并且发出声波信号,通过超声换能器探测产生的声波信号,利用相关算法测量流体的流动信息[12]。与传统的流速测量技术相比,光声测量技术具有更高的分辨率、更深的成像深度、更高的对比度,并且不含电离辐射[13]。
光声测量技术在生物医学领域中除了成像之外,还可以用于血液流速、血氧饱和度、血红蛋白浓度等参数的测量。2007年,Fang等[14]在流动的小型光吸收颗粒中观察到了光声多普勒效应,并基于该效应测量了光散射介质中的血液流动。2010年,Yao等[15]提出了一种基于光声多普勒带宽展宽的方法来测量横向流速,可以同时成像三维结构和流动方向。2013年,Zhou等[16]提出了一种基于互相关的方法,利用光声显微镜测量血液流速。2016年,He等[17]利用光声测量技术追踪黑色素细胞瘤的转移。2022年,Na等[18]将光声测量理论应用于人脑功能成像,为更广泛的临床光声成像运用奠定了坚实的基础。光声测量技术也被广泛地用于女性乳腺癌的诊断[19-20]。随着光学测量技术的发展,光声测量技术也在朝着小型化、便携化方向发展[21-23]。近些年来,人工智能飞速发展,光声测量技术与人工智能技术紧密结合,取得了众多突破[24-25]。
已有的光声测速方法,或需要结合加热源和光源才能完成测量[26],或需要借助于光声多普勒、密度追踪等方法,对测量介质有较高要求,如需要非均匀介质等[27-28],且流速测量范围(<20 mm·s-1[29])较小,无法满足临床多场景的使用需求。光声热测量方法在光声测速的过程中引入“热标记”,通过标记流速与温度、温度与光声声压间的关系对血液流速进行测量。光声热测量方法仅需单一激光光源即可完成测量,既可用于均质流体,也可用于非均质流体,测速范围大,且在测速的同时可实现二维高分辨率成像。本文详细推导了光声热测量方法测量血液流速的基本原理,搭建了光声测速/成像实验系统,先后完成了单点测速、二维平面内形态/流速协同测量,并分析了系统的成像分辨率及流速测量误差。
2 测量原理与实验系统
2.1 光声热测量法的基本原理
光声热测量法的原理源于光声信号振幅对流动介质温度的依赖性,该依赖性可以通过外部加热进行调制并受流速的影响。在光声热测量法中,脉冲激光束照射流体(血液)后,吸收的光能会导致局部流体温度瞬时上升,产生“热标记”,并产生相应的超声信号。由于流体流动加速了热传递,在同一激光照射下,“热标记”在不同流速下的平衡温度并不相同且与流速相关,因此可通过与温度相关的光声信号实现流速测量,其测量原理如

图 1. 光声热测量法测量血液流速基本原理
Fig. 1. Basic principle of measuring blood flow velocity using photoacoustic thermal measurement method
2.2 测量基本理论推导
2.2.1 光声信号与温度间的定量关系的推导
光声压力幅值的计算公式为
式中:
式中:a和b为两个常数;
对
式中:
式中:
2.2.2 光声信号与流速间的定量关系的推导
在已知光声信号与温度信号间的定量关系的情况下,通过传热学的基本理论推导激光光热法测量中温度与速度间的定量关系,即可获得光声压力信号与流速间的关系。利用脉冲激光加热流体介质时,加热体积内的局部温度从加热前的初始温度逐渐升高,流体温度与速度间的定量关系的计算公式为
式中:
对
式中:
式中:
求解作为一阶微分方程的
式中:
将
式中:A和B为两个与成像系统的空间分辨率、流动介质的吸收系数和加热源的功率等参数相关的恒定因子。
对于均匀的稳定流动的流体,
因此,当激光作用时间(比如大于30 ms)足够长时,
即
式中:
式中:A1、A2、A3为参数。
2.3 光声实验系统
本文搭建的光学分辨率光声显微镜(OR-PAM)实验系统如
光学激发和激光整形模块包括激光光源和多种光学器件,用于激光束的整形、扩束和聚焦。实验采用的激光光源为纳秒激光器,激光器的工作波长为532 nm,重复频率在60~200 kHz范围内可调。在100 kHz下平均功率为33.2 W,脉宽约为23.13 ns。由于高分辨光声显微成像的分辨率取决于聚焦光斑的大小,聚焦光斑的质量在很大程度上决定了成像质量的好坏,因此,需要通过一系列光学元件对激光光束进行整形。这些光学元器件包括:透镜、反射镜、光阑、滤光片、针孔等。其中滤光片是由在400~650 nm波段都有平稳吸收率的肖特玻璃基底制成的衰减片,在532 nm波长下光密度(OD)值为1,可透过约1/10(能量占比)的光,使得经过滤光片的激光能量降低到不损害样品的安全范围内。但是激光器出口激光光斑已经很小,直接照射在滤光片上会使滤光片局部温度过高而发生破裂,所以利用凸透镜-光阑-凸透镜对激光进行扩束,放大倍率为20,使其单位面积能量降低,可以安全地照射在滤光片上。经过整形得到的激光光斑更小,成像质量更高,激光能量也降低至不损害样品的安全范围。
光声采集探测模块和样品池实物图如
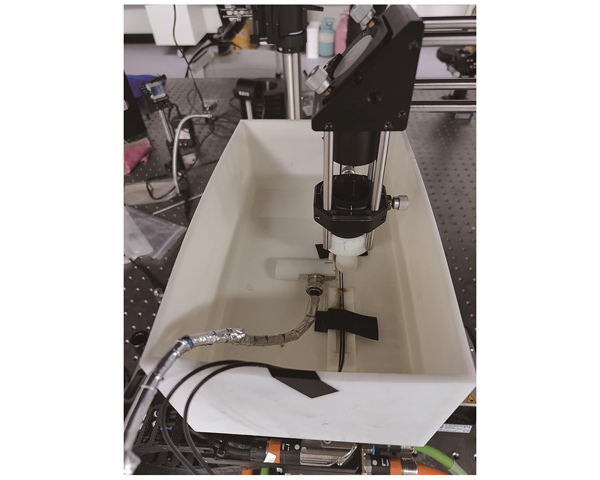
图 3. 光声采集探测模块和样品池实物图
Fig. 3. Photoacoustic acquisition and detection module and physical image of sample chamber
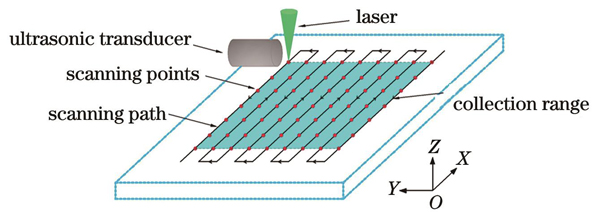
扫描运动模块选用高精密线性位移平台。该位移台具有102 mm行程,最大空载运行速度为2000 mm·s-1,定位精度为±4 μm。将两个位移台叠加组合,便得到了可以提供X、Y两个维度的二维扫描位移台。Z方向选用剪式升降台固定高度。本文采用二维机械式扫描进行光声信号的采集,扫描方式如
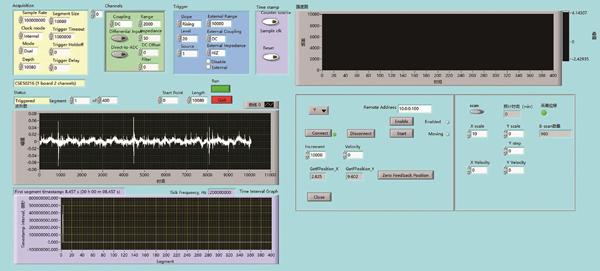
数据采集模块包括信号发生器、数据采集卡以及相关的计算机控制软件。信号发生器是主要的触发源,通过将触发信号连接到采集卡的Trigger In接口实现光声数据采集。激光器发光时,采集卡按照100 MHz的采样率对输入的模拟信号进行模数转换,并将结果存储在板卡缓冲区中。为了满足Nyquist采样定理,选择超过信号频率两倍的采样频率。为避免过大的数据量,根据高分辨率光声的成像深度,将A-line采样点数设置为10080。实验基于LabVIEW平台实现光声数据的采集和存储控制,其控制界面如
光声热测量法作为一种测量血液流速等的方法,原理是基于光声信号振幅对流动介质温度的依赖性。然而,在实际应用中,该方法面临一些限制。首先,流体的非均匀性和异质性可能影响光声信号的产生和传播,导致测量结果不准确。其次,生物组织的散射效应、流体特性的变化以及光吸收饱和都可能影响测量的准确性和深度。外部因素如温度变化和机械振动也可能引入干扰。此外,信号处理的复杂性、深度分辨率和时间分辨率等方面的技术限制也需要考虑。因此,在使用光声热测量法时,需综合考虑这些限制条件,并通过结合其他技术方法,提高测量的准确性和可靠性。
3 结果分析与讨论
3.1 单点测速实验结果
选取内径为1 mm的玻璃微管作为实验对象,将其固定在样品池内并浸没于水中,容量为10 mL、内径为4.6 mm的注射器与注射泵连接,将血液样品注入微管。通过注射泵设定不同的流速,并开始光声固定单点测速,获得对应流速

图 6. 固定单点测速过程中的光声信号。(a)寻找超声信号波峰;(b)波峰提取并平滑处理
Fig. 6. Photoacoustic signals during fixed single-point speed measurement. (a) Locating ultrasound signal peaks; (b) peak extraction and smoothing processing
本文以25 mm·s-1为间隔测量了25~200 mm·s-1不同流速下的光声压力幅值
由拟合结果可得
其中,
因此平均光声压力幅值
即
本文随后又进行了一组单点测速实验以验证
将本文结果与文献[30]中的实验结果进行比较。文献中较低流速范围(3~57 mm·s-1)内的平均测量误差为6.2%,较高流速范围(60~120 mm·s-1)内的平均测量误差为20%。本文中较大流速范围(0~200 mm·s-1)特别是高流速范围内的测量准确度更高。
3.2 光声二维成像实验
在完成系统固定单点测速之后,本文开展了光声二维成像实验。首先使用直径为6 μm的碳丝作为吸收体测试系统的水平面分辨率。将碳丝埋入琼脂仿体,琼脂仿体具有极低的光吸收系数,但是光散射系数与生物组织接近。在垂直于碳丝的光声图像上,提取各像素点对应的光声信号幅值,并进行高斯拟合,得到的点扩散函数曲线如
确定光声系统的分辨率后,本文以细铜丝为实验对象开展了二维扫描成像。激光脉冲频率为100 kHz,位移台每个B-scan的耗时约为1 s,电机y轴步进步长为10 μm,整个扫描过程的持续时间大约为5 min。扫描结果如
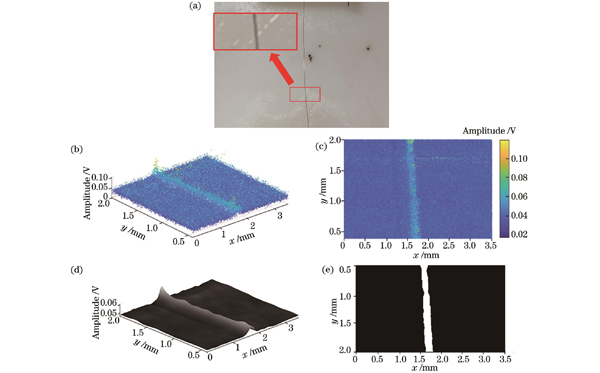
图 10. 细铜丝的光声成像。(a)铜丝实物图;(b)平均光声压力幅值;(c)二维散点图;(d)高斯滤波后所生成的平均光声压力幅值曲面;(e)二维铜丝结构图像
Fig. 10. Photoacoustic imaging of copper wire. (a) Physical image of copper wire; (b) average photoacoustic pressure amplitude; (c) two-dimensional scatter plot; (d) average photoacoustic pressure amplitude surface generated after Gaussian filtering; (e) two-dimensional image of copper wire structure
3.3 形态、速度的光声协同测量
为了进一步验证系统的二维成像及测速性能,本文利用实验系统开展了双玻璃微管不同速度条件下的形态、速度光声协同测量,结果如
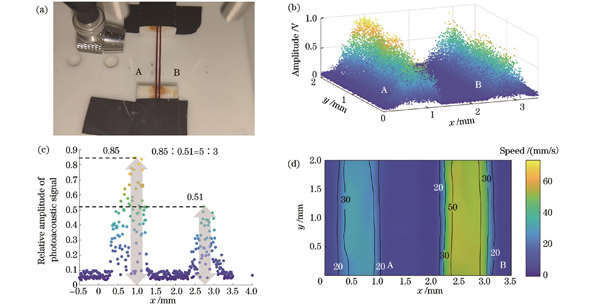
图 11. 形态、速度光声协同测量结果。(a)成像区域实物图;(b)光声压力幅值三维散点图;(c)玻璃管横截面光声压力幅值二维散点图;(d)速度分布图
Fig. 11. Morphology and speed co-measurement results. (a) Physical image of imaging area; (b) three-dimensional scatter plot of photoacoustic pressure amplitude; (c) two-dimensional scatter plot of photoacoustic pressure amplitude in cross-section of glass tube; (d) velocity distribution
在光声血液流速测量中,未考虑血管黏弹性对结果的影响,可能产生两方面的误差。首先,黏弹性导致血管形状和尺寸发生变化,从而影响准确性。其次,血管黏弹性增加了信号解释的复杂性,影响结果可靠性。此外,光声无创测量在测量深度方面面临挑战,且易受信号干扰。
4 结论
开发了一套基于热测量法的血管形态/流速协同测量的光声实验系统,采用单一光源实现了血管形态和流速的协同测量。该实验系统包含光学激发及激光整形模块、光声采集探测模块、样品池、扫描运动模块、数据采集模块等。借助LabVIEW平台实现了光声数据的采集和存储控制。通过体外单点测速实验获得了光声声压与流体速度间的定量关系,并经验证本系统流速测量的平均误差为8.2%,最大测速范围可达200 mm·s-1。在此基础上,采用二维机械扫描的方式实现了分辨率为10 μm的形态/流速的光声协同测量。后续将基于该实验系统实现血液流速和血管形态的活体测量,并进一步提升系统的成像分辨率及测速准确性。
[1] Gump F E, Price J B, Kinney J M. Blood flow and oxygen consumption in patients with severe burns[J]. Surgery, Gynecology & Obstetrics, 1970, 130(1): 23-28.
[2] Zhu X H, Chen J M, Tu T W, et al. Simultaneous and noninvasive imaging of cerebral oxygen metabolic rate, blood flow and oxygen extraction fraction in stroke mice[J]. NeuroImage, 2013, 64: 437-447.
[3] Beraia M, Beraia G. Investigation of the blood flow at the boundary layer by the magnetic resonance angiography in atherosclerosis[J]. Atherosclerosis, 2014, 235(2): e156.
[4] An Y R, Kang Y, Lee J, et al. Blood flow characteristics of diabetic patients with complications detected by optical measurement[J]. BioMedical Engineering OnLine, 2018, 17(1): 25.
[5] 梁艳梅, 杨子晗, 尚建伟, 等. 口腔癌筛查与诊断的影像学技术及发展趋势[J]. 中国激光, 2023, 50(15): 1507101.
[6] 孙彤, 黄国家, 张振辉. 基于高分辨光声显微成像的肝癌微血管特征分析[J]. 中国激光, 2023, 50(15): 1507105.
[7] Orizaga S, Riahi D N, Soto J R. Drug delivery in catheterized arterial blood flow with atherosclerosis[J]. Results in Applied Mathematics, 2020, 7: 100117.
[8] Hanson S R, Sakariassen K S. Blood flow and antithrombotic drug effects[J]. American Heart Journal, 1998, 135(5): S132-S145.
[9] Daubenspeck D, Chaney M A. Clinical importance of quantitative assessment of myocardial blood flow[J]. Journal of Cardiothoracic and Vascular Anesthesia, 2022, 36(6): 1511-1515.
[10] Thomas M, Sherwin R S, Murphy J, et al. Importance of cerebral blood flow to the recognition of and physiological responses to hypoglycemia[J]. Diabetes, 1997, 46(5): 829-833.
[11] Lopes M E A S A, Ribeiro J M, Teixeira-Carvalho A, et al. A functional assay using human whole blood and flow cytometry analysis to evaluate cytotoxicity and immunomodulatory effect of anti-Trypanosoma cruzi drugs[J]. Experimental Parasitology, 2023, 247: 108490.
[12] Wang L V, Yao J J. A practical guide to photoacoustic tomography in the life sciences[J]. Nature Methods, 2016, 13(8): 627-638.
[13] Steinberg I, Huland D M, Vermesh O, et al. Photoacoustic clinical imaging[J]. Photoacoustics, 2019, 14: 77-98.
[14] Fang H, Maslov K, Wang L V. Photoacoustic Doppler effect from flowing small light-absorbing particles[J]. Physical Review Letters, 2007, 99(18): 184501.
[15] Yao J J, Wang L V. Transverse flow imaging based on photoacoustic Doppler bandwidth broadening[J]. Journal of Biomedical Optics, 2010, 15(2): 021304.
[16] Zhou Y, Liang J Y, Maslov K I, et al. Calibration-free in vivo transverse blood flowmetry based on cross correlation of slow time profiles from photoacoustic microscopy[J]. Optics Letters, 2013, 38(19): 3882-3885.
[17] He Y, Wang L D, Shi J H, et al. In vivo label-free photoacoustic flow cytography and on-the-spot laser killing of single circulating melanoma cells[J]. Scientific Reports, 2016, 6: 39616.
[18] Na S, Russin J J, Lin L, et al. Massively parallel functional photoacoustic computed tomography of the human brain[J]. Nature Biomedical Engineering, 2022, 6(5): 584-592.
[19] Ermilov S A, Khamapirad T, Conjusteau A, et al. Laser optoacoustic imaging system for detection of breast cancer[J]. Journal of Biomedical Optics, 2009, 14(2): 024007.
[20] Oraevsky A A, Karabutov A A, Solomatin S V, et al. Laser optoacoustic imaging of breast cancer in vivo[J]. Proceedings of SPIE, 2001, 4256: 6-15.
[21] Qin W, Qi W Z, Jin T, et al. In vivo oral imaging with integrated portable photoacoustic microscopy and optical coherence tomography[J]. Applied Physics Letters, 2017, 111(26): 263704.
[22] Chen Q, Guo H, Jin T, et al. Ultracompact high-resolution photoacoustic microscopy[J]. Optics Letters, 2018, 43(7): 1615-1618.
[23] Zhou Y, Xing W, Maslov K I, et al. Handheld photoacoustic microscopy to detect melanoma depth in vivo[J]. Optics Letters, 2014, 39(16): 4731-4734.
[24] Hu T Q, Huang Z H, Ge P, et al. Adaptive denoising of photoacoustic signal and image based on modified Kalman filter[J]. Journal of Biophotonics, 2023, 16(5): 202200362.
[25] Agrawal S, Suresh T, Garikipati A, et al. Modeling combined ultrasound and photoacoustic imaging: simulations aiding device development and artificial intelligence[J]. Photoacoustics, 2021, 24: 100304.
[26] Wang L D, Yao J J, Maslov K I, et al. Ultrasound-heated photoacoustic flowmetry[J]. Journal of Biomedical Optics, 2013, 18(11): 117003.
[27] Yao J J, Maslov K I, Shi Y F, et al. In vivo photoacoustic imaging of transverse blood flow by using Doppler broadening of bandwidth[J]. Optics Letters, 2010, 35(9): 1419-1421.
[28] Upputuri P K, Pramanik M. Recent advances toward preclinical and clinical translation of photoacoustic tomography: a review[J]. Journal of Biomedical Optics, 2016, 22(4): 041006.
[29] Liang J Y, Zhou Y, Maslov K I, et al. Cross-correlation-based transverse flow measurements using optical resolution photoacoustic microscopy with a digital micromirror device[J]. Journal of Biomedical Optics, 2013, 18(9): 096004.
[30] Liu W, Lan B X, Hu L, et al. Photoacoustic thermal flowmetry with a single light source[J]. Journal of Biomedical Optics, 2017, 22(9): 096001.
Article Outline
许路寒, 张浩, 李东, 陈斌, 郑玉萍, 姚亮. 基于光声热测量法的血液流速无创测量[J]. 中国激光, 2024, 51(3): 0307205. Luhan Xu, Hao Zhang, Dong Li, Bin Chen, Yuping Zheng, Liang Yao. Non-Invasive Measurement of Blood Flow Velocity Based on Photoacoustic Calorimetric Measurement[J]. Chinese Journal of Lasers, 2024, 51(3): 0307205.
