New speckle pattern interferometry for precise in situ deformation measurements
1. Introduction
Optical interferometry[1–10] combined with digital phase-extraction algorithms is the current measurement method with the highest resolution. Its measurement resolution is only limited by background noise, and it can reach the nanometer level under vibration isolation. Therefore, it is the first choice for high-resolution measurements. However, this method requires strict control of environmental vibrations. Generally, it can only be used under vibration isolation in laboratory environments and cannot be applied in situ, which limits its application scenarios.
Optical interferometry can be categorized into specular interferometry and speckle interferometry. For specular interferometry, in recent years, researchers have proposed some phase-extraction methods to reduce the phase-shift errors caused by vibrations[11,12], such as random phase-shift algorithms[13–18], spatial phase-shifting interferometry[19], vibration-compensation methods[20,21], and tilt-compensation algorithms[22–27]. Some of these methods have been proven to work well under vibration conditions, and can be used for in situ measurements. However, specular interferometry is mainly used for optical surface measurements, while speckle interferometry can be used for deformation measurements, which has important applications in aerospace engineering, precision manufacturing industry, and other fields. Therefore, in this work, we pay more attention to the application of speckle interferometry for in situ deformation measurements. For speckle interferometry, researchers have also proposed some unique phase-shifting algorithms that can calculate the instantaneous phase[28–30], and some real-time measurement methods have been widely used in various fields[31,32]. For in situ deformation measurements, these methods can avoid the phase-shift errors caused by vibrations. However, in addition to phase-shift errors, there are two problems in the absence of vibration isolation: one is that the displacement caused by a vibration cannot be accurately distinguished from the deformation of the object itself, resulting in deformation errors; the other is that speckle decorrelation will occur when a vibration causes a large displacement, leading to a significant decrease in the fringe contrast. Common optical path interferometers such as shear speckle interferometers[33] are not sensitive to vibrations; in some cases, they can be used for in situ measurements[34,35], but they are powerless when speckle decorrelation occurs. Some researchers have proposed the method of in-plane displacement compensation to eliminate the influence of decorrelation[36], but the results were not encouraging. Therefore, how to realize speckle interferometry for in situ deformation measurements has been a difficult problem in academia for a long time.
For in situ measurements, it is difficult to perform vibration isolation of the whole experimental system because some large components or equipment cannot be placed on the vibration-isolation platform. However, it is possible to place the rest of the optical path except the test object on the vibration-isolation platform, or to integrate and fix the rest to achieve the stability of this optical path. In this study, we propose a new electronic speckle pattern interferometry approach that can be used for precise in situ deformation measurements. In this method, the vibration problem is simplified by separating the object from the vibration-isolation platform, a high-speed camera and multiple laser Doppler vibrometers (LDVs) are used for synchronous measurements to obtain a series of effective interferograms with known phase-shift amounts, and an iterative least-squares method is used to extract the deformation phase.
2. Principle
The proposed method can be applied to both out-of-plane deformation measurements and in-plane deformation measurements, with variations in the measurement optical paths. In this paper, the principle of the method is elaborated in detail based on the optical path for out-of-plane deformation measurements. Figure 1 illustrates the optical configuration for out-of-plane deformation measurements, which is insensitive to in-plane displacements. The optical path can be viewed as having two parts. (i) One part is a Michelson interferometer based on a high-speed camera, where after the laser passes through the spatial filter and convex lens, it is split into two beams by the beam splitter, which are, respectively, incident on the object surface and the reference surface and are diffusely reflected back to become the reference beam and object beam. The reference beam and the object beam interfere on the high-speed camera target surface to form a speckle interferogram, where fringe patterns can be obtained by subtracting the speckle field at different times. (ii) The other part consists of point vibration measurements made based on multiple LDVs, where the laser beams of the LDVs are noncollinear and are vertically incident on the rigid region of the object, such as edges and holders. According to the Doppler effect, the frequency of incident lasers will be modulated by the velocity of the object, and the out-of-plane displacements of measuring points can be extracted after frequency demodulation.
A high-speed camera is used to capture effective speckle interferograms. When displacements, especially in-plane displacements, caused by vibrations are excessive, speckle decorrelation can easily occur, resulting in reduced fringe contrast or even the disappearance of fringes. At the same time, in-plane displacements will also affect the phase calculation accuracy. However, since a vibration is reciprocating, as long as the object can return to the equilibrium position and the camera frame rate is sufficient, an interferogram with an ideal fringe contrast can always be recorded. By setting the fringe-contrast threshold, interferograms with a high fringe contrast and small in-plane displacements can be screened from multiple images, thereby avoiding the problem of speckle decorrelation and reducing the influence of in-plane displacements.
LDVs are used to obtain phase shifts for effective speckle interferograms. When the object is placed on a non-vibration-isolation platform, ground vibrations will cause rigid body displacements, which will change the phase of speckle interferograms. In this case, the ground is like a natural phase shifter, introducing different phase shifts at different times. For the screened speckle interferograms, the influence of in-plane displacements caused by vibrations can be ignored, and thus the out-of-plane displacements, , of the entire plane caused by vibrations can be obtained by fitting the data measured by multiple LDVs. When the high-speed camera is synchronized with the LDVs, according to Eq. (1), the phase changes, , caused by vibrations in the corresponding effective interferograms, which are seen as phase shifts, can be calculated,
Effective speckle interferograms after screening can be expressed as
When is known, can be solved by the least-squares method. We define , , and ; then, Eq. (2) can be rewritten as
The least-squares error between the theoretical model, , and the actually measured intensity, , can be expressed as
The least-squares criterion requires that
If it is nonsingular, we have
However, there is a certain error in the space axis calibration and time axis synchronization between the high-speed camera and the LDVs. In order to improve the calculation accuracy further, an iterative least-squares method is used to calculate the phase. The specific steps are described in detail in Ref. [24], and will not be elaborated here. LDVs provide a more accurate initial value of the phase shift, thus significantly improving the calculation speed and accuracy of this algorithm.
The deformation phase can be expressed as
3. Experiments
For verification of the effectiveness of the method, an experimental apparatus was built according to the above optical path. The test object was a circular aluminum plate with fixed edges and a loadable center. It had a diameter of 6 cm and a thickness of 1 mm. As shown in Fig. 2(a), by assembling the test object and the piezoelectric transducer (PZT), the PZT can be used to carry out central loading of the test object. The black component in Fig. 2(a) is the holder of the object, and it only had rigid body motion. The minimum resolution of the PZT (controller model E-710, displacement platform model P-622.1Cl; Physik Instrumente) is 10 nm. A high-speed camera (X213_ISP; Revealer) was used to record the speckle interferograms; its full-frame pixel resolution is , and its frame rate can reach up to 1,000,000 fps (frames per second) at a resolution of . An area with a size of in the center of the object was set as the region of interest (ROI), and the size of the corresponding interferograms was . The laser Doppler vibration measurement system used in the experiment is FNV-R4D-VD1, which contains four synchronized LDVs. The synchronization error between them is less than 20 ns. Their measurement frequency range is 0.1 Hz to 500 kHz, and their measurement resolution can reach 1 pm. Three of these LDVs were used for measurements of out-of-plane displacements caused by vibrations. Due to the high measurement accuracy of LDVs, even three LDVs can accurately fit the full-field displacements caused by vibrations. In order to enable the data of the three LDVs to fit the full-field displacements better, the incident laser points of the three LDVs were set to be scattered on the holder with the circular aluminum plate as the center. The specific spatial arrangement is shown in Fig. 2(b), while Fig. 2(c) is a plane view of the object, where the measuring points 2 and 3 of the LDVs were on the same horizontal line. The distance between them was 15 cm, the vertical distance between measuring point 1 and measuring points 2 and 3 was 12 cm, and the red region of the object was the speckle interference region.

Fig. 2. (a) Close-up view of the test object; (b) schematic diagram of the spatial arrangement of the LDVs; (c) plane view of the test object.
Before the measurements, the high-speed camera and laser Doppler vibration measurement system were calibrated along the spatial axis and synchronized along the time axis. To establish a correspondence between the points in the image and the laser points in space, the laser beams were incident onto the marked points attached on the surface of the object. The positions of the laser points in the camera image coordinate can be determined by extracting the positions of the corresponding marked points in the image. To synchronize the high-speed camera and the LDVs, the fourth LDV of the laser Doppler vibration measurement system was used as an auxiliary signal. By projecting the laser point of the fourth LDV onto the ROI of the interferograms and matching the signal change instant detected by the high-speed camera with the signal change instant detected by the fourth LDV, the high-speed camera and LDVs were set to high synchronization.
First, we carried out the static deformation experiment. For static deformations, the PZT was set to move 2 µm to load the center of the object, and the frame rate was set to 500 fps for the high-speed camera and LDVs. To facilitate the observations and calculations, a spatial carrier was introduced before deformations. To simulate the actual on-site measurements better, significant vibrations were introduced by tapping the desktop during measurements, the introduced vibration frequency ranged from 10 to 15 Hz, and the amplitude ranged from 2 to 25 µm. Interferograms and vibration data were collected continuously before and after applying the deformations, where Fig. 3(a) shows several interferograms before and after deformation. As we can see, due to the influence of the vibrations, the fringe direction and fringe number of each frame are different, and there are some interferograms with poor fringe contrast (like the interferograms in the green box). According to the set fringe contrast threshold, 10 interferograms were selected before and after deformation, respectively, to calculate the phase. Figure 3(b) shows the out-of-plane displacements of three points on the object caused by vibrations recorded by the LDVs. According to these data, the phase-shift plane can be fit at every moment, where Fig. 4 shows the fitted phase-shift planes at different times. Since the high-speed camera and LDVs were synchronized and in the same spatial coordinate system, it is easy to match the interferograms with the phase-shift planes.
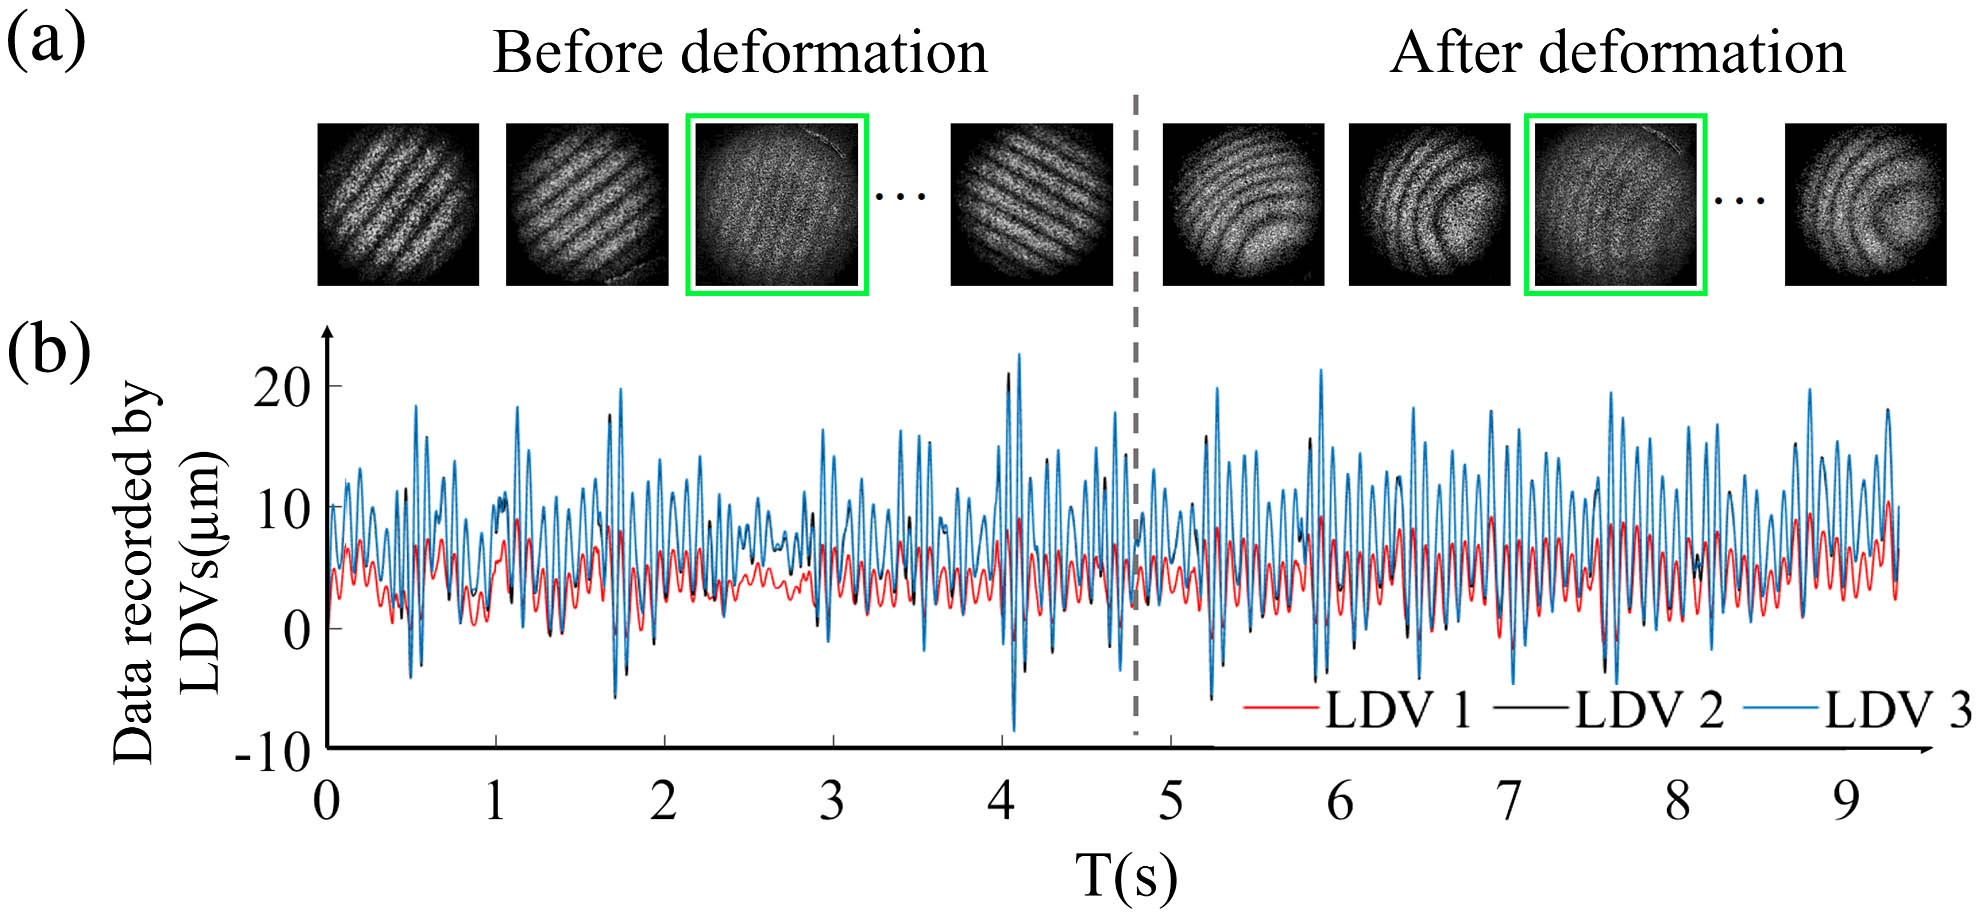
Fig. 3. (a) Interferograms before deformation and after deformation and (b) out-of-plane displacement caused by the vibrations recorded by the LDVs.
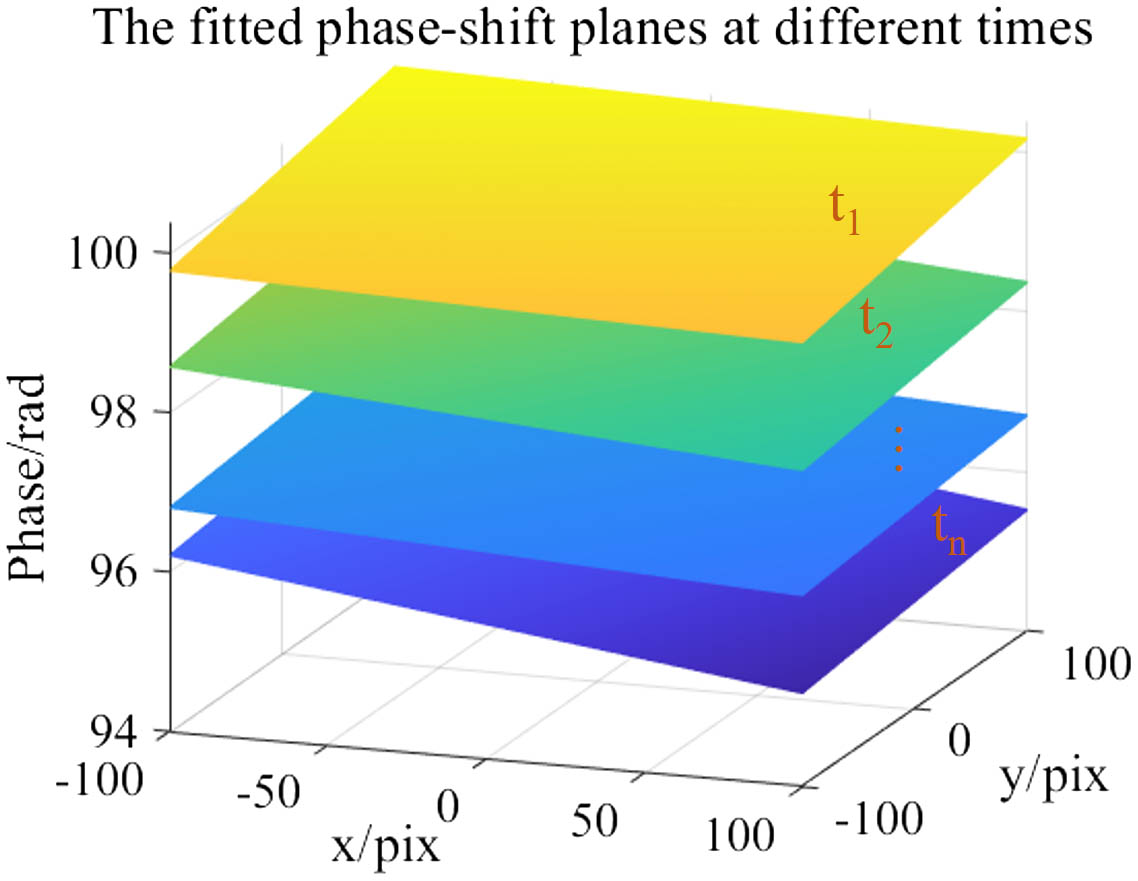
Fig. 4. Phase-shifted planes obtained by fitting the data measured by the LDVs at different times.
For static deformations, only the relative deformation phase can be calculated. To validate the measurement accuracy, the results calculated by the proposed method were compared with those obtained using the four-step phase-shifting method on the vibration-isolation platform, and the latter results were considered to be reliable. The deformation phase calculated by the four-step phase-shifting method under vibration isolation is shown in Fig. 5(a), and its peak-to-valley (PV) value is . The deformation phase of the object with non-vibration isolation calculated by the proposed method is illustrated in Fig. 5(b), whose PV value is . It can be seen that the numerical results and the phase distribution of the two methods are highly consistent. Figure 5(c) shows the calculation errors of these two methods, where the error of the PV value and rms of the error are and , respectively. To observe in more detail, Fig. 5(d) shows the data from some cross sections [as indicated in Figs. 5(a)–5(c)]. The experimental results show that the proposed method can realize speckle interferometry for deformation measurements when the object is not isolated from vibrations.
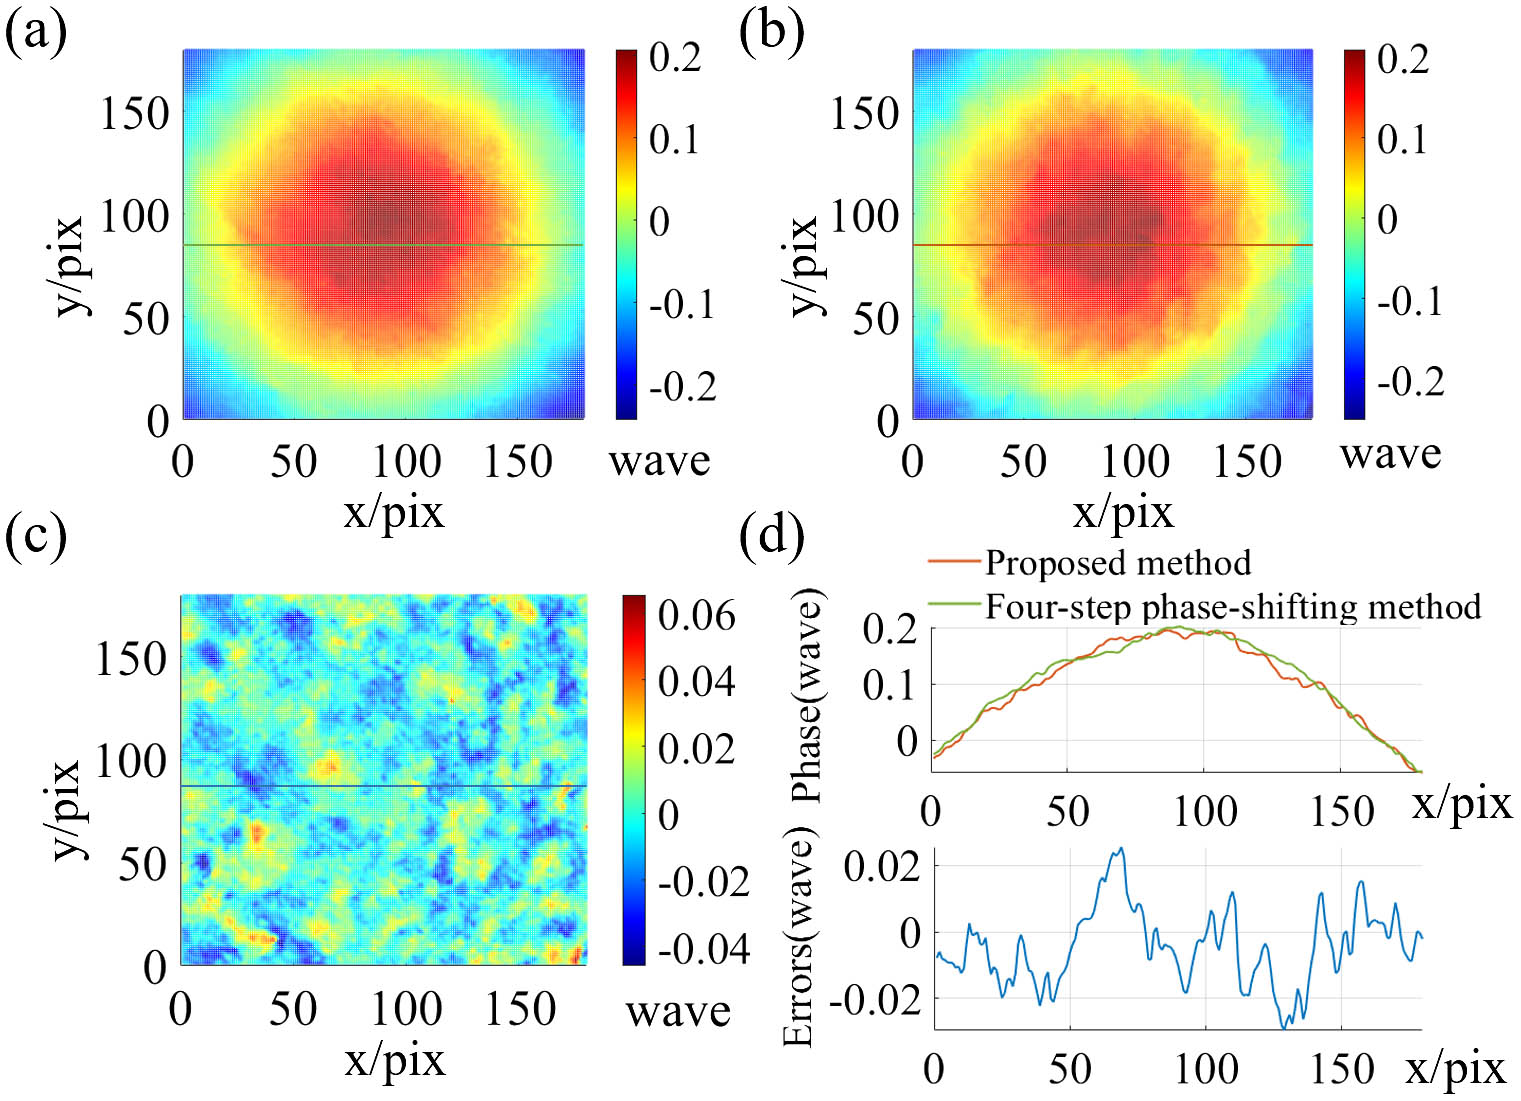
Fig. 5. (a) Deformation phase obtained by the four-step phase-shifting method; (b) deformation phase obtained by the proposed method; (c) calculation errors of these two methods; (d) data from the cross sections in panels (a)–(c).
Due to the high frame rates of the high-speed camera and LDVs, this method can also be applied to continuous dynamic deformation measurements when the object is undergoing slow deformations, where the deformation speed of the object is much less than the rigid motion speed caused by vibrations. The introduced vibration frequency ranged from 3 to 5 Hz, and the amplitude ranged from 2 to 10 µm. The PZT was set to move at a speed of 0.4 µm/s to load the object’s center. However, since the PZT will encounter resistance from the test object during the moving–loading process, the actual moving speed of the PZT was unknown. It was considered that the test object did not deform over a very short time, and there was only rigid body motion caused by the vibrations. The frame rate of the high-speed camera and LDVs was set to 1000 fps, and 10 frames of effective images were selected for calculations within 0.05 s, where the analysis was performed every 0.3 s. The absolute deformation phase at each moment was obtained by unwrapping the deformation phase along the time axis. Figures 6(a) and 6(b) show 3D and 2D plots of the deformation at , respectively. More details are shown in Fig. 7, where Fig. 7(a) shows the deformations for cross section L [indicated in Fig. 6(b)] at different instants, and the transient deformations of points A, B, and C are shown in Fig. 7(b). In order to verify the accuracy of the dynamic deformation measurement results, we compared them with the static measurement results with the same deformation amounts. Figure 6(c) shows the phase errors between them, where the PV error value and rms of the error are and , respectively. The results show that the proposed method can also be used to measure the continuous dynamic deformation of an object without vibration isolation.
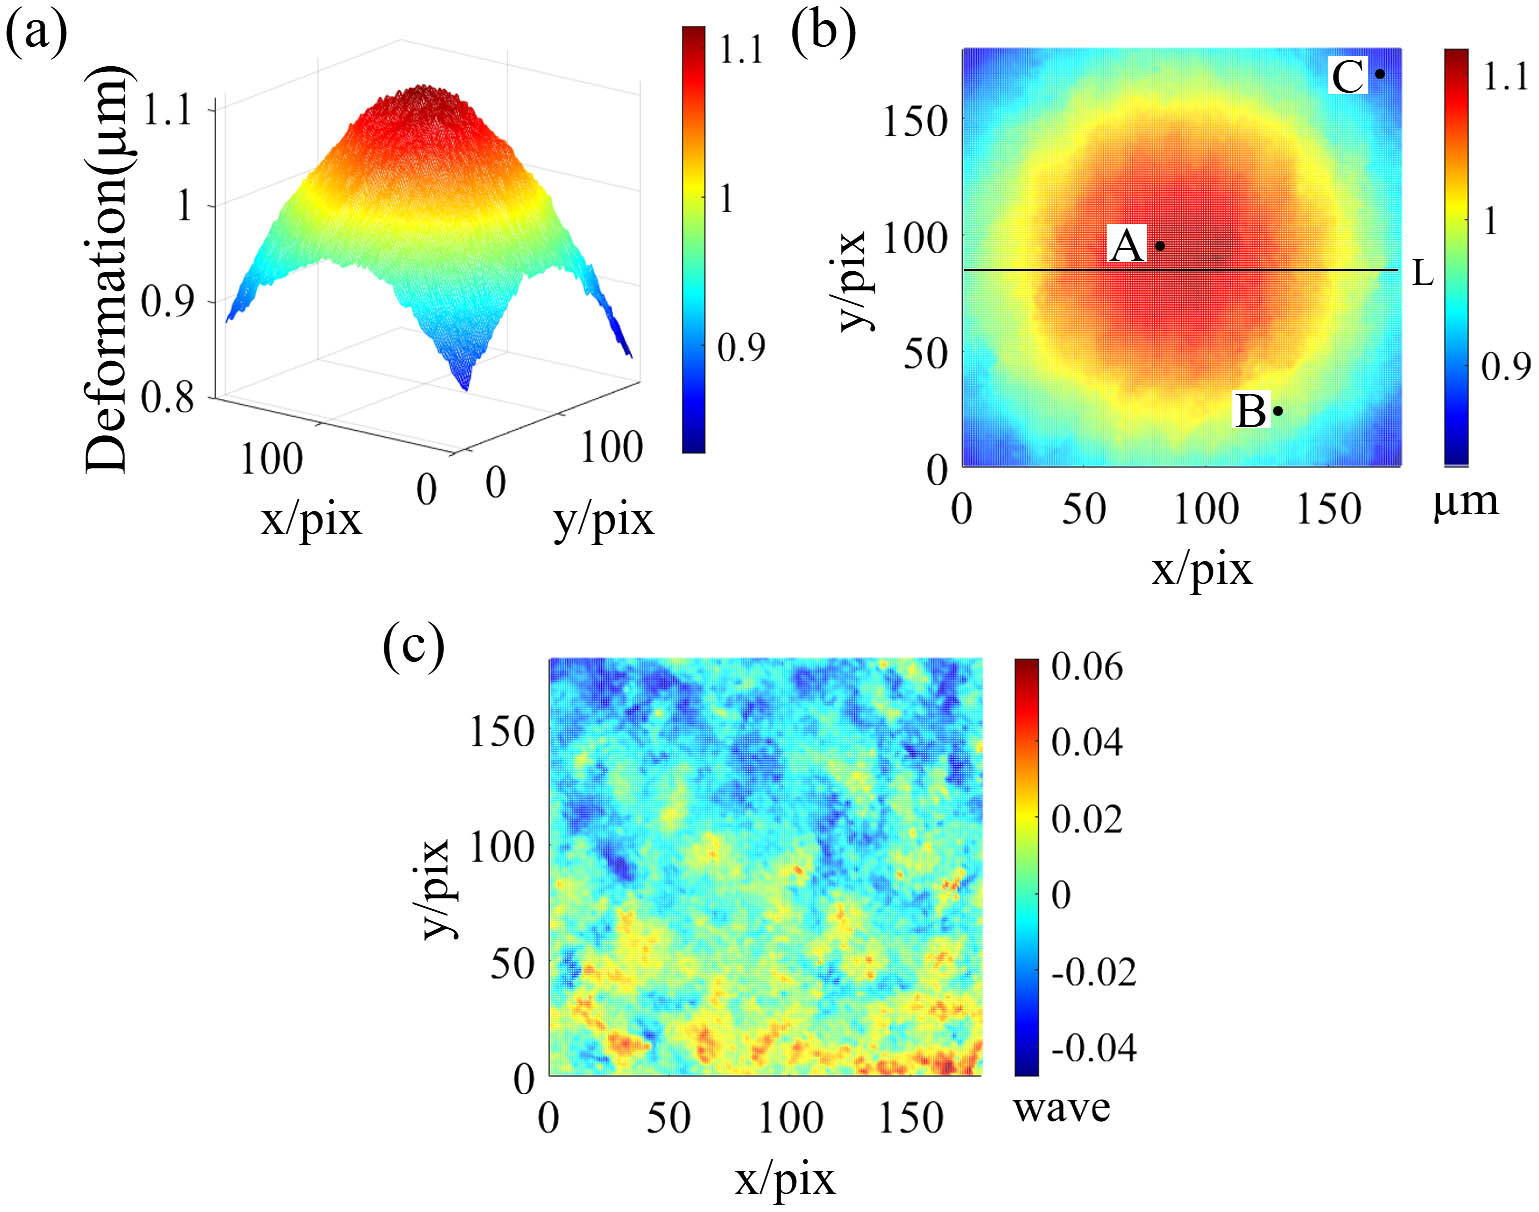
Fig. 6. (a) 3D plot and (b) 2D plot at the deformation time t = 3 s; (c) errors of the static measurements and dynamic measurements.
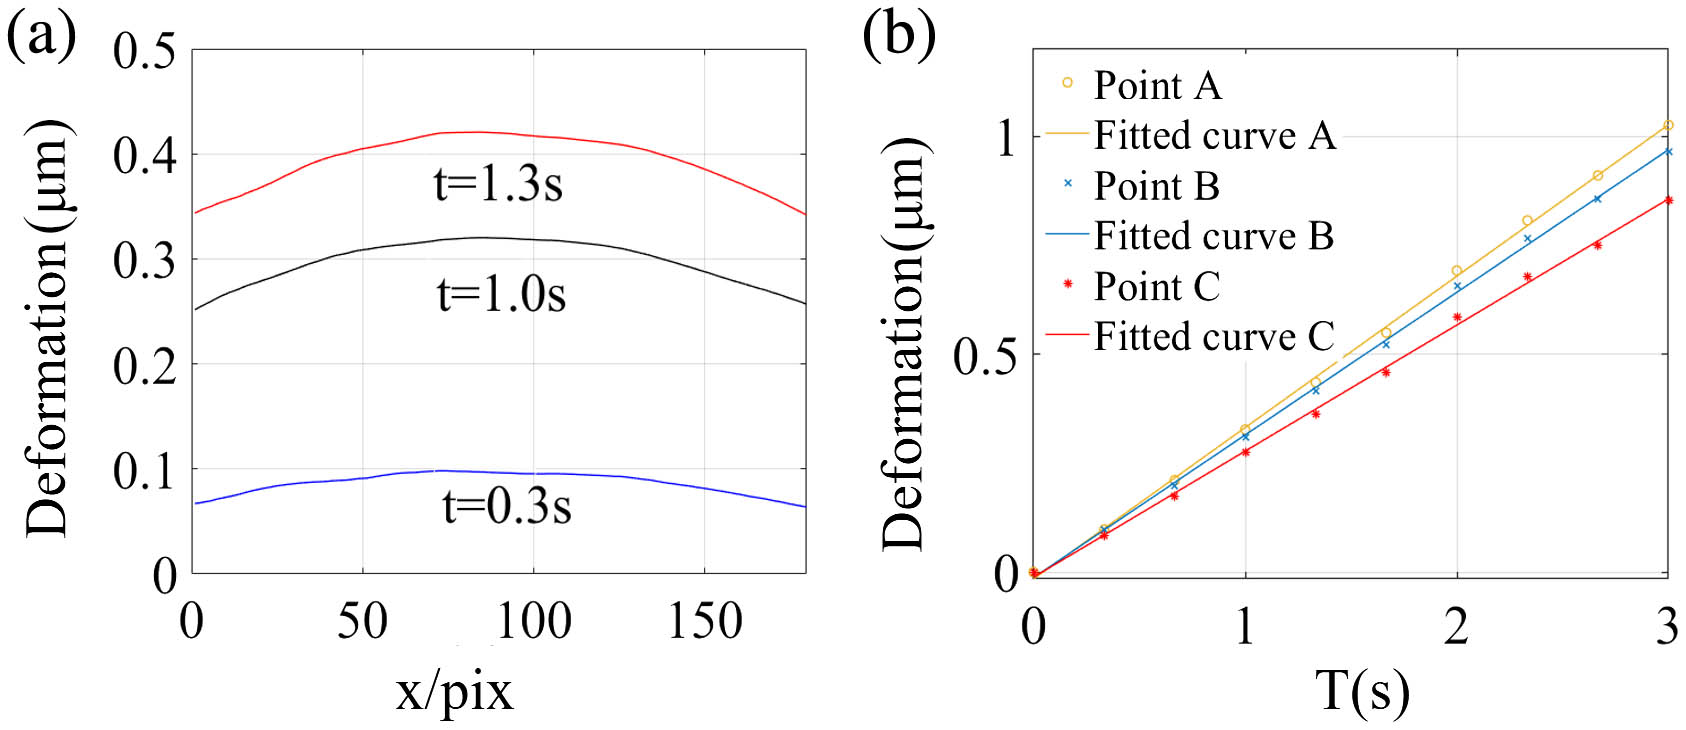
Fig. 7. (a) Deformations at cross section L at different instants and (b) transient deformations of points A, B, and C.
4. Discussions
The above experiments verified the effectiveness of the proposed method when the object is subjected to random low-frequency vibrations. However, the specific applicability range of this method requires further discussion.
On the one hand, the sensitivity of vibration measurements is related to the calibration and synchronization errors between the high-speed camera and LDVs.
The calibration errors on the spatial axis are primarily caused by the errors in the positions of the laser points in the image coordinates. The deviation range of the laser points on the markers is between 0 and 200 µm and the extraction accuracy for the positions of the markers can reach up to 0.02 pixels. Compared to the errors caused by the deviation between laser points and the marked points, the extraction errors of the marked points can be considered negligible.
The synchronization errors on the time axis are primarily caused by the signal-matching errors between the high-speed camera and the LDV. The signal change occurs simultaneously in both the high-speed camera and the LDV. Due to the extremely high measurement sensitivity of the LDV, the signal change instant detected by the LDV can be regarded as the reference point for signal change. However, the sampling interval of the high-speed camera is limited by the exposure time, which could lead to a potential error of about one sampling interval between the signal change instant detected by the high-speed camera and the reference point. With the current specifications of laser intensity, the shortest exposure time for the high-speed camera can be set to 0.15 ms. If the exposure time is set lower than this value, the imaging quality of the interferograms is not ideal due to the excessively weak intensity. This means that the synchronization errors of the high-speed camera and LDVs could be up to 0.15 ms.
These errors can lead to relatively large phase errors when vibrations cause significant tilting or rapid movement of the object. To ensure final calculation accuracy, even if an iterative method is used, the phase changes should not exceed within a range of 200 µm or within a time interval of 0.15 ms, which means the out-of-plane displacement deviation between laser points should not exceed 18 µm, and the object’s movement speed should not exceed 0.2 µm/ms.
On the other hand, the sensitivity of vibration measurements is related to the measurement sensitivities of the high-speed camera and LDVs. The LDV has a wide measurement range and can accurately measure vibrations within the frequency range of 0.1 Hz to 500 kHz. However, the high-speed camera does not perform well in all conditions for imaging. If there is an excessive displacement within the exposure time, it can lead to blurring of the interference pattern and result in phase errors. Therefore, the measurement sensitivity of this method is limited by the exposure time of the high-speed camera. Similarly, to ensure calculation accuracy, the object’s movement speed should not exceed 0.2 µm/ms.
Therefore, based on the existing experimental specifications, the applicable range of vibrations for the proposed method is constrained. For static deformation measurements, due to the relatively high sampling frame rate and the possibility of data selection, when data with slower movement of the object are selected, such as data from wave peaks, calculations can be performed at higher frequencies. For dynamic deformation measurements, the vibration frequency range for which the proposed method is applicable is more limited. To further expand the applicable range for vibrations, it is necessary to enhance the synchronization accuracy of the high-speed camera and LDVs, as well as to increase the laser intensity, which will be carried out in our subsequent work.
5. Conclusions
In conclusion, by separating only the object from the vibration-isolation platform, we simplify the vibration problem of the entire optical path to that of the object. A new electronic speckle pattern interferometry method for on-site measurements was proposed, which combines a high-speed camera and LDVs for synchronous measurements. The high-speed camera records and selects effective interferograms, solving the problem of decorrelation while the LDVs measure rigid body displacement caused by vibrations, solving the problem of inaccurate phase shifts. The experimental results show that the proposed method has good performance in measuring static and dynamic deformations when the object is not isolated from vibrations. In addition, this method is simple to construct and operate; if the rest of the interference optical path is integrated and fixed, the whole system can be directly placed on the ground, where LDVs capture the relative motion between the system and the object, and thus non-vibration isolation of the entire measurement system can be achieved. This new method can greatly improve the accuracy of on-site measurements, and has great potential in practical engineering applications.
Ruyue Zhang, Yu Fu, Hong Miao. New speckle pattern interferometry for precise in situ deformation measurements[J]. Chinese Optics Letters, 2024, 22(1): 011202.


