基于激光诱导击穿光谱的页岩与砂岩多元素定量分析【增强内容出版】
Shale oil is an important unconventional resource that has become a major development focus. Owing to the possible reserves of petroleum and natural gas, information from core samples, which mainly contain geochemical and mineralogical information, has attracted increasing attention from geologists and energy enterprises. Conventional analytical methods for mineralogical analysis, including inductively coupled plasma optical emission or mass spectrometry (ICP-OES/MS), instrumental neutron activation analysis (INNA), and X-ray fluorescence (XRF), are unsuitable for the in-situ analysis of shale because of their slow analysis speed and limited detection range. Laser-induced breakdown spectroscopy (LIBS) is a novel analytical method for various materials that uses laser pulses focused on a sample to generate laser-produced plasma and spectral emissions. With the advantages of minimal sample preparation, remote analysis, microsample ablation, and high analytical speed, LIBS is an optional access method for analysis of cores. In this study, multi-element quantitative analysis of natural shale and sandstone samples is conducted using a micro-LIBS system. A standardized spectral preprocessing method is developed to reduce spectral uncertainty, and a model input parameter optimization process is established to prevent model overfitting while improving model prediction accuracy. A quantitative analysis of Si, Ca, Fe, Al, Mg, and other elements in the shales and sandstones is performed, and the average predicted root-mean-square error of most samples is less than 1%, providing technical support for regular mineral component analysis and lithology identification of shales and sandstones.
A micro-LIBS system was established in this study, consisting of a laser, spectrometer, timing synchronizer, computer, and optical microscope. The system used a nanosecond-pulse laser to generate a laser beam that passes through a laser beam splitter and was sampled by a photodiode to detect the laser timing. The transmitted laser beam was introduced into an optical microscope, adjusted to be coaxial with the microscope illumination light path through a laser mirror, and finally focused on the sample surface through a near-infrared objective lens to generate plasma. Plasma emission was collected by a short-focus lens to an optical fiber and connected to a six-channel spectrometer for spectrum collection; the integration time was set to 1 ms. The laser pulse energy was adjusted to 30 mJ, and the detection delay of the spectrometer was set to 800 ns. Before the spectrum acquisition, two laser shots were applied for pre-ablation to stabilize the pulse energy, and 10 accumulated spectra were collected and analyzed. Partial least squares regression was used for the data analysis.
Because of the variety, inhomogeneity, and complexity of the samples, it is necessary to perform spectral line preprocessing and characteristic spectral line identification of the extracted spectra before quantitative analysis. Therefore, this study establishes a set of spectral data pre-processing procedures. After spectral preprocessing, the average relative standard deviation of a single shale sample (
To meet the demands of rapid quantitative determination of mineral element content in natural shale and sandstone samples, a microanalysis laser-induced breakdown spectroscopy system with automated analysis capabilities is developed to rapidly detect and analyze oil and gas shale and sandstone natural samples. A standard process for spectral data preprocessing is established, and the average relative standard deviation of shales is reduced from 32.50% to 14.53%, and from 56.01% to 33.92% for sandstones. This study proposes a quantitative analysis process based on partial least squares regression (PLSR) with Si, Ca, Fe, Al, and Mg quantitatively predicted. The R2 value for most samples is 0.95, and the RMSEC and RMSEP values are lower than 1%. This study provides technical support for the rapid analysis of the mineral components in shale and sandstone samples. The proposed data pre-processing and quantitative analysis is expected to become a technical standard for LIBS analyses.
1 引言
当前,全球油气勘探开发已进入常规油气稳定发展和非常规油气快速发展阶段。页岩油是一种非常重要的非常规油气资源,已成为一大开发热点。在油气资源勘探过程中,获取岩心矿物组分对于岩石岩性识别、储层评估以及油气资源开采具有重要意义[1-2]。目前,对岩石矿物组分进行分析的方法包括X射线荧光(XRF)[3]、电感耦合等离子体发射光谱/质谱法(ICP-OES/MS)[4]以及中子活化分析(INNA)等,这些方法依赖于实验室检测且需要对岩石进行制样与预处理,会破坏岩石结构而且耗时较长,难以满足孔隙度快速变化的岩心的检测需求。
激光诱导击穿光谱(LIBS)是一种新型的材料元素组分检测技术,其工作原理为:聚焦脉冲激光至待测样品表面产生等离子体,对等离子体的自发光进行光谱分析,获得样品中元素的种类与含量[5]。LIBS技术具有无需样本预处理、多元素同步检测、快速检测、准无损检测等优势,在冶金分析、地质环境检测、生物医学、核电安全等领域得到了广泛应用[6-14]。因此,LIBS技术为油气资源勘探与岩石矿物组分检测提供了可行方案。
面向岩石样本的多元素检测,国内外研究人员已经取得了一定研究进展。目前已经实现了岩石样本的多元素检测,如可对Si、Ca、Mg、Al等矿物元素进行成功识别和定量分析,同时,基于LIBS技术实现了岩石表面二维元素分布的表征[15-16]。2015年,Washburn[17]将LIBS技术应用于油气页岩的检测分析,结合偏最小二乘(PLS)方法初步实现了页岩中多元素定量预测。四川大学的Xu等[18-19]研究了页岩等离子体温度、电子密度与发射光谱的时间演化过程,并基于等离子体特性优化实验参数实现了元素定量分析与二维表征。2018年,Jain等[20]基于LIBS技术对开采的页岩样本表面进行了8 mm×8 mm二维多元素绘相,并将其应用于井场油气资源的识别与储层评价分析。上述研究证明了LIBS技术在岩石组分检测方面具有较大的应用优势,但由于岩石样本矿物组分构成多样并且基质效应显著,LIBS检测光谱存在不确定度较高、检测准确度和精密度较差的问题。针对这些问题,研究人员通过改进制样方法与引入机器学习方法降低了光谱不确定性,提高了定量分析的准确度[21-23]。然而,较为复杂的制样方法会增加LIBS检测的时间成本,降低LIBS技术的优势,同时多变量方法的应用尚未形成标准流程,且极易面临模型过拟合的风险。
针对上述问题,笔者基于显微分析LIBS系统,对油气页岩与砂岩天然样本进行了多元素定量分析,形成了流程化的光谱数据提取与预处理方法,简化了样本预处理过程并降低了光谱数据的不确定性,提出了模型输入参数优化流程,在防止模型过拟合的同时提高了模型预测准确度,为岩石样本多元素高精度检测标准的制定提供了参考。
2 实验与方法
2.1 实验设置
实验中使用自主设计搭建的显微分析LIBS系统,如
在实验中,调节激光脉冲能量为30 mJ,光谱仪探测延时设置为800 ns,通过调节Z轴电动高度升降台控制激光聚焦光斑的直径约为120 μm,每一个采集点进行2发次激光预烧蚀,并累计采集10发次光谱。为了降低由样本表面不均匀和等离子体不确定性造成的光谱波动,使用XY电动位移平台,在每个样品表面均匀采集30幅光谱,并对每三幅光谱进行平均。每个样品最终获取10幅光谱。
2.2 样品制备
实验中使用的样品为油气页岩与砂岩天然柱塞岩心与岩屑,共45块,其中页岩样本23块,砂岩样本22块。使用岩石线切割机对所有岩石样本进行切割,以获取适合LIBS检测的平整表面。典型的页岩与砂岩照片如
表 1. 页岩与砂岩样本中各元素的质量分数
Table 1. Mass fraction of each element in shale and sandstone samples
| ||||||||||||||||||||||||||||||||||||||||||||||||||||||||||||||||||||||||||||||||||||||
2.3 分析方法与指标
使用偏最小二乘回归(PLSR)对数据集进行分析处理。偏最小二乘回归是一种经典的多元线性回归模型,它通过在自变量集和因变量集中分别提取主成分来建立回归方程。需要注意的是,输入数据集的大小与最终选择的主成分(PC)的数量会直接影响模型的准确性。因此,在使用模型时通常需要考虑交叉验证的组合,以保证模型预测的有效性。偏最小二乘回归可以通过从高维变量中提取主成分生成一个低维空间来处理高维任务。
为了评估模型的泛化能力,笔者使用留一法交叉验证(LOOCV)对模型进行评估。对于含有n个样本的数据集,留一法每次从中选取一个样本作为测试集,将剩余的n-1个样本作为训练集,对目标样本进行预测。共循环n次完成对所有样本数据的利用。
使用决定系数(R2)、训练集均方根误差(RMSEC,在公式中记为
式中:n为训练集样本数;m为预测集样本数;
3 分析与讨论
3.1 光谱处理与分析
收集的典型页岩与砂岩的原始光谱及对应的显微照片如
基于NIST数据库,对页岩与砂岩中主要元素Si、Fe、Ca、Al、Mg、Mn、Na、K的原子谱线、离子谱线进行识别,共识别出Si特征原子谱线14条、Fe特征原子谱线68条、Fe特征离子谱线5条、Ca特征原子谱线32条、Ca特征离子谱线6条、Al特征原子谱线13条、Al特征离子谱线2条、Mg特征原子谱线15条、Mg特征离子谱线3条。
对所有样本的特征元素光谱进行识别,在谱线中心波长附近±2个像素内寻找光谱强度最大值并将其作为谱线峰值,然后将峰值附近±5个像素点储存起来作为输入变量集。天然岩石样本表面元素含量分布不均一性、激光能量发次不确定性、等离子体时空演化不确定性等导致同一样本各采集点光谱间的相对标准偏差较高,其中页岩各元素特征谱线强度的相对标准偏差为32.50%,砂岩为56.01%。较高的相对标准偏差会导致定量分析结果的不确定性增大,因此需要对光谱数据集进行预处理。
笔者对光谱作以下预处理:1)基于非二次成本函数对光谱仪每个通道的光谱分别进行基线拟合与校正;2)基于所有特征元素谱线获得输入变量集,然后减去各通道背景值,以提取净强度;3)识别和剔除小于三倍背景标准差(3δ)的谱线信息;4)按光谱仪通道对光谱进行归一化,识别并计算各通道所有符合三倍背景标准差原则的谱线平均峰值,将输入变量集的各谱线峰值除以各通道的平均峰值,得到标准化光谱
式中,
基于预处理前后的光谱数据集分别计算单一样本光谱间的相对标准偏差
式中:
表 2. 预处理前后光谱的相对标准偏差
Table 2. Relative standard deviation of spectra before and after pretreatment
| |||||||||||||||||||||||||||||||||||||||||||||||||||||||||
由
3.2 多元素组分定量分析
光谱经过预处理后得到3281维光谱数据集(作为输入变量),然而,较高的数据集维数和较高的主成分会导致模型出现过拟合,从而导致模型对训练样本预测结果较好而对新预测样本的预测结果较差,因此需要对模型输入数据维度与主成分进行优化。笔者建立了流程化的模型输入参数的优化流程,具体包括:1)识别特征元素谱线峰值及其附近±2个像素的光谱数据;2)选取具有最高相关系数的i×5个光谱像素点作为输入变量;3)选定主成分数为j;4)计算得到每次交叉验证对应的
本文取i最小值为1,最大值为40,即输入光谱维度最大为200,输入数据主成分(PC)的值最大为12,优化过程如
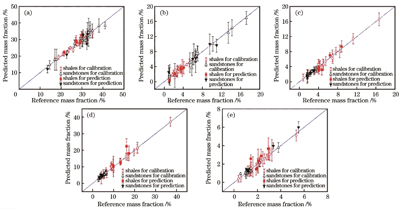
以Si元素为例,

图 7. Si、Ca、Fe、Al、Mg元素的定标曲线。(a) Si元素;(b) Ca元素;(c) Fe元素;(d) Al元素;(e) Mg元素
Fig. 7. Calibration curves of Si, Ca, Fe, Al, and Mg elements. (a) Si element; (b) Ca element; (c) Fe element; (d) Al element; (e) Mg element
表 3. Si、Ca、Fe、Al、Mg元素定量分析结果的评价指标
Table 3. Evaluation indexes of quantitative analysis of Si, Ca, Fe, Al, Mg elements
| ||||||||||||||||||||||||||||||||||||||||||||||||||||||||||
各元素质量分数预测值与参考值具有较高的线性拟合度,大部分元素的R2>0.95,RMSEC小于1%,说明PLSR模型可以较好地实现页岩与砂岩的多元素定量分析,同时大部分元素的RMSECV小于2%,说明训练集模型交叉验证结果良好,极大地避免了过拟合现象。对于模型测试集,大部分元素的RMSEP小于1%,说明PLSR模型对页岩与砂岩中主要元素的预测准确度较高,其中砂岩中的Si元素与页岩中的Al元素存在相对较高的RMSEP,分别为2.6230%与2.8818%。这是由元素较大的含量区间跨度以及较高含量下谱线的自吸收现象共同造成的。分析
4 结论
面向天然页岩与砂岩矿物样本元素含量快速定量检测的需求,笔者基于显微分析LIBS系统,针对岩石元素定量分析准确度低的难题,研究了光谱数据的预处理与模型优化方法,并对油气页岩与砂岩样本进行了多元素定量检测。
针对岩石样本基质复杂、元素分布不均等问题,笔者建立了光谱数据预处理标准流程,通过谱线筛选、基线校正、通道归一化等方法实现了页岩样本光谱间平均相对标准偏差从32.50%降低至14.53%,砂岩样本从56.01%降低至33.92%,显著降低了光谱不确定性。针对岩石样本定量预测准确度低的难题,笔者提出了一种基于PLSR的定量分析流程,通过遍历输入谱线维度与主成分数得到最优RMSEC与RMSECV,避免了模型欠拟合与过拟合,实现了页岩与砂岩中Si、Ca、Fe、Al、Mg等元素的定量分析,其中多数样本的R2>0.95,RMSEC小于1%,RMSEP小于1%。本研究为天然油气页岩与砂岩矿物组分的快速分析提供了技术支持,所提出的数据预处理与定量分析流程有望成为LIBS分析的技术标准。
[1] Ross D J K, Bustin R M. Investigating the use of sedimentary geochemical proxies for paleoenvironment interpretation of thermally mature organic-rich strata: examples from the Devonian-Mississippian shales, Western Canadian Sedimentary Basin[J]. Chemical Geology, 2009, 260(1/2): 1-19.
[2] Zhao X G, Kang J L, Lan B. Focus on the development of shale gas in China: based on SWOT analysis[J]. Renewable and Sustainable Energy Reviews, 2013, 21: 603-613.
[3] Nikonow W, Rammlmair D, Meima J A, et al. Advanced mineral characterization and petrographic analysis by μ-EDXRF, LIBS, HSI and hyperspectral data merging[J]. Mineralogy and Petrology, 2019, 113(3): 417-431.
[4] Momen A A, Zachariadis G A, Anthemidis A N, et al. Use of fractional factorial design for optimization of digestion procedures followed by multi-element determination of essential and non-essential elements in nuts using ICP-OES technique[J]. Talanta, 2007, 71(1): 443-451.
[5] 李祥友, 刘可, 周冉, 等. 激光诱导击穿光谱技术及应用综述[J]. 中国激光, 2022, 49(12): 1202003.
[6] 王金梅, 卢健树, 郑培超, 等. 基于LIBS技术结合内标法的烧结矿碱度测量研究[J]. 中国激光, 2023, 50(22): 175-182.
Wang J M, Lu J S, Zheng P C, et al. Study on alkalinity measurement of sinter based on libs technology combined with internal standard method[J]. Chinese Journal of Lasers, 2023, 50(22): 175-182.
[7] 邱苏玲, 李安, 王宪双, 等. 基于激光诱导击穿光谱的矿石中铁含量的高准确度定量分析[J]. 中国激光, 2021, 48(16): 1611002.
[8] 时铭鑫, 王傲松, 黄大鹏, 等. 基于支持向量机和随机森林算法结合光纤式激光诱导击穿光谱定量检测核电用钢中铬[J]. 冶金分析, 2021, 41(1): 30-40.
Shi M X, Wang A S, Huang D P, et al. Quantitative analysis of chromium by fiber-optic laser-induced breakdown spectroscopy of steels for nuclear power plant based on support vector regression and random forest regression[J]. Metallurgical Analysis, 2021, 41(1): 30-40.
[9] Dyar M D, Giguere S, Carey C, et al. Comparison of baseline removal methods for laser-induced breakdown spectroscopy of geological samples[J]. Spectrochimica Acta Part B: Atomic Spectroscopy, 2016, 126: 53-64.
[10] 白伟洋, 陈蔚芳, 杨成杰, 等. 基于LIBS技术的不锈钢精细分类方法[J]. 激光与光电子学进展, 2022, 59(23): 2330001.
[11] 沙文, 李江涛, 鲁翠萍. 基于激光诱导击穿光谱技术寻优定量分析土壤中Mn元素[J]. 中国激光, 2020, 47(5): 0511001.
[12] 潘超超, 赵南京, 马明俊, 等. 基于激光诱导击穿光谱技术的土壤镉元素高灵敏检测[J]. 激光与光电子学进展, 2023, 60(17): 1730006.
[13] 李晨红, 闫薪如, 辛英健, 等. 基于 LIBS技术结合AFSA-SVM算法对岩石类别的识别[J]. 激光与光电子学进展, 2023, 60(9): 0930002.
[14] 陈世航, 刘莉, 邓志伟, 等. 基于单激光构造的DP-LIBS对钽铌矿的检测研究[J]. 激光与光电子学进展, 2023, 60(13): 1330001.
[15] Sanghapi H K, Jain J, Bol'shakov A, et al. Determination of elemental composition of shale rocks by laser induced breakdown spectroscopy[J]. Spectrochimica Acta Part B: Atomic Spectroscopy, 2016, 122: 9-14.
[16] Quarles C D, Jr, Miao T, Poirier L, et al. Elemental mapping and characterization of petroleum-rich rock samples by laser-induced breakdown spectroscopy (LIBS)[J]. Fuels, 2022, 3(2): 353-364.
[17] Washburn K E. Rapid geochemical and mineralogical characterization of shale by laser-induced breakdown spectroscopy[J]. Organic Geochemistry, 2015, 83/84: 114-117.
[18] Xu T, Zhang Y, Zhang M, et al. Temporal-resolved characterization of laser-induced plasma for spectrochemical analysis of gas shales[J]. Spectrochimica Acta Part B: Atomic Spectroscopy, 2016, 121: 28-37.
[19] Xu T, Liu J, Shi Q, et al. Multi-elemental surface mapping and analysis of carbonaceous shale by laser-induced breakdown spectroscopy[J]. Spectrochimica Acta Part B: Atomic Spectroscopy, 2016, 115: 31-39.
[20] Jain J, Quarles C D, Jr, Moore J, et al. Elemental mapping and geochemical characterization of gas producing shales by laser induced breakdown spectroscopy[J]. Spectrochimica Acta Part B: Atomic Spectroscopy, 2018, 150: 1-8.
[21] Yao S C, Zhao J B, Xu J L, et al. Optimizing the binder percentage to reduce matrix effects for the LIBS analysis of carbon in coal[J]. Journal of Analytical Atomic Spectrometry, 2017, 32(4): 766-772.
[22] Shi L L, Lin Q Y, Duan Y X. A novel specimen-preparing method using epoxy resin as binding material for LIBS analysis of powder samples[J]. Talanta, 2015, 144: 1370-1376.
[23] 赵文雅, 闵红, 刘曙, 等. 人工神经网络在激光诱导击穿光谱数据分析中的应用进展[J]. 光谱学与光谱分析, 2021, 41(7): 1998-2004.
时铭鑫, 吴坚, 吴迪, 李京徽, 邱岩, 郭歆宇, 周颖, 宋自远, 陈民鑫. 基于激光诱导击穿光谱的页岩与砂岩多元素定量分析[J]. 中国激光, 2024, 51(8): 0811002. Mingxin Shi, Jian Wu, Di Wu, Jinghui Li, Yan Qiu, Xinyu Guo, Ying Zhou, Ziyuan Song, Minxin Chen. Multi-Element Quantitative Analysis of Shale and Sandstone Based on Laser Induced Breakdown Spectroscopy[J]. Chinese Journal of Lasers, 2024, 51(8): 0811002.


