基于星载激光雷达与多光谱影像结合的土地覆盖分类方法【增强内容出版】
Changes in land cover types lead to numerous ecological and environmental issues. For effective resolution of these issues, monitoring changes in land cover is crucial. Numerous studies have explored the use of full-waveform LiDAR for land cover classification. However, its accuracy can diminish with increasing classification categories. Enhancing classification accuracy necessitates the integration of auxiliary features with waveform features. Research indicates that combining waveform features with the spectral features of optical images can enhance the precision of land cover classification. Given the broad distribution of GEDI data across Earth's surface, it is valuable to investigate if merging GEDI waveform features with optical image spectral features positively impacts land cover classification. Improved accuracy could expand training/validation samples, particularly in regions with limited field surveys or high-resolution remote sensing data. This could enrich the sample pool for land cover classification tasks, thereby boosting overall classification accuracy.
A support vector machine (SVM) was used to classify footprints. First, the GEDI L2A footprint points in the study area in 2020 were extracted, and survey data were used to label the ground object categories under the footprint points. Simultaneously, the spectral reflectance of Landsat remote sensing images at the footprint points was extracted and the vegetation index was calculated. Second, the waveform information and spectrum at the footprint point were normalized, and the sample data were randomly divided into training and verification datasets. Among them, 70% of the training data were used to train the SVM classification model, and 30% were used to verify its accuracy of the classification model. Next, the feature vectors in the training dataset were input into the SVM classification model, and GridSearchCV was used to search for the penalty coefficient and kernel function of the SVM to obtain the optimal parameters and train the optimal classification model of the footprint points. Subsequently, the producer accuracy (PA), user accuracy (UA), overall accuracy (OA), and Kappa coefficient were calculated using the validation dataset to evaluate the model. Finally, the sample data from the six subregions of the study area were extracted. The classification results for the other regions were predicted based on the data training model for each region, and the adaptability of the method was evaluated.
The importance of two types of source variables (waveform and spectrum) is calculated by using the experiment of the importance of the general classification model (Fig. 3), and multiple feature groups (Table 6) are set according to the feature source and importance to train the prediction model respectively. The evaluation of the model shows that the overall accuracy of using only one type of feature is less than 82%; however, the OA can reach 90.68 % when used together (Table 7?11). This shows that the combination of the spectral characteristics of Landsat spectral data and the waveform data of GEDI full-waveform LiDAR data improves the accuracy of land cover classification. The applicability of the method is tested across six subregions (plains, mountains, and hilly landforms) within the study area. Tables 12 and 13 demonstrate the proposed method's strong applicability. However, during the applicability test, challenges may arise due to the limited sample size and imbalanced data distribution. The model's practicality can be achieved by increasing the number of samples and ensuring a balanced dataset.
The spectral characteristics of the Landsat spectral data and waveform data of the GEDI full-waveform LiDAR data can be used to improve the accuracy of land cover classification. The overall accuracy of the combined use of spectral and waveform features is 90.68%, which can be improved by more than 8 percentage points when compared to a single feature. When the spectral characteristics of local objects are similar, the structural information provided by the waveform characteristics plays an important role in distinguishing different land cover types. Similarly, when the same types of objects with different structural characteristics or different types of objects with the same structural characteristics appear, the spectral characteristics play a key role. Additionally, data from six subregions in the dataset are utilized to test the applicability of the test model. The results indicate that the proposed method exhibits good universal applicability. Therefore, the combined use of height and spectral features from the GEDI and Landsat OLI data is beneficial for land cover classification of GEDI footprints.
1 引言
人类活动会导致土地覆盖类型发生变化,带来了越来越多的生态和环境问题。为有效解决环境问题,进行土地覆盖类型变化监测迫在眉睫[1-2]。遥感提供了测量大面积地物特征的方法。随着对地观测技术的快速发展,全波形激光雷达以其独特的波形特征,在城区覆盖分类[3-5]、极地覆盖分类[6-7]和林业林种分类[8-11]等方面展现出了巨大优势。
国内外学者针对全波形激光雷达在土地覆盖分类中的应用开展了较多研究。Pirotti[12]认为波形特征不仅可以提供目标的高度信息,还可以提供目标的一些结构信息。目前,研究人员已经可以利用波形特征来识别特定的土地覆盖类型,例如冰雪[6-7]、森林[13-18]、湖泊[19-20]和城市[3, 21]。但是已有的研究也表明仅利用波形数据进行分类会存在一些问题,例如:随着地物类别增加,分类准确度会下降;不同类别的地物有着相似的波形特征,从而导致分类精度较差[13,16]。为了提高分类的准确率,需要在波形特征中添加辅助特征。已有研究通过将波形特征与光学影像的光谱特征结合起来提高土地覆盖分类的准确率[22-25],比如,Liu等[22]将GLAS与Landsat相结合获得了91%的分类精度。
目前,星载全波形雷达产品主要有NASA的ICESat/GLAS、全球生态系统动力学调查(Global Ecosystem Dynamics Investigation,GEDI)以及国产高分7号卫星。与GEDI相比,GLAS只有2003年至2009年的观测数据,无法用于现在土地覆盖的研究。GEDI的数据始于2019年,可以更好地反映土地覆盖类型的垂直结构,并且其脚印点直径为25 m,可以更好地与Landsat 30 m分辨率的遥感影像匹配。
目前还没有联合使用GEDI足迹的波形属性与光学影像的光谱特征进行土地覆盖分类的研究,因此,将GEDI波形特征与光学影像的光谱特征结合起来对土地覆盖类型进行分类具有积极意义。如果分类精度足够高,可以在难以进行实地调查或无法获取高分辨率遥感图像的地区得到大量的训练/验证样本,从而补充土地覆盖分类任务的样本,进而提高分类的准确度。笔者开发了一种新的土地覆盖分类的方法,该方法集成了GEDI的波形特征和Landsat OLI的光谱特征,同时利用支持向量机(SVM)作为分类器。本文将联合使用GEDI波形特征和光学影像光谱特征的分类结果与单一数据的分类结果进行了对比,以便将所提方法用于在较大区域进行GEDI脚印点的分类。
2 研究方法
2.1 GEDI数据选取与预处理
GEDI于2019年开始工作并得到数据,笔者选取了2020年5月1日至2020年10月30日采集的L2A数据。GEDI L2A数据集经过6种不同算法设置的处理得到了不同的波形特征。本研究提取的参数包括与光斑质量相关的参数(如quality_flag、degrade_flag、sensitivity等)、地面高程elev_lowestmode和波形特征百分位高度(如rh0、rh25、rh50、rh75、rh100等),还有其他相关特征,如高斯分量个数(rx_nummodes)、每个高斯分量的中心位置(rx_modelocs)、每个高斯分量的宽度(rx_modewidths)等。具体参数如
表 1. GEDI L2A提取参数列表
Table 1. GEDI L2A extraction parameters list
|
GEDI L2A包含了数据质量判断参数(如质量标志参数quality_flag)、灵敏度参数(sensitivity)等,可以使用这些标志参数剔除每种算法设置中地理定位精度差的光斑、信号质量差的波形以及受云和其他地表条件影响的无效光斑,保留每种算法设置中质量较好的GEDI光斑。为了获取研究区内高质量的GEDI光斑,首先用GEDI L2A的经纬度lon_lowestmode、lat_lowestmode选出研究区内的GEDI光斑,然后用GEDI L2A数据包含的质量相关参数剔除部分无效GEDI光斑。具体筛选条件如
表 2. GEDI L2A有效足迹筛选条件
Table 2. GEDI L2A valid footprint screening conditions
|
2.2 Landsat特征选取
Landsat光谱数据来自Google Earth Engine数据库中的USGS Landsat 8 Surface Reflectance Tier 1数据集,采集时间为2020年1月1日至2020年12月31日,采用的波段信息如
表 3. Landsat光谱波段的基本信息
Table 3. Basic information of Landsat spectral band
|
光谱特征除遥感影像原始波段以外还有多个光谱指数,如归一化植被指数(NDVI,在公式中记为ζNDVI)、归一化差异水体指数(NDWI,在公式中记为ζNDWI)、归一化建筑指数(NDBI,在公式中记为ζNDBI)、增强型植被指数(EVI,在公式中记为ζEVI)、比值植被指数(RVI,在公式中记为ζRVI)、大气阻抗植被指数(ARVI,在公式中记为ζARVI)。植被指数的具体计算公式如
2.3 支持向量机
支持向量机(SVM)是建立在统计学习理论基础上的一种数据挖掘方法,能非常有效地处理分类问题[26-28]。SVM不要求数据符合高斯分布,其优点是只要求少的训练样本,而且可以处理高维数据(即特征数多的数据),对休斯现象不敏感。
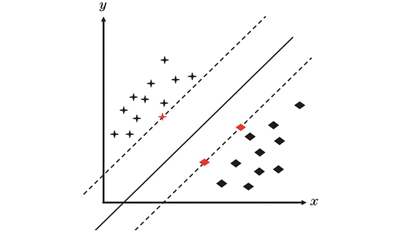
SVM分类器的目标是找到一个最优的线性超平面,使两类训练样本尽可能分开,如
SVM借助二次规划问题来求解支持向量,即
式中:C为惩罚系数,用来控制分类器的归一化能力,由用户选择;
式中:γ为核参数。
2.4 基于SVM的脚印点分类模型
本文构建的SVM脚印点分类模型的具体分类流程如下所述:
步骤1:提取研究区内2020年的GEDI L2A脚印点,然后利用调查数据对脚印点下的地物类别进行标注,同时提取脚印点处的Landsat遥感影像的光谱反射率,并计算植被指数。
步骤2:将脚印点处的波形信息和光谱作归一化处理,并将样本数据随机划分为训练数据集和验证数据集,其中70%的训练数据用于训练SVM分类模型,剩下的30%用于验证分类模型的精度。
步骤3:将训练数据集中的特征向量输入到SVM分类模型,使用GridSearchCV对SVM的惩罚系数和核函数进行搜索得到最优参数并训练构建脚印点最优分类模型。
步骤4:利用验证数据集计算生产者准确性(PA)、用户准确性(UA)、总体准确率(OA)和Kappa系数,用这些参数对模型进行评价。
步骤5:提取研究区6个子区域内的样本数据,基于每个区域内的数据训练模型,预测其他区域的分类结果,对所提方法的适用性进行评价。
3 分析与讨论
3.1 样本筛选结果
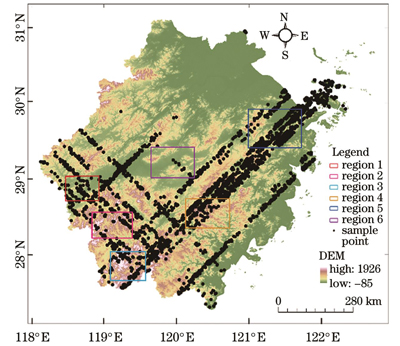
经过处理和筛选后样本总数为2902个,样本分布情况如
表 5. 各土地覆盖类别的样本数
Table 5. Sample size for each land cover category
|
为了消除特征之间的量纲影响,同时为了解决数据特征之间的可比性,需要对数据进行标准化处理。经过数据标准化处理后,各指标处于同一数量级,适合进行综合对比。利用
式中:x是原始值;y是缩放后的值;
3.2 特征选择
笔者计算了两类源变量(波形和光谱)对一般分类模型的重要性。
3.3 土地覆盖分类结果与分析
将光谱特征和波形特征以各种组合进行分组,如
表 6. 不同的特征组
Table 6. Different groups of features
|
表 7. 特征组1的混淆矩阵
Table 7. Confusion matrix of feature group 1
| ||||||||||||||||||||||||||||||||||||||||||||||||||||||||||||||||||||||||||||
表 8. 特征组2的混淆矩阵
Table 8. Confusion matrix of feature group 2
| ||||||||||||||||||||||||||||||||||||||||||||||||||||||||||||||||||||||||||||
表 9. 特征组3的混淆矩阵
Table 9. Confusion matrix of feature group 3
| ||||||||||||||||||||||||||||||||||||||||||||||||||||||||||||||||||||||||||||
表 10. 特征组4的混淆矩阵
Table 10. Confusion matrix of feature group 4
| ||||||||||||||||||||||||||||||||||||||||||||||||||||||||||||||||||||||||||||
表 11. 特征组5的混淆矩阵
Table 11. Confusion matrix of feature group 5
| ||||||||||||||||||||||||||||||||||||||||||||||||||||||||||||||||||||||||||||
表 12. 子区域内土地覆盖类别的样本数量
Table 12. The number of samples of land cover categories in the subregion
| |||||||||||||||||||||||||||||||||||||||||||||||||||||||
表 13. 子区域预测结果的OA
Table 13. The overall accuracy of sub-region prediction results
| |||||||||||||||||||||||||||||||||||||||||||||||||||||||
对比
为了验证所提方法的适用性,选择研究区内6块子区域(包含平原、山地和丘陵地貌)的实地调查数据进行模型训练和模型结果验证。由于实地调查点数量有限,因此采取目视识别的方式补充部分样点,但在某些区域一些地物的样点数量依然偏少,每个区域样本数如
4 结论
本文提出了一种融合多光谱遥感影像数据和星载全波形激光雷达数据进行土地覆盖分类的方法,该方法通过联合Landsat光谱数据的光谱特征和GEDI全波形激光雷达数据的波形数据来提高土地覆盖分类预测的准确性。光谱特征和波形特征联合使用时的OA为90.68%,相比使用单一特征时的OA至少可以提升8个百分点。当地物的光谱特征相似时,波形特征提供的结构信息在区分不同的土地覆盖类型方面起着重要作用,同样,当出现具有不同结构特性的同类型物体或具有相同结构特性的不同类型物体时,光谱特征起关键作用。此外,本文利用数据集中6个子区域的数据进行了测试模型适用能力的检验,结果表明所提方法具有较好的普遍适用性。因此,联合使用来自GEDI和Landsat OLI数据的高度和光谱特征有利于GEDI足迹的土地覆盖分类。
此外,GEDI L2A包含的数据特征来自原始波形处理后的结果,如果直接使用L1B的原始波形或者经过处理后得到的波形特征,对于提升分类的准确度可能会有较大帮助,并且添加地物的结构特征后可能会实现对森林中具体树种的精准分类。因为实地调查获取的数据较少,而且这些数据在空间上呈非均匀分布,在进行方法适用性测试时需要划分为多个区域,导致每个区域内的样本数量少且类别数不均衡,进而导致模型准确率有所下降。如果增加每个区域内的样本数量并且平衡每个类别的样本数,则在验证区域可能会获得更优的实验结果。
[1] Abbasi M K, Zafar M, Khan S R. Influence of different land-cover types on the changes of selected soil properties in the mountain region of Rawalakot Azad Jammu and Kashmir[J]. Nutrient Cycling in Agroecosystems, 2007, 78(1): 97-110.
[2] Dallmeyer A, Claussen M. The influence of land cover change in the Asian monsoon region on present-day and mid-Holocene climate[J]. Biogeosciences, 2011, 8(6): 1499-1519.
[3] Cheng F, Wang C, Wang J L, et al. Trend analysis of building height and total floor space in Beijing, China using ICESat/GLAS data[J]. International Journal of Remote Sensing, 2011, 32(23): 8823-8835.
[5] Mallet C, Bretar F, Roux M, et al. Relevance assessment of full-waveform lidar data for urban area classification[J]. ISPRS Journal of Photogrammetry and Remote Sensing, 2011, 66(6): S71-S84.
[6] Molijn R A, Lindenbergh R C, Gunter B C. ICESat laser full waveform analysis for the classification of land cover types over the cryosphere[J]. International Journal of Remote Sensing, 2011, 32(23): 8799-8822.
[7] 谭继强, 詹庆明, 韩凉, 等. ICESat GLAS完整波形信号处理技术在南极查尔斯王子山脉地区地表覆盖分类中的应用研究[J]. 测绘与空间地理信息, 2016, 39(4): 8-12.
Tan J Q, Zhan Q M, Han L, et al. ICESat/GLAS full waveform signal processing for land cover classification in Antarctica prince Charles Mountains[J]. Geomatics & Spatial Information Technology, 2016, 39(4): 8-12.
[8] Nelson R, Ranson K J, Sun G, et al. Estimating Siberian timber volume using MODIS and ICESat/GLAS[J]. Remote Sensing of Environment, 2009, 113(3): 691-701.
[9] Yao W, Krzystek P, Heurich M. Tree species classification and estimation of stem volume and DBH based on single tree extraction by exploiting airborne full-waveform LiDAR data[J]. Remote Sensing of Environment, 2012, 123: 368-380.
[10] Neuenschwander A L, Magruder L A, Tyler M. Landcover classification of small-footprint, full-waveform lidar data[J]. Journal of Applied Remote Sensing, 2009, 3(1): 033544.
[11] Fieber K D, Davenport I J, Ferryman J M, et al. Analysis of full-waveform LiDAR data for classification of an orange orchard scene[J]. ISPRS Journal of Photogrammetry and Remote Sensing, 2013, 82: 63-82.
[12] Pirotti F. IceSAT/GLAS waveform signal processing for ground cover classification: state of the art[J]. Italian Journal of Remote Sensing, 2010, 42(2): 13-26.
[13] Duong H, Pfeifer N, Lindenbergh R. Full waveform analysis: ICESat laser data for land cover classification[J]. International Archives of Photogrammetry, Remote Sensing and Spatial Information Sciences, 2006, 36(7): 30-35.
[14] ChengX. Waveform-based classification of medium-footpoint LVIS data[C]∥13th International Conference onLidar Applications for Assessing Forest Ecosystems, October 9, 2012, Beijing, China. [S.l.:s.n.], 2013:9-17.
[15] 陈向宇, 云挺, 薛联凤, 等. 基于激光雷达点云数据的树种分类[J]. 激光与光电子学进展, 2019, 56(12): 122801.
[16] Ghosh S, Nandy S, Patra S, et al. Land cover classification using ICESat/GLAS full waveform data[J]. Journal of the Indian Society of Remote Sensing, 2017, 45(2): 327-335.
[17] 陈博文, 史硕, 龚威, 等. 基于空谱特征优化选择的高光谱激光雷达地物分类[J]. 光学学报, 2023, 43(12): 1228008.
[18] 卢晓艺, 云挺, 薛联凤, 等. 基于树木激光点云的有效特征抽取与识别方法[J]. 中国激光, 2019, 46(5): 0510002.
[19] Wang X W, Cheng X, Li Z, et al. Lake water footprint identification from time-series ICESat/GLAS data[J]. IEEE Geoscience and Remote Sensing Letters, 2012, 9(3): 333-337.
[20] Wang X W, Gong P, Zhao Y Y, et al. Water-level changes in China's large lakes determined from ICESat/GLAS data[J]. Remote Sensing of Environment, 2013, 132: 131-144.
[21] Gong P, Li Z, Huang H B, et al. ICESat GLAS data for urban environment monitoring[J]. IEEE Transactions on Geoscience and Remote Sensing, 2011, 49(3): 1158-1172.
[22] Liu C X, Huang H B, Gong P, et al. Joint use of ICESat/GLAS and Landsat data in land cover classification: a case study in Henan Province, China[J]. IEEE Journal of Selected Topics in Applied Earth Observations and Remote Sensing, 2015, 8(2): 511-522.
[23] RansonK J, SunG, KovacsK, et al. Landcover attributes from ICESat GLAS data in Central Siberia[C]∥IGARSS 2004.2004 IEEE International Geoscience and Remote Sensing Symposium, September 20-24, 2004, Anchorage, AK, USA. New York: IEEE Press, 2004: 753-756.
[24] 周梦维, 柳钦火, 刘强, 等. 全波形激光雷达和航空影像联合的地物分类[J]. 遥感技术与应用, 2010, 25(6): 821-827.
Zhou M W, Liu Q H, Liu Q, et al. A method for classification by fusing full-waveform airborne laser scanning data and aerial images[J]. Remote Sensing Technology and Application, 2010, 25(6): 821-827.
[25] 张爱武, 董喆, 康孝岩. 基于XGBoost的机载激光雷达与高光谱影像结合的特征选择算法[J]. 中国激光, 2019, 46(4): 0404003.
[26] 王小龙, 闫浩文, 周亮, 等. 利用SVM分类Landsat影像的朝鲜主要城市建设用地时空特征分析[J]. 国土资源遥感, 2020, 32(4): 163-171.
Wang X L, Yan H W, Zhou L, et al. Using SVM classify Landsat image to analyze the spatial and temporal characteristics of main urban expansion analysis in Democratic People's Republic of Korea[J]. Remote Sensing for Land & Resources, 2020, 32(4): 163-171.
[27] 刘立新, 何迪, 李梦珠, 等. 基于高光谱技术与机器学习的新疆红枣品种鉴别[J]. 中国激光, 2020, 47(11): 1111002.
[28] 胡海瑛, 惠振阳, 李娜. 基于多基元特征向量融合的机载LiDAR点云分类[J]. 中国激光, 2020, 47(8): 0810002.
[29] 张爱武, 董喆, 康孝岩. 基于XGBoost的机载激光雷达与高光谱影像结合的特征选择算法[J]. 中国激光, 2019, 46(4): 0404003.
Article Outline
黄兴, 胡旭嫣, 刘微微, 赵宏. 基于星载激光雷达与多光谱影像结合的土地覆盖分类方法[J]. 中国激光, 2024, 51(8): 0810004. Xing Huang, Xuyan Hu, Weiwei Liu, Hong Zhao. Land Cover Classification Method Integrating Spaceborne LiDAR Combined with Multispectral Images[J]. Chinese Journal of Lasers, 2024, 51(8): 0810004.


