Bone mineral density value evaluation based on photoacoustic spectral analysis combined with deep learning method  Download: 881次
Osteoporosis[1] is a skeletal disease characterized by abnormal microarchitectural arrangement of bone tissue as well as a decrease in bone mass. It is responsible for increased bone fragility and consequent high incidence of low-trauma hip, spine, and other fractures[2]. The fracture risk of patients with osteoporosis is up to 40% during their lifetime. From the perspective of patients, fractures may bring a lot of inconvenience to life and severe symptoms may even be life-threatening[3]. Moreover, viewed from a social standpoint, osteoporosis has already become an enormous public health problem, and the associated medical and socioeconomic costs have risen sharply[4] for the acceleration of the aging process and the arrival of the old-age society. Hence, timely diagnosis and effective treatment are of great significance to ease patients’ suffering and reduce relevant costs.
The diagnosis methods can be generally divided into two categories—radiography methods and ultrasound methods[5]. Dual X-ray absorptiometry (DXA) is currently the most widely used radiography technique to assess mineral content in specified sites or in the whole skeleton. It can derive value of bone mineral density (BMD), which is the worldwide accepted gold standard for clinical diagnosis of osteoporosis. However, it only explains 60%–80% of bone strength, while other factors that also play important roles in determining fracture risk are not taken into account, such as bone microarchitecture, bone turnover rate, micro-damage, and bone mineralization. In addition to DXA, quantitative computed tomography (QCT)[6] is also one representative radiography method that can be available for BMD measurement of cortical or cancellous bone discretely. Moreover, the value measured by this method is three-dimensional volumetric BMD, which improves the sensitivity and accuracy of the measurement result. In comparison with DXA, a higher radiation exposure and a more expensive expense make QCT not conducive to clinical application. Non-ionizing and non-invasive quantitative ultrasound (QUS) technology is a typical representative of the ultrasound method. In both cross-sectional and prospective researches[79" target="_self" style="display: inline;">–
Photoacoustic (PA) imaging, also known as thermo-acoustic imaging, is a hybrid imaging modality combining the advantage of both optics imaging and ultrasound imaging[10]. The attribute of high contrast derived from the sensitive absorption of optics in different tissues, the features of high spatial resolution, and great penetration depth are superiorities of ultrasound. It is proved that PA measurement possesses the unique capability of evaluating tissue microscopic architecture information at ultrasonic resolution, so its application field has rapidly been expanded to biomedicine[1113" target="_self" style="display: inline;">–
The relationship between the PA spectrum and corresponding BMD value is nonlinear, complicated, and difficult to be modeled or to be denoted by a mathematical expression precisely. The deep learning method provides one solution to fit the complex mapping relationship between network input and output with a high accuracy by offering sophisticated nonlinear models. Therefore, the neural network was introduced to this study. Specifically, the fitting process can be divided into three parts: neural network construction, network training, and network testing. In the network construction stage, both the layer number and layer node number can be customized by specific needs. In the process of training, the PA spectra and corresponding BMD values in training set were fed into the network as input and output, respectively. Then, the deep network continuously renewed the weights and bias in each layer through iteration to minimize the error between network output and the ground truth of BMD values until it achieved the presupposed precision. In the testing process, by comparing the predicted BMD values of the PA spectra in the test set with actual ones, the network performance could be evaluated, and the feasibility of the proposed method could be judged. In this study, we chose relative error as the performance evaluation index.
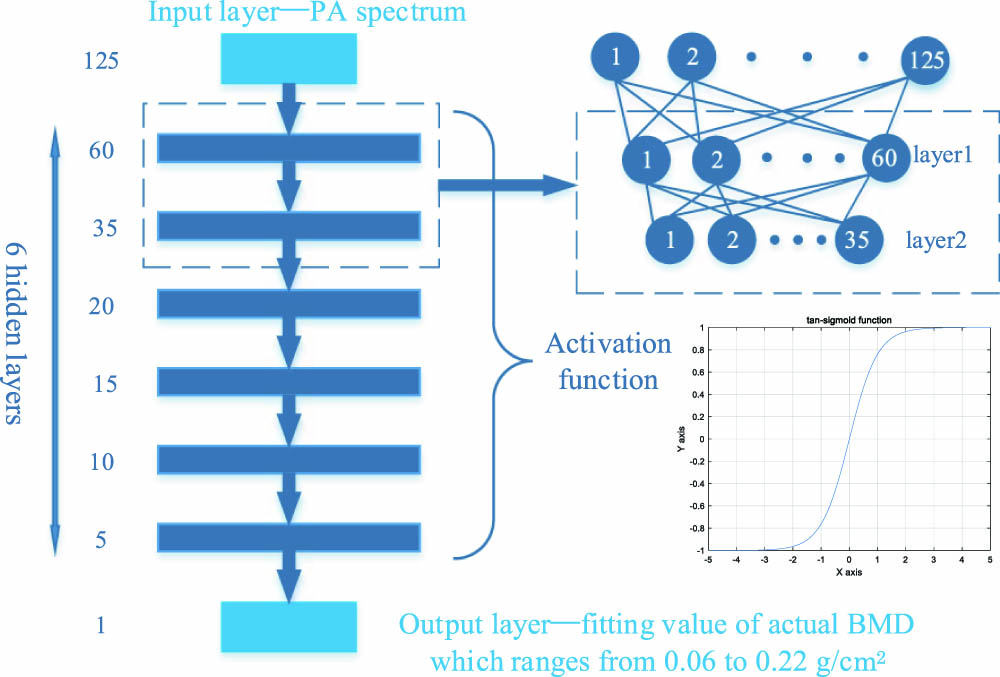
The N-layer network contains N−1 hidden layers and one output layer, where the output of each node in the previous layer acts as input of the next layer. What we processed was a one-dimensional signal of length 125, so a whole conjunction neural network, which meant that neighboring layers were fully connected by weighting values instead of a convolutional neural network, was adopted in this study.
Each layer node except the ones in the input layer mapped the sum of linear transformation to one output through the selected activation function. In our study, tan-sigmoid and purlin were chosen as the activation functions in the hidden layers and output layer, respectively.
To validate the idea that PA signals can contribute to the realization of semi-quantitative evaluation of osteoporosis, we performed ex-vivo experiments on swine femur heads. As shown in the diagram of the experimental system (Fig.

Fig. 1. (a) Schematic diagram of the experimental setup. (b) The image of actual experimental installation.
We prepared 30 swine specimen slices and collected two signals per slice; each of the signals was acquired by the laser’s irradiation to one or the other side of the specimen. The corresponding BMD values were obtained by DXA. After the first round of signal acquisition, the 30 swine slices were soaked in an ethylene diamine tetraacetic acid (EDTA) solution (0.5 mol/L) for 24 h to imitate the process of bone loss (Fig.

Fig. 2. Step of soaking swine slices into EDTA solution to imitate the process of bone loss.
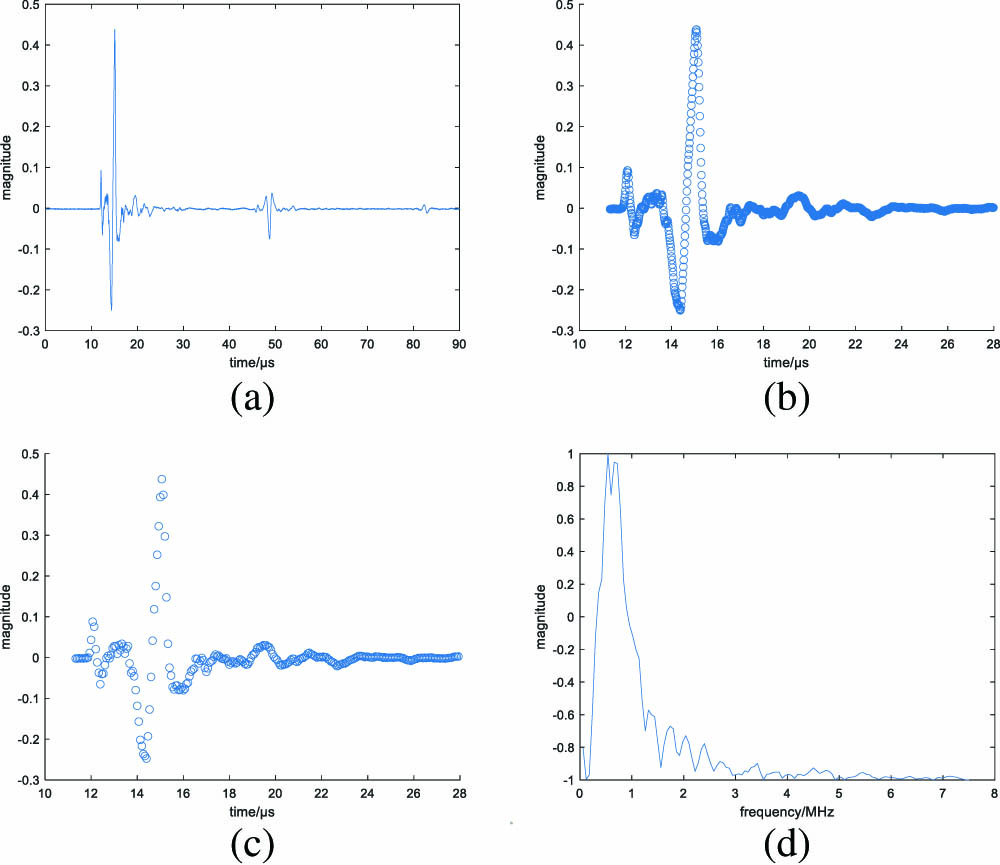
After eliminating the low signal-to-noise ratio (SNR) ones, the eventual number of PA signals used for building data sets became 99; 87 of them were for the training set, and the remaining 12 were for the test set. Through careful observation and analysis of the time domain graph of PA signals, we found there existed a redundant component. After calculating the start and end points of the actual desired part according to the distances between the transducer and specimen, the thickness of the specimen, and the sound speed in the specimen, we cut the raw PA signals into a length of 1000. Considering that the maximum frequency of the PA signal is around 7 MHz, the sampling rate of 15 MHz is adequate, so we sampled each signal into four signals with a length of 250. This step was equivalent to converting the sampling rate from 60 MHz to 15 MHz and could function as the signal length reduction and data augmentation at the same time. As a result, 348 samples for the training set and 48 samples for the test set were obtained. Besides, for signals in the training set, we went on doing augmentation by adding Gaussian noise twice so that each signal obtained another two signals, and the samples for training were 1044 in total. Training of a network was essentially a procedure to adjust the parameters in it so as to make our model convergent. Considering the huge scale of network parameters, a proportional amount of samples were demanded. In order to make the network get the best performance, data augmentation was taken on the original dataset.
By means of Fourier transform, we got the signals in the frequency domain and went further to cut the length from 250 to 125 for signal spectrum symmetry. Moreover, the decrease in signal length is of benefit to the subsequent network training.
The nodes in the input and output layers were decided once the data sets were determined and were 125 and 1, respectively, in our study. The vital factors that had an effect on the performance of the neural network were the number of hidden layers and nodes in each hidden layer. The network could not possess the necessary capacity to learn and process information if the network depth (depending on the number of layers) or the number of nodes in each hidden layer was too small. Conversely, too large number would not only greatly increase the complexity of the network structure that may make the learning speed slower, but also make the network be more prone to causing problems such as gradient vanishing and overfitting. Eventually, a fully connected seven-layer network was selected as the optimal one through a preliminary experiment, and its specific structure is shown in Fig.

Fig. 3. Specific structure of adopted fully connected seven-layer network, and the details of layer 1 and layer 2 are presented in the right as an example.

Fig. 4. Each diagram corresponds to one stage of signal processing. (a) The raw time domain PA signal. (b) Truncated time domain PA signal. (c) Time domain PA signal of further sampling in (b); it retains the information of (b) but has a larger interval between adjacent points (scatter diagrams are utilized to discriminate them). (d) The result of (c) after Fourier transform as an example illustration of the eventual normalized input of the network.
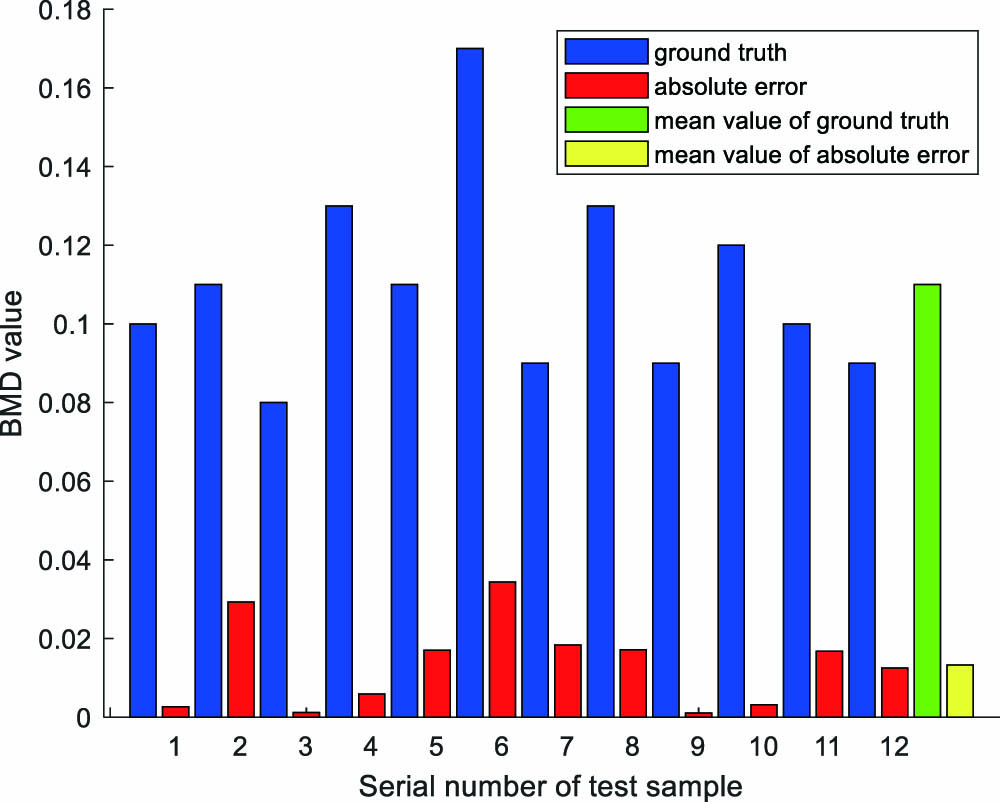
The BMD values measured by DXA were distributed in a range from

Fig. 5. Diagram of actual BMD value and its corresponding absolute error compared with the network fitting one.
In this research, we verified the feasibility of utilizing a multi-layer neural network to fit BMD values based on the PA spectra. Compared with PASA method, which can only reveal a variation trend of bone loss, our method can realize semi-quantitative diagnosis for varying degrees of osteoporosis. Raw PA signals were collected by experiments conducted on swine femur heads. After various processing, the obtained PA spectra were input into a fully connected deep neural network to continuously update the parameters until the network was stably convergent. The eventual fitting results were satisfying, and our method’s potential application value in clinical screening was proved by professional doctors. In our further study, a large data set that includes more samples of each individual BMD value and covers a larger range of BMD values will be built to improve the prediction accuracy and comprehensiveness.
[1]
[2]
[3]
[4]
[5]
[6]
[7]
[8]
[9]
[10]
[11]
[12]
[13]
[14]
[15]
[16]
[17]
Xue Zhou, Zhibin Jin, Ting Feng, Qian Cheng, Xueding Wang, Yao Ding, Hongchen Zhan, Jie Yuan. Bone mineral density value evaluation based on photoacoustic spectral analysis combined with deep learning method[J]. Chinese Optics Letters, 2020, 18(4): 041701.


