激光与光电子学进展, 2023, 60 (11): 1106012, 网络出版: 2023-06-07
超分辨荧光显微成像的若干研究进展  下载: 650次特邀综述
Research Progress of Super-Resolution Fluorescence Microscopy
图 & 表
图 1. 超分辨荧光显微技术的主要发展历史[10]
Fig. 1. Development of super-resolution photoluminescence imaging techniques[10]
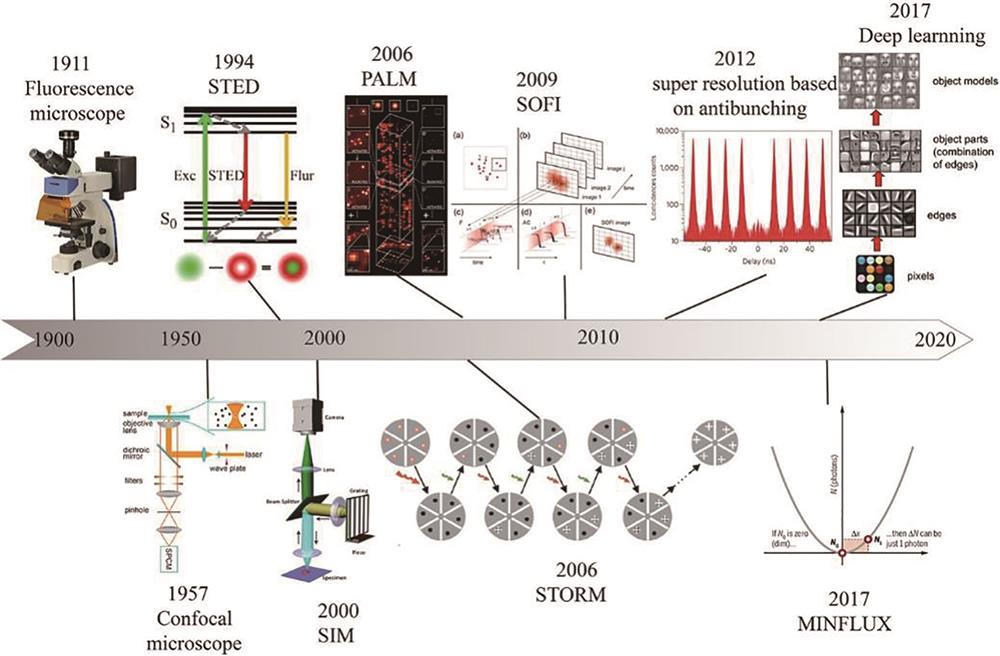
图 2. 最低光子数显微成像技术的原理及装置示意图。(a)(b)常规纳米显微技术和最低光子数显微成像技术定位荧光分子中心的原理示意图[17];(c)实现最低光子数超分辨显微成像的实验装置示意图[18];(d)~(f)一维、二维、三维最低光子数显微成像技术的定位原理示意图[16,18];(g)相同光子数下,单分子定位显微成像与最低光子数显微成像分辨率的对比效果(比例尺:10 nm)[16]
Fig. 2. Schematic diagrams of the principle and experimental setup of MINFLUX. (a) (b) Schematic diagrams of the principle to localize the center of fluorescent molecules for common nanoscopy and MINFLUX, respectively[17]; (c) schematic diagram of the setup of MINFLUX[18]; (d)-(f) principles of MINFLUX illustrated in one, two, and three dimensions, respectively[16,18]; (g) comparison of the spatial resolution between SMLM and MINFLUX under same photon counts (scale is 10 nm)[16]
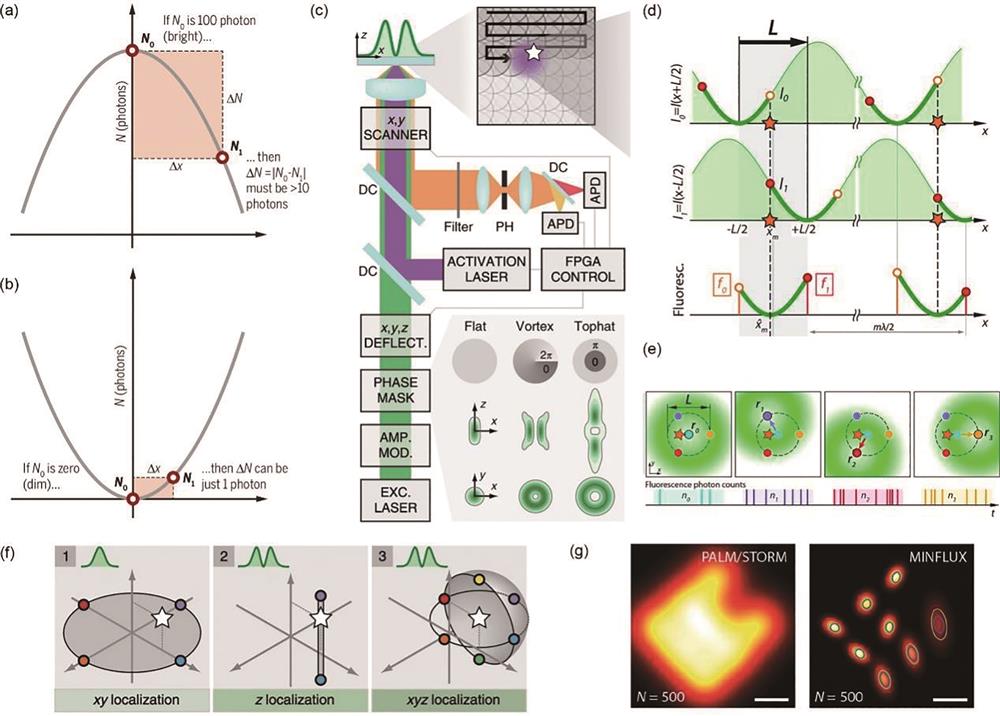
图 3. 最低光子数显微成像在分辨率、三维多色成像方面的优化与改进。(a)用AF647和CF680染色后的U-2 OS细胞的双色三维最低光子数显微成像(比例尺:500 nm)[19];(b)双色最低光子数显微成像技术在三维空间的定位精度[20];(c)脉冲交错式最低光子数显微成像的实验装置图[21];(d)(e)基于脉冲交错式最低光子数显微成像技术获得的光子数分布及其寿命分布[21];(f)(g)基于光栅扫描单分子定位的测量方法以及该方法在不同扫描距离下的成像模拟结果[23]
Fig. 3. Development in terms of resolution and 3D multicolor imaging of MINFLUX. (a) Two-color MINFLUX nanoscopy in 3D of U-2 OS cell with AF647 and CF680(scale: 500 nm)[19]; (b) three-dimensional localization accuracy of MINFLUX[20]; (c) schematic of the p-MINFLUX setup[21]; (d)(e) 2D localization image and fluorescence lifetime image for one DNA origami structure through p-MINFLUX[21]; (f)(g) measurement method based on grating scanning single molecule localization and imaging simulation results of this method at different scanning distances[23]
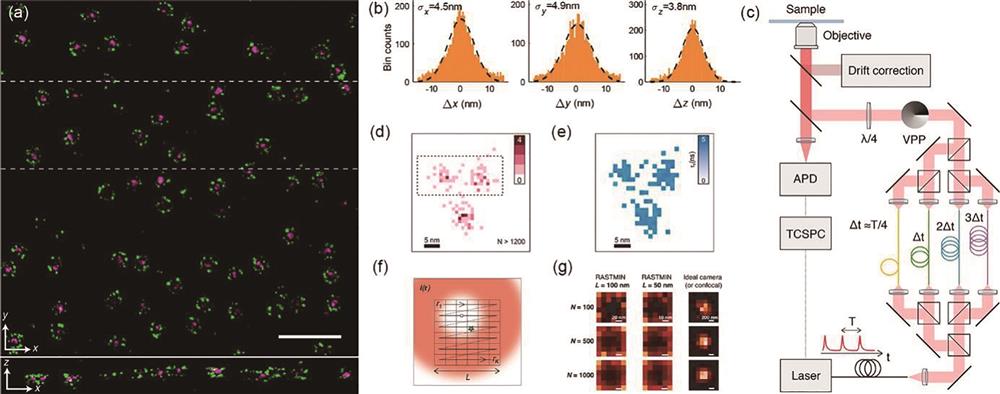
图 4. 最低光子数显微成像与其他显微成像技术相结合的成像效果。(a)(b)通过模拟获得的最低光子数显微成像的z轴定位效果,其中图a为单光子激发,图b为双光子激发,(比例尺:1 nm)[25];(c)图像扫描最低光子数显微成像的原理示意图,利用阵列探测器代替点探测器来扩大成像视野[27];(d)(e)单分子定位显微技术与结构光照明最低光子数显微技术对相同发色团进行成像的效果比较(比例尺:50 nm)[28];(f)共聚焦显微技术、(g)受激辐射损耗显微技术以及(h)最小光子数受激辐射损耗技术对相似线粒体进行成像的效果对比(比例尺:200 nm)[29];(i)利用Vimentin-reEGFP2荧光蛋白实现的共聚焦荧光成像(左图)与利用DNA-PAINT技术获得的最低光子数显微成像效果的对比(比例尺:200 nm)[31]
Fig. 4. Super-resolution imaging by combining the MINFLUX with other techniques. Simulation of z-axis localization for (a) single-photon MINFLUX and (b) two-photon MINFLUX, respectively(scale: 1 nm)[25];(c) concept of ISM-FLUX, an activation laser beam activates a single fluorophore in the sample (yellow star) which is sequentially excited by a series of spatially displaced doughnut beams[27]; (d) SMLM and (e) SIMFLUX image for the same nano-rulers(scale: 50 nm)[28]; (f) comparison of imaging effects of confocal microscopy, (g) stimulated radiation loss microscopy, and (h) minimum photon number stimulated radiation loss technique on similar mitochondria (scale: 200 nm)[29]; (i) comparison of confocal fluorescence imaging using Vimentin-reEGFP2 fluorescent protein (left image) and minimum photon number microscopy imaging using DNA-PAINT technology (scale: 200 nm)[31]
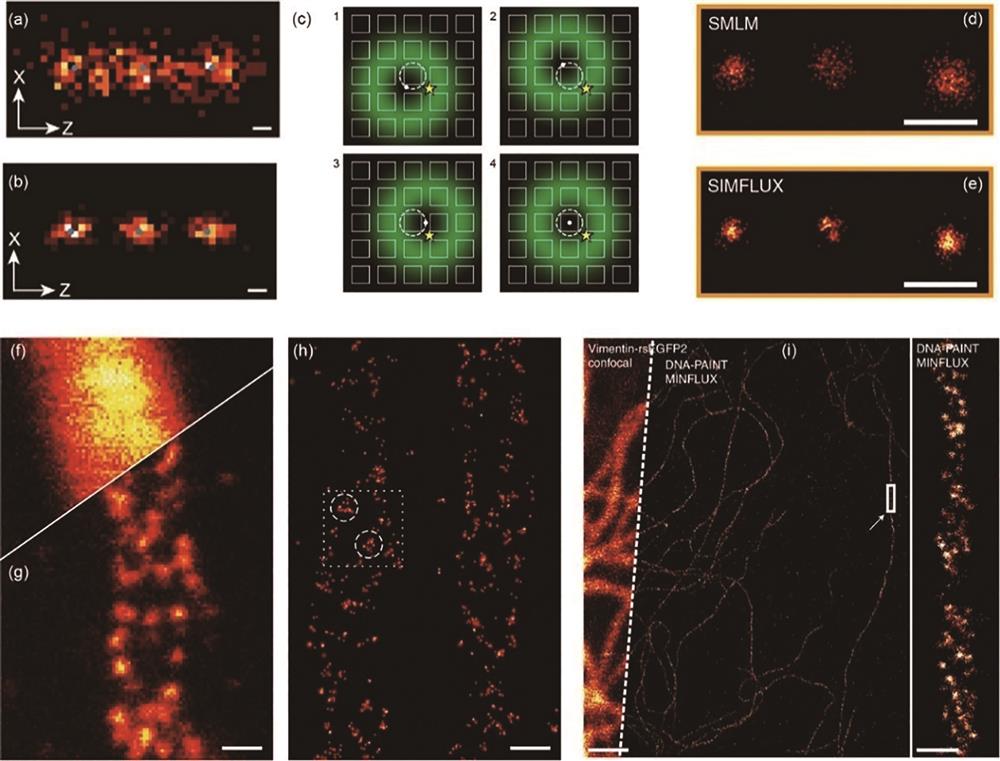
图 5. 宽场成像、最低光子数显微成像技术及其与其他超分辨方法结合技术在视场、光子效率、信背比、系统简易性及分辨能力等方面的对比
Fig. 5. Comparison of wide field imaging, minimum photon number microscopic imaging technology, and their combination with other super-resolution methods in field of view, photon efficiency, signal to back ratio, system simplicity, and resolution ability
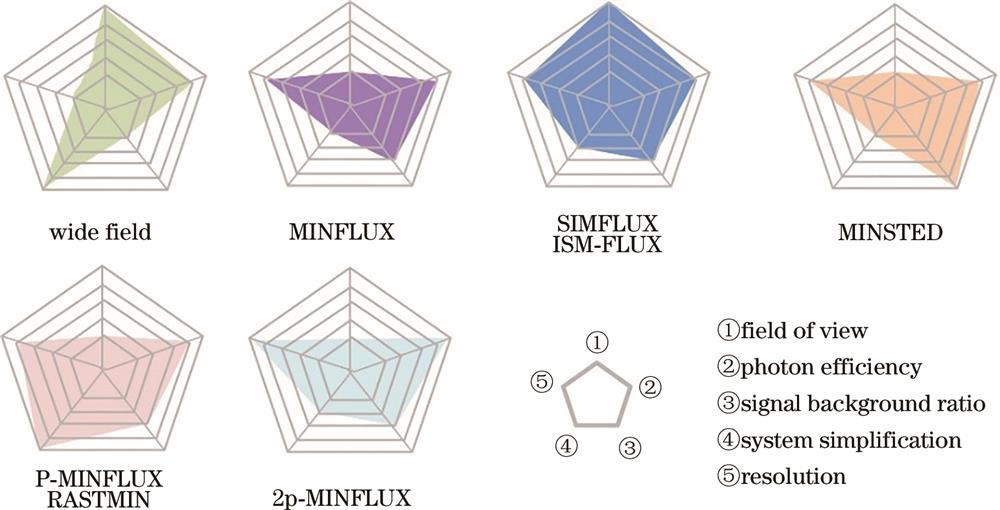
图 6. 波动超分辨荧光成像的原理示意图[32]。(a)像平面中发射器的空间分布;(b)图(a)中虚线框的放大细节;(c)每个像素的时间轨迹;(d)根据信号波动计算的每个像素的二阶相关函数;(e)每个像素二阶相关函数积分结果
Fig. 6. Principle of SOFI[32]. (a) Emitter distribution in the object plane; (b) magnified detail of the dotted box in Fig. (a); (c) time trajectory of each pixel; (d) second-order correlation function is calculated from the fluctuations for each pixel; (e) result of integrating the second-order correlation function per pixel
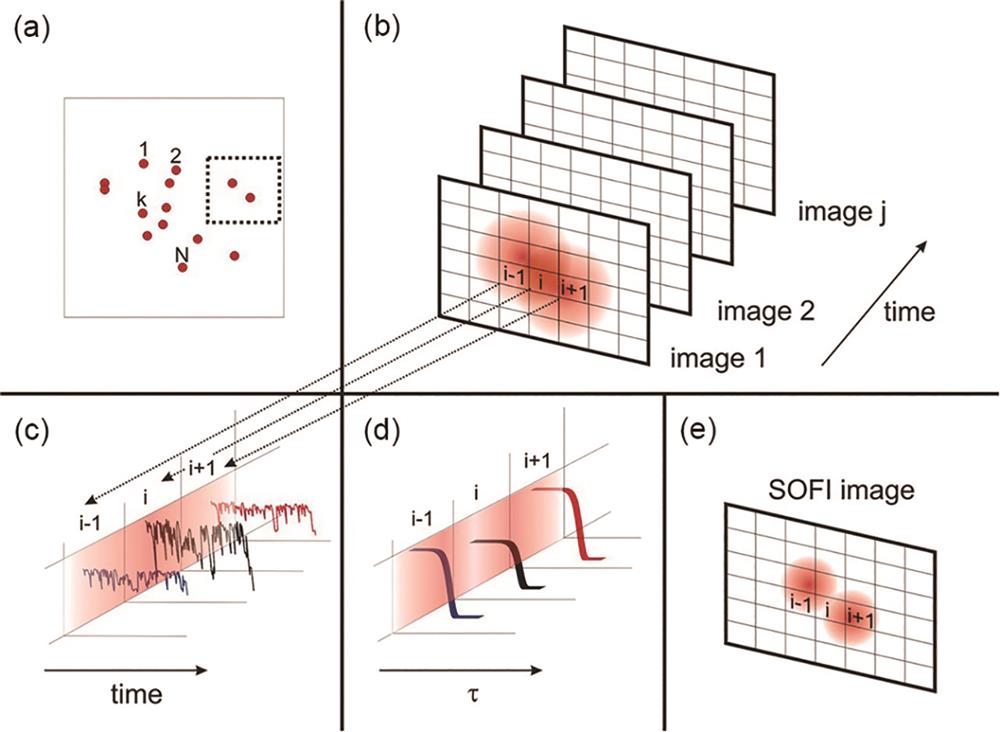
图 7. 不同荧光标记物的波动超分辨成像图。(a)联合标记波动超分辨显微成像示意图[37];(b)超分辨波动光学成像的横截面示意图[37];(c)多色波动超分辨显微成像的光谱交叉累积分析,以及线性分解模拟的工作流程[38];(d)(e)用Lyn-Dronpa(绿色)和Kras-rs TagRFP(红色)标记的HeLa细胞共聚焦荧光成像和光致变色波动超分辨成像图[41](比例尺:10 μm)
Fig. 7. SOFI images with different fluorescent labels. (a) Schematic diagram of joint labeled wave super-resolution microscopy imaging[37]; (b) schematic cross-section of the joint-tagging SOFI imaging[37]; (c) workflow of multicolor SOFI imaging by spectral cross-cumulant analysis followed by linear unmixing using simulations[38]; (d) conventional and (e) pcSOFI image of HeLa cell labeled with Lyn-Dronpa (green) and Kras-rsTagRFP (red), respectively[41] (scale: 10 μm)
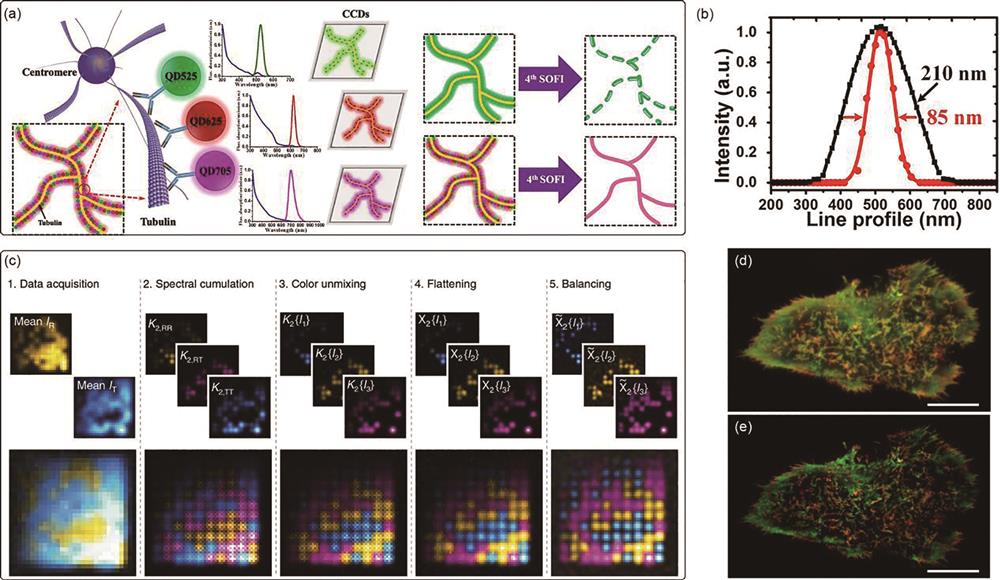
图 8. 解决高阶波动超分辨成像伪影的算法流程图。(a)局部动态范围压缩算法流程图[44];(b)平衡波动超分辨荧光成像算法流程图[45]
Fig. 8. Flowchart of algorithm to solve artifacts in the high-order SOFI. (a) Flowchart of local dynamic range compression algorithm[44]; (b) flowchart to illustrate the different steps of the bSOFI algorithm[45]
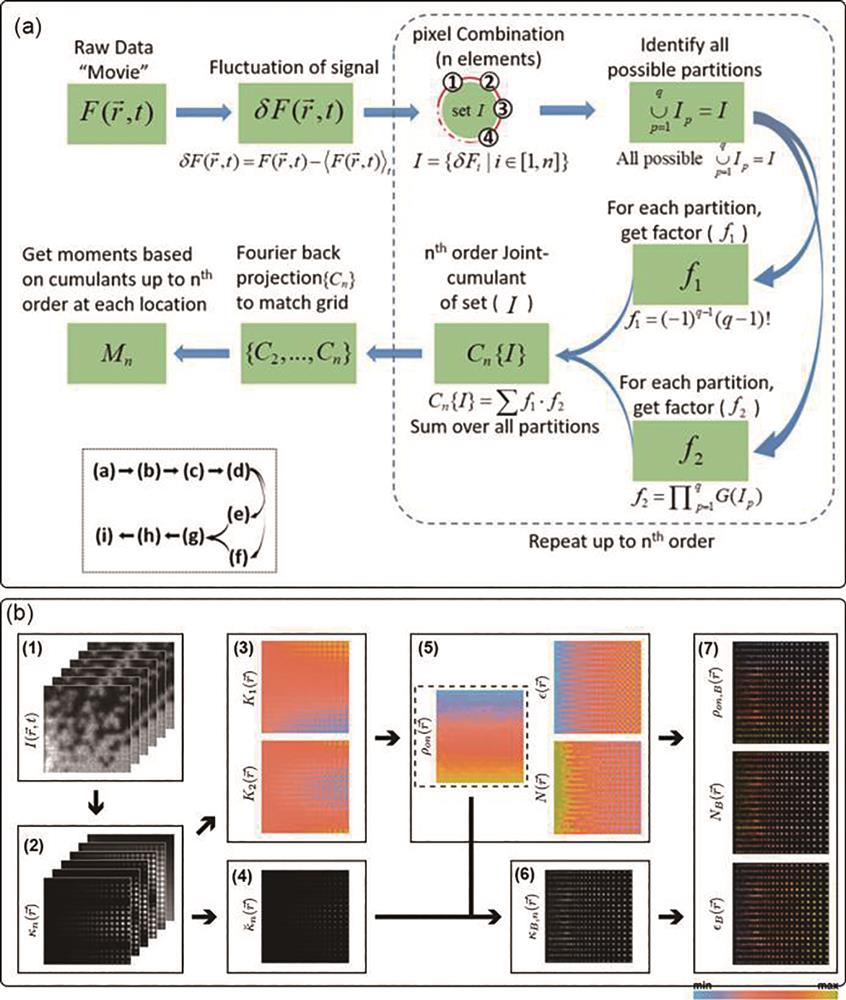
图 9. 波动超分辨成像数据分析的流程图以及波动超分辨成像技术与其他成像技术的对比。(a)超分辨定位器或者超分辨波动显微成像数据分析的一般流程[46];(b)单个发色团的空间分布以及这些发色团的宽场成像、平衡超分辨波动显微成像和随机光学重构超分辨成像的比较[48];(c)商业量子点QD625的共聚焦荧光显微成像、图像扫描显微成像,以及2阶和4阶超分辨光学波动图像扫描显微成像的对比[51]
Fig. 9. Flowchart of the analysis of SOFI data and the contrast between SOFI and other imaging techniques. (a) Schematic overview of a super-resolution localization or SOFI analysis[46]; (b) comparison of the spatial distribution of individual chromophores and their wide field imaging, balanced super-resolution wave microscopy imaging, and random optical reconstruction super-resolution imaging[48]; (c) comparison of confocal fluorescence microscopy, image scanning microscopy, and second-order and fourth-order super-resolution optical wave image scanning microscopy for commercial quantum dot QD625[51]
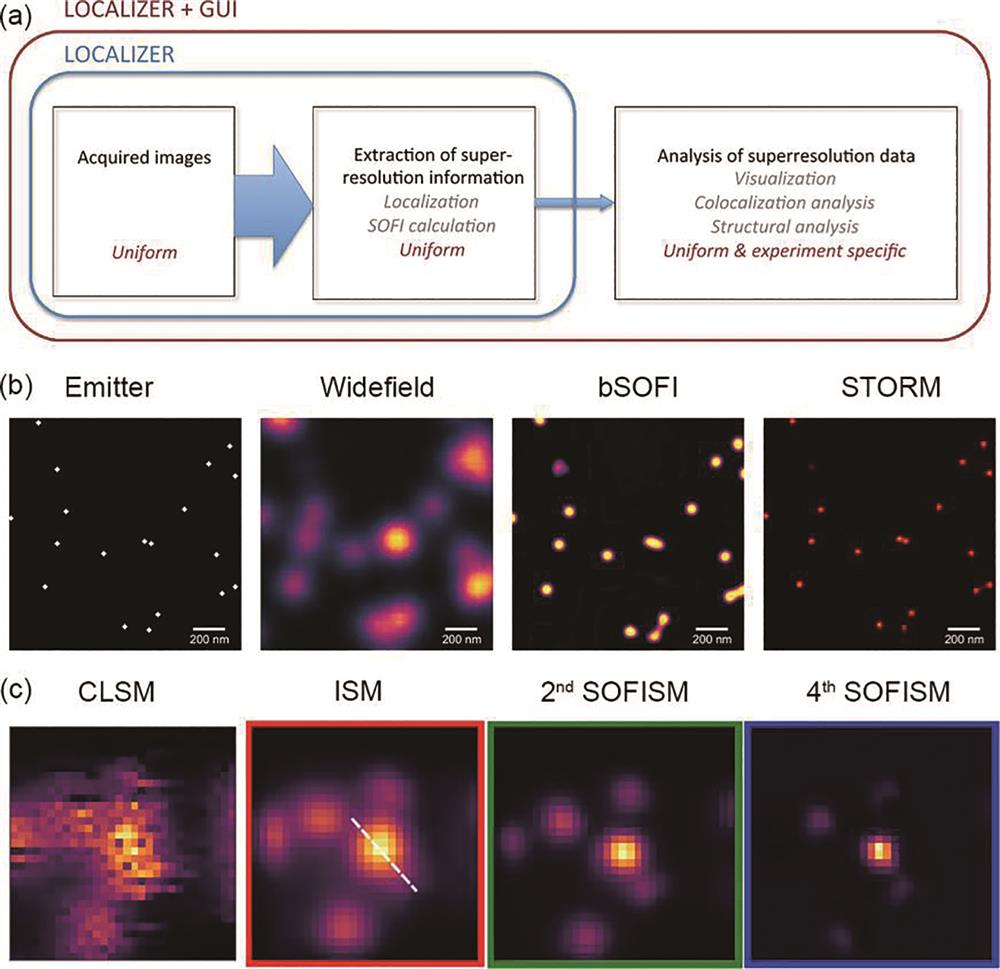
图 10. 反聚束超分辨荧光成像的基本原理。(a)HBT测量的原理示意图[61];(b)连续光激发下单个荧光发色团发射光子的反聚束现象[62];(c)~(e)同一区域量子点的一阶、二阶和三阶反聚束荧光图像[64]
Fig. 10. Principle of super-resolution image based on anti-bunching effect. (a) Schematic diagram of the HBT measurement[61]; (b) anti-bunching signal of single molecule excited by continuous laser[62]; (c)-(e) first order, second order, and third order anti-bunching images of quantum dots in the same region[64]
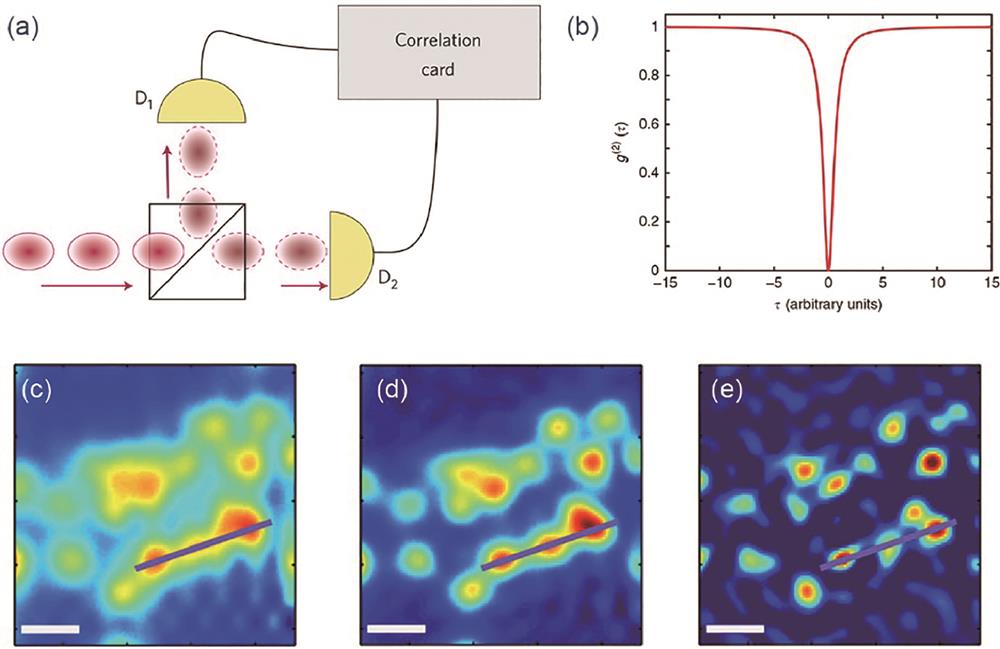
图 11. 反聚束超分辨荧光成像的效果。(a)在共聚焦系统中测量2阶反聚束实现超分辨成像的装置示意图[65];(b)基于图(a)系统采集获得的NV色心的单双光子信号重建图像[65];(c)用单光子光纤束相机测量高阶反聚束实现超分辨成像装置示意图[67];(d)图(c)系统测量单个量子点的二维实验定位精度(实线)及理论预测精度(虚线)[67];(e)基于结构光照明成像与纠缠显微镜实现结构光照明的量子关联显微成像的原理示意图[68];(f)结构光照明的量子关联的显微成像结果,其中CM2指2阶关联显微成像[68];(g)(h)在共聚焦显微系统和量子图像扫描显微系统中QD625量子点标记的微管细胞样本成像结果[69]
Fig. 11. Imaging results of super-resolution image based on anti-bunching effect. (a) Schematic diagram of a super-resolution imaging device for measuring second-order anti-bunching in a confocal system[65]; (b) reconstructed image according to the single and double photon signals of NVs collected from the system in a[65]; (c) schematic diagram of a super-resolution imaging device for measuring high-order anti-bunching with a single-photon fiber beam camera[67]; (d) two-dimensional localization accuracy measured for a single QD (solid blue) and theoretical accuracy by using the system in c[67]; (e) schematic of SIQCM by combining SIM and quantum correlation microscopy[68]; (f) simulation results illustrated the resolution of SIQCM[68]; (g) (h) imaging results of QD625-labeled microtubule cell samples in confocal microscopy and Q-ISM[69]
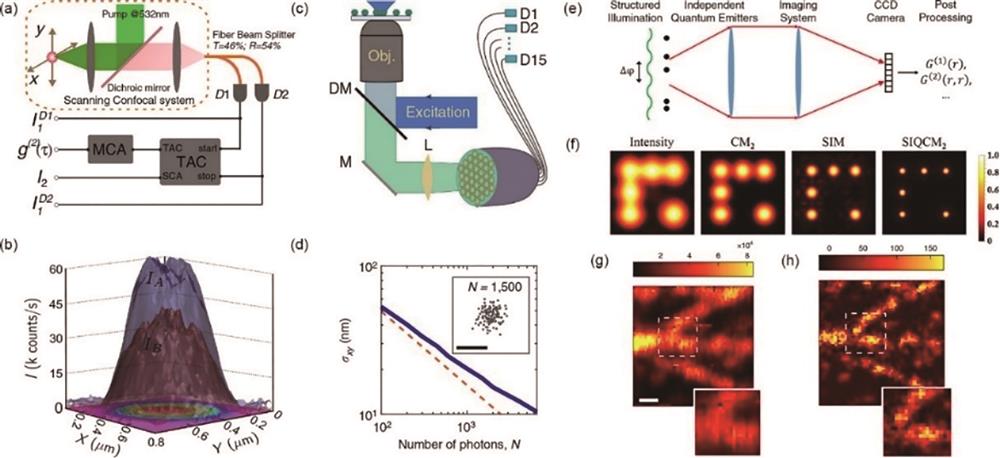
图 12. 神经网络架构发展。(a)人工智能的分类[72];(b)卷积神经网络的基本架构,包括一个输入层、多个交替卷积层和最大池化层、一个全连接层和一个分类层[72];(c)生成对抗网络的基本架构[75];(d)U-Net网络的基本架构[76]
Fig. 12. Development of neural network architecture. (a) Taxonomy of AI[72]; (b) overall architecture of the CNN includes an input layer, multiple alternating convolution, and max-pooling layers, one fully-connected layer, and one classification layer[72]; (c) GAN model frame diagram[75]; (d) U-net architecture[76]
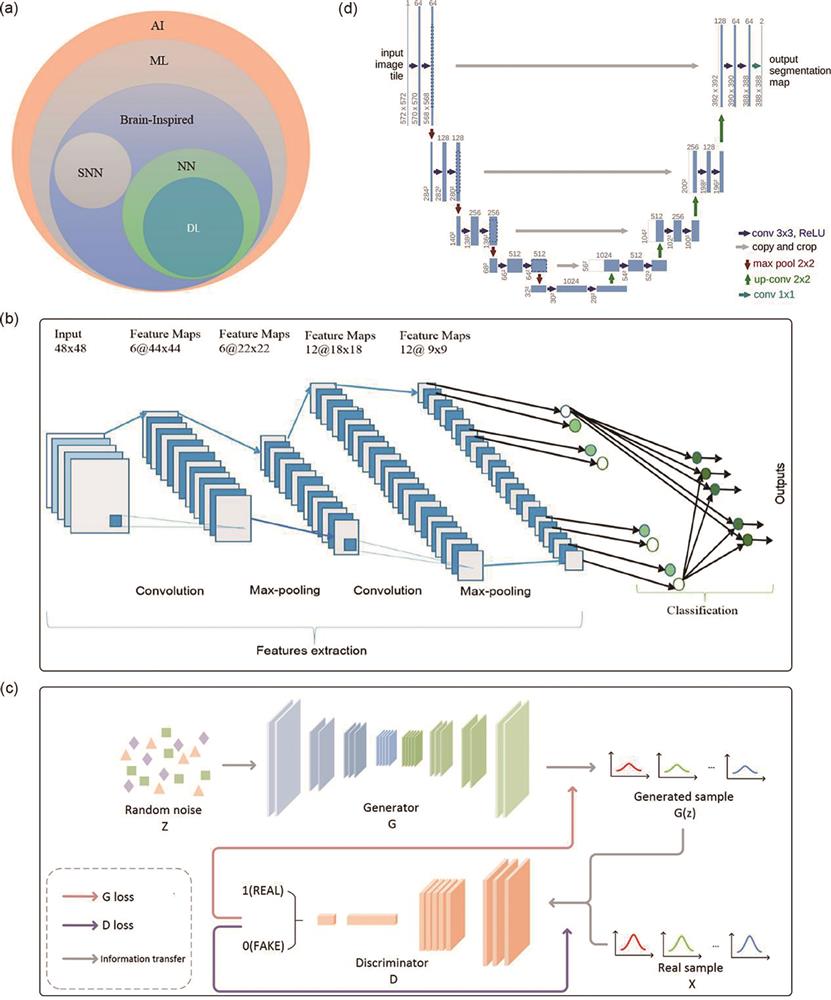
图 13. 基于深度学习荧光超分辨显微成像的最新进展。(a)通过深度学习对牛肺动脉内皮细胞宽场图像的重建结果[78];(b)基于深度学习的全内反射荧光显微效果,及其与基于全内反射的结构光超分辨显微成像的对比,所用细胞是SUM159[78];(c)利用生成对抗网络提高成像分辨率的效果[79];(d)基于无监督的内容保留变换显微成像可将宽场图像转换为超分辨图像,从而能够从宽场图像中分辨亚衍射结构,如微管和分泌颗粒[80];(e)对121组肌动蛋白图像分别使用scU-net、DFCAN和DFGAN网络重建后在归一化均方根误差、多尺度结构相似性指数和分辨率的统计比较,其中黑色的十字为异常值[82]
Fig. 13. Latest progress in fluorescence super-resolution microscopy imaging based on deep learning. (a) Reconstruction results of wide-field images of bovine pulmonary artery endothelial cells through deep learning[78]; (b) total internal reflection fluorescence microscopic effect based on depth learning, and its comparison with structured light super-resolution microscopic imaging based on total internal reflection, the cell used is SUM159[78]; (c) resolution characterization of GAN net [79]; (d) based on unsupervised content retention transformation, microscopic imaging can convert wide-field images into super-resolution images, enabling the resolution of sub diffractive structures such as microtubules and secretory particles from the wide-field images[80]; (e) statistical comparison of normalized root mean square error, multi-scale structure similarity index, and resolution of 121 groups of actin images reconstructed by scU-net, DFCAN, and DFGAN networks respectively, black cross is the outlier[82]
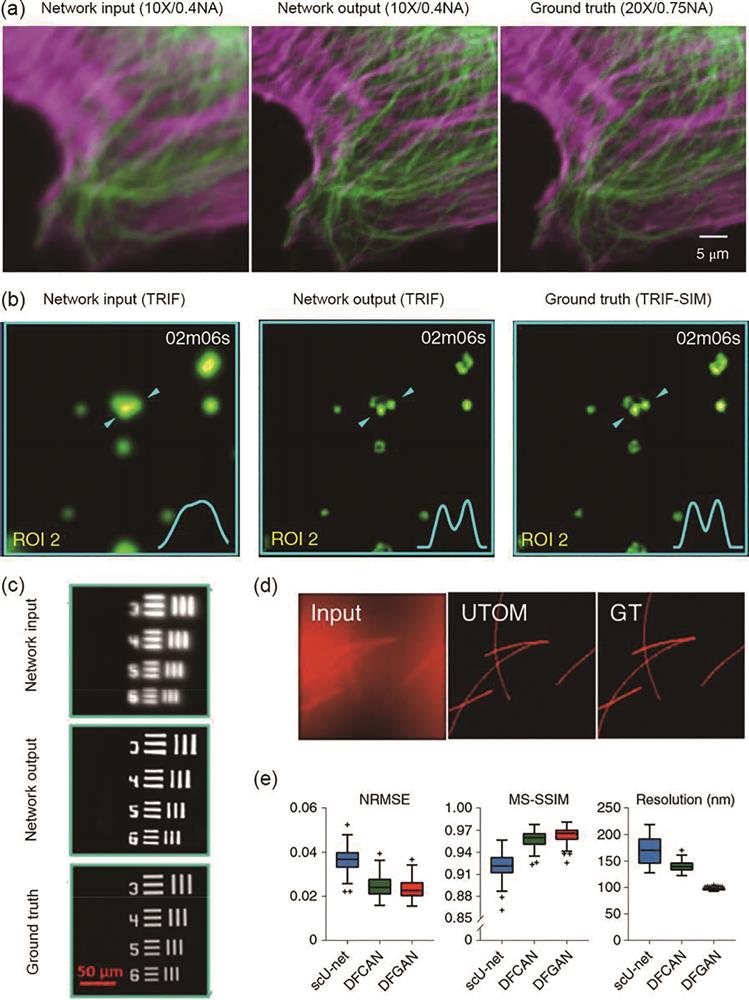
图 14. 使用深度学习方法将线数据集中的图像从1d_SIM转换为9_SIM[83]。(a)宽场图像;(b)1d_SIM图像为网络输入;(c)3_SIM图像为网络输出;(d)9_SIM图像为真实图像。基于U-Net网络对微管成像的重构效果[81]。(e)15个SIM原始数据图像的平均投影;(f)传统结构光照明显微成像的重建算法的重建结果;(g)U-Net-SIM15网络的输出效果;(h)U-Net-SIM3网络的输出效果。ANNA-PALM重建免疫染色微管显微图像的结果对比[85]。(i)宽场图像;(j)从采集的前9 s获得的稀疏PALM图像(k=300 frame,n=11740个定位);(k)通过15 min的采集获得的密集PALM图像(K=30000 frame,N=409364个定位);(l)仅从宽场图像(i)重建的结果;(m)仅从稀疏的PALM图(j)重建的结果;(n)从宽场图(i)和稀疏PALM图(j)的组合中重建的结果(比例尺:1 μm)。COS-7细胞的双色sSMLM图像[86]。(o)3000 frame的低密度图像;(p)深度卷积神经网络的重建结果;(q)19997 frame的高密度图像(像素大小为16 nm,比例尺为1.5 μm)
Fig. 14. Deep learning-enabled transformation of images of curves from 1d_SIM to 9_SIM[83]. (a) WF curve image; (b) 1d_SIM image is network input; (c) 3_SIM image is network output; (d) 9_SIM image is real images. Reconstruction effect of microtubule imaging based on U-Net network[81]. (e) Average projection of 15 SIM raw data images; (f) reconstruction results of reconstruction algorithm of traditional structured light illumination microscopic imaging; (g) output effect of U-Net-SIM15 network; (h) output effect of U-Net-SIM3 network. Comparison of results of ANNA-PALM reconstruction of immunostaining microtubule microscopy images[85]. (i) Widefield image; (j) sparse PALM image obtained from the first 9 s of acquisition (k=300 frame, n=11740 localizations); (k) dense PALM image obtained from a 15 min-long acquisition (K=30000 frame, N=409364 localizations); (l) ANNA-PALM reconstruction from the widefield Fig. (i) only; (m) ANNA-PALM reconstruction from the sparse PALM Fig. (j) only; (n) ANNA-PALM reconstruction from the widefield Fig. (i) and sparse PALM Fig. (j) combined (scale: 1 µm). Two-color sSMLM images in COS-7 cell[86]. (o) Low-density image with 3000 frame; (p) deep CNN reconstruction; (q) high-density image with 19997 frame (pixel size:16 nm. scale: 1.5 µm)
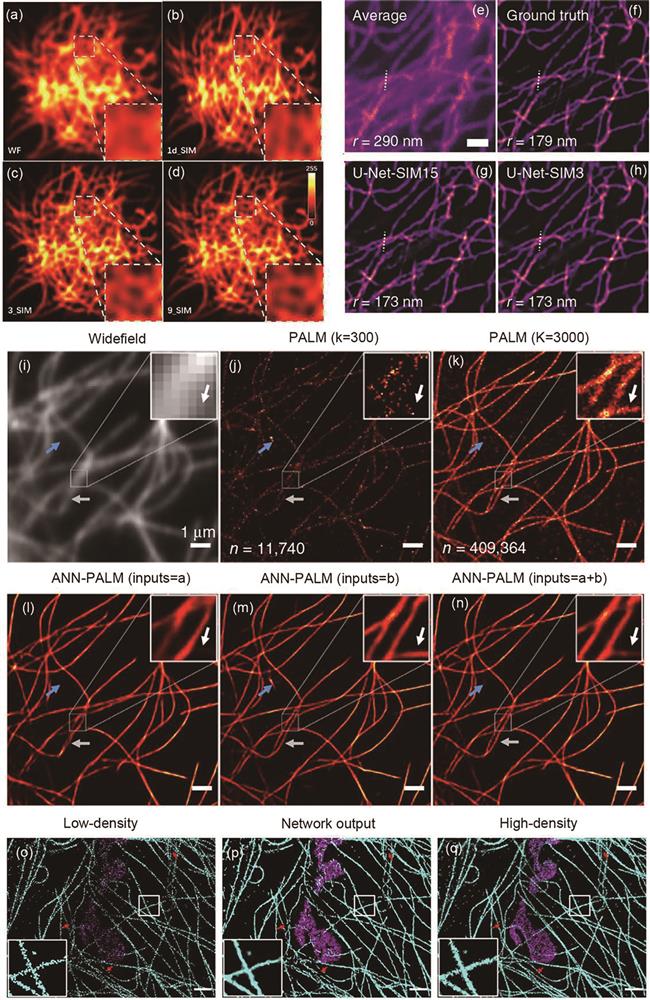
表 1深度学习超分辨率成像的参数
Table1. Parameters of the deep-learning super-resolution imaging
|
卫奥尼, 秦成兵, 董帅, 孟新钦, 宋蕴睿, 李向东, 梁喜龙, 张国峰, 陈瑞云, 胡建勇, 杨志春, 霍建忠, 肖连团, 贾锁堂. 超分辨荧光显微成像的若干研究进展[J]. 激光与光电子学进展, 2023, 60(11): 1106012. Aoni Wei, Chengbing Qin, Shuai Dong, Xinqin Meng, Yunrui Song, Xiangdong Li, Xilong Liang, Guofeng Zhang, Ruiyun Chen, Jianyong Hu, Zhichun Yang, Jianzhong Huo, Liantuan Xiao, Suotang Jia. Research Progress of Super-Resolution Fluorescence Microscopy[J]. Laser & Optoelectronics Progress, 2023, 60(11): 1106012.


 PDF全文
PDF全文

