内窥环境下多光谱血氧饱和度检测
Hypoxemia is a common clinical phenomenon that is closely associated with various pathological changes caused by a decrease in oxygen saturation to different degrees. We aim to develop a low-cost blood oxygen saturation detection technology that can be adapted to a wider range of endoscopes for clinical practice and patient diagnosis and treatment. By expanding the application scenarios of endoscopic blood oxygen detection and enriching its practical application value, we hope to help popularize the application of endoscopic technology in remote and resource-scarce areas and improve the coverage and quality of medical services.
We initially employ the Monte Carlo simulation technique to model and simulate multi-spectral imaging of blood vessel tissue in the visible light range. The absolute value, relative value, absolute difference, and contrast of the backscattering power of blood at different levels of oxygen saturation are analyzed. In response to the complexity of multi-spectral blood oxygen saturation detection in an endoscopic environment, the analytic hierarchy process (AHP) is used to comprehensively analyze various factors that could potentially interfere with the results. By adopting a hierarchical analysis approach, the factors that could potentially interfere with blood oxygen detection are categorized into four major groups: controllable conditions before the experiment, controllable conditions during the experiment, errors before the experiment, and errors during the experiment. After assigning importance ratings to these factors, questionnaires are distributed to laboratory researchers, physicians, and other professionals, so as to gather their opinions on the various sub-categories within each major group. By combining the opinions obtained through the questionnaire with AHP, we derive the importance weightings of the top 16 factors that could potentially interfere with the experimental results, and all weightings are below 0.06. Based on this analysis, four imaging bands suitable for endoscopic environments are selected: absolute difference, relative value, absolute value, contrast, and disturbance resistance. With the blue and green light bands primarily used to measure changes in light source power and consider imaging contrast and the red light band primarily used to measure changes in blood oxygen saturation and highly influenced by interfering factors, these four optimal imaging bands are utilized for experimental verification of blood oxygen saturation detection.
When the optimal bands were selected, in response to the complexity of multi-spectral blood oxygen saturation detection in an endoscopic environment, AHP is employed to comprehensively analyze various factors that could potentially interfere with the results. The weights of indicators representing the level of resistance to external interference in an endoscopic environment are obtained through this analysis (Fig. 3). Considering the impact of each influencing factor, we conduct an optimal analysis of the blood oxygen saturation detection bands by combining the characteristics of contrast and backscattering power. The potential effects of various influencing factors on endoscopic blood oxygen detection results are determined (Fig. 4). Based on this analysis, four imaging bands suitable for endoscopic environments are selected, namely, 450 nm, 525 nm, 630 nm, and 660 nm (Fig. 5). Built upon these selected wavelengths, a blood oxygen saturation prediction model is established by defining an intermediate variable based on the difference ratio of two backscattering powers. The model considers both fixed endoscopic detection distances and arbitrary intervals. The accuracy and effectiveness of the model are validated through experiments. The results indicate that under equidistant conditions, the deviation of blood oxygen saturation is 0.77% at a confidence level of 95% and 1.01% at a confidence level of 99%. Under non-equidistant conditions, the deviation of blood oxygen saturation is 0.94% at a confidence level of 95% and 1.24% at a confidence level of 99% (Fig. 9).
We investigate the diffuse reflectance power and contrast of different bands of visible light under different blood oxygen saturation conditions in an endoscopic environment using the Monte Carlo simulation algorithm. Additionally, we examine 16 influencing factors that may affect blood oxygen saturation detection in an endoscopic environment and combine AHP to determine the resistance to interference of various bands under red light. Based on the characteristics of the red, green, and blue bands, a comprehensive analysis combining contrast, resistance to interference, absolute value of power detection, absolute difference, and relative value is conducted to select the optimal bands, namely 450 nm, 525 nm, 630 nm, and 660 nm. Moreover, based on these selected bands, blood oxygen saturation analysis formulas are proposed for both equidistant and non-equidistant states, utilizing a quadratic cubic expression. These formulas have the advantages of simplicity in structure and quick calculation. Furthermore, laboratory experiments are conducted on vascular phantoms using an endoscope to verify the feasibility and scientific validity of the simulation experiments and the selected band method. Finally, we compare the four-band selection method with the three-band selection method, the non-equidistant band method, and the blood oxygen reverse construction method, demonstrating the advantages of the four-band selection method in terms of the accuracy and cost of blood oxygen saturation detection.
1 引言
在人体循环系统中,静脉血的氧饱和度约为75%,动脉血的氧饱和度通常超过95%。当动脉血的氧饱和度水平骤降至90%以下时,会出现低氧血症;当动脉血的氧饱和度下降至70%以下时,人体就会出现严重的缺氧,会引发严重的并发症[1],甚至可能有生命危险。因此,及时检测和监测血氧饱和度有着重要的意义。
目前检测血氧的方法中:血气分析仪利用穿刺皮肤获取血液,利用电化学或光学原理测量血液中的氧气分压,虽然精确度较高,但实时性和无创性得不到保证[2];透射式血氧饱和度检测技术利用红光与红外光的组合,通过分光光度法[3]估测动脉血的氧饱和度,虽然这种方法具有无创性、实时性、便携性等优点,但不适用于内窥镜与静脉中;反射式血氧饱和度检测技术可以通过红外光[4]或激光[5]的后向散射探测功率动态估测出局部组织或静脉中的血氧饱和度,为疾病诊断提供参考,这种方法可以实现对内窥镜或静脉[6]中的血氧检测,且不易受组织厚度、皮肤色素[7]等因素的影响,但在精度和稳定性方面还有待进一步提升。作为目前唯一一台已经集成血氧检测应用的商用内窥镜,ELUXEO 7000X是一款由日本富士公司开发的内窥成像系统[8],其在使用蓝激光成像(BLI)技术通过蓝光清晰观察黏膜表层微小血管[9]的基础上,使用内镜联动成像(LCI)技术并通过光谱滤镜和信号处理算法来增强显示图像红色区域中轻微色差[10],实现对组织中血红蛋白氧饱和度(
本文在采用蒙特卡罗模拟技术对血管组织在可见光波段的多光谱成像进行建模仿真的基础上,通过计算不同血氧饱和度情况下血液后向散射功率的绝对值、相对值、绝对差值和对比度,结合各波段抗干扰的能力来优选成像波段,并分别通过实验对其可行性和有效性进行综合验证与评估。
2 血氧饱和度检测的波段优选
2.1 组织成像的蒙特卡罗仿真
在生物组织中,不同波长的光经过组织后偏折或吸收程度不一,而蒙特卡罗方法是一种处理各向异性散射的成熟方法,其仿真结果与实验数据有极好的一致性。在此过程中,组织内的光子传输过程分解为光子初始化、光子运动的随机生成、光子吸收和散射,以及光子终止等阶段[11]。
在仿真实验中,采用多层介质蒙特卡罗(MCML)模拟方法[12]中的基于网格的蒙特卡罗方法模拟光在层状混浊介质中的传输。为了模拟类似管状血管的结构,选用基于网格的蒙特卡罗模拟方法[13],该方法使用三维网格结构来实现不同折射率边界之间的折射和反射。为了在贴近实际应用场景的同时,尽可能探索更多情况[14],初始设定的数字模型由均匀的软体组织块(肠黏膜上层)和5根平行的均匀血管组成,如

图 1. 血管组织仿体的多光谱蒙特卡罗仿真模型
Fig. 1. Multispectral Monte Carlo simulation model of vascular tissue mimics
在模型仿真过程中,采用蒙特卡罗仿真方法模拟光子的随机散射或反射,通过CMOS探测器获取模型的后向散射功率与光强分布,

图 2. 蒙特卡罗仿真结果。(a)不同血氧饱和度下后向散射光谱;(b)血液与组织对比度光谱
Fig. 2. Monte Carlo simulation results. (a) Backscattering spectra at each blood oxygen saturation; (b) blood-tissue contrast spectra
从
2.2 干扰因素对血氧饱和度检测的影响
在内窥镜实际操作中,许多因素会对血氧饱和度测量结果产生影响,为了选出受误差和实验条件影响较小的波段,通过向实验室研究人员、医师等从业者进行问卷调查,并结合层次分析法(AHP)的形式,得出对实验结果可能造成干扰的前16个因素及其对应的重要性权重值,如

图 4. 各影响因素的扰动离差值。(a)误差;(b)可控条件和可控条件加权后的综合得分
Fig. 4. Disturbance deviation fraction of various influencing factors. (a) Error; (b) controllable conditions and weighted composite score
2.3 优选波长分析
为了能以较低的成本测量血氧饱和度,同时能够尽可能地减小各类影响因素波动带来的影响,从蓝、绿光波段中分别选择1个波长并从红光波段中选择2个波长来对血氧饱和度的多光谱成像进行检测。
根据仿真实验的条件与结果,最终选取抗扰动值[
式中:
蓝、绿光波段主要用于衡量光源功率变化,且需要考虑成像对比度,在此选取绝对差值、相对值、绝对值和对比度4个指标,按0.4∶0.1∶0.1∶0.4赋值并相乘后可得最终得分,如

图 5. RGB光各波段的最终得分。(a)蓝绿光;(b)红光
Fig. 5. Final score for each wavelength of RGB light. (a) Blue and green light; (b) red light
红光波段主要衡量血氧饱和度变化,受干扰因素影响大,也需要考虑成像对比度,因此选取抗扰动值、相对值、绝对差值和对比度这4个指标,按照0.4∶0.4∶0.1∶0.1赋值并相乘后得到最终得分,如
3 实验结果与分析
3.1 血氧饱和度的计算思路
选出4个波段后,根据优选出的成像波段探测结果可以构建模型,从而求得血氧饱和度。
式中:M和N分别为功率差值比参量;
随着血氧饱和度的增加,M与N增大。为了通过中间变量更加简单便捷地进行血氧计算,同时尽可能排除内窥镜与组织血管探测间距带来的干扰,分别探究内窥镜在保持探测间距不变与变化情况下的血氧饱和度计算公式。
在探测间距不变的等距血氧饱和度计算公式时,将M、N作为自变量,将实际血氧饱和度
式中:A3、A2、A1、B3、B2、B1、C均为待拟合确定的常数。在内窥镜不同工作距离下,拟合结果有差异,若对每一可能在实际中使用的探测距离进行拟合,则成本过高。因此,在等距血氧饱和度计算公式的基础上,将修正前的血氧饱和度
式中:
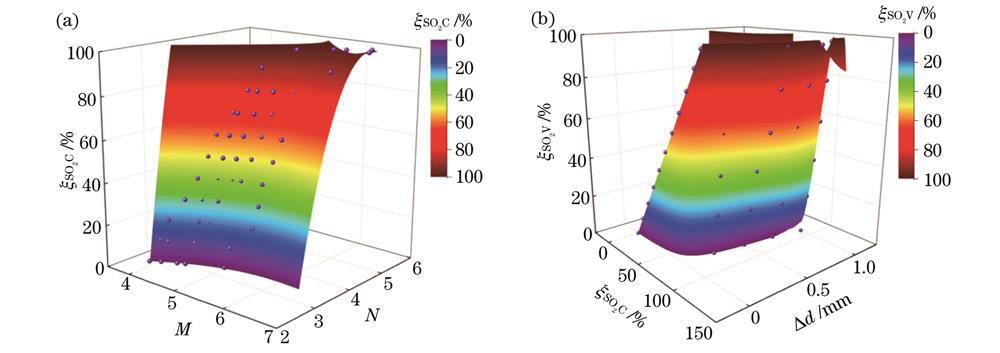
图 6. 仿真中的血氧分析结果。(a)等距状态下;(b)非等距状态下
Fig. 6. Blood oxygen analysis results in simulation. (a) In equidistant state; (b) in non-equidistant state
3.2 血氧饱和度检测实验及分析
实验室所用的内窥镜是高倍率大视场细胞内镜,变焦系统由负组、调焦组和正组组成,总长为7.8 mm。该内窥镜配备有常规成像模式和放大成像模式。当使用常规成像模式时,内窥镜提供清晰的、非扩大的图像;当使用放大成像模式时,可以实现近距离成像。通过切换模式,内窥镜可以在2~100 mm范围内实现连续变焦[17]。
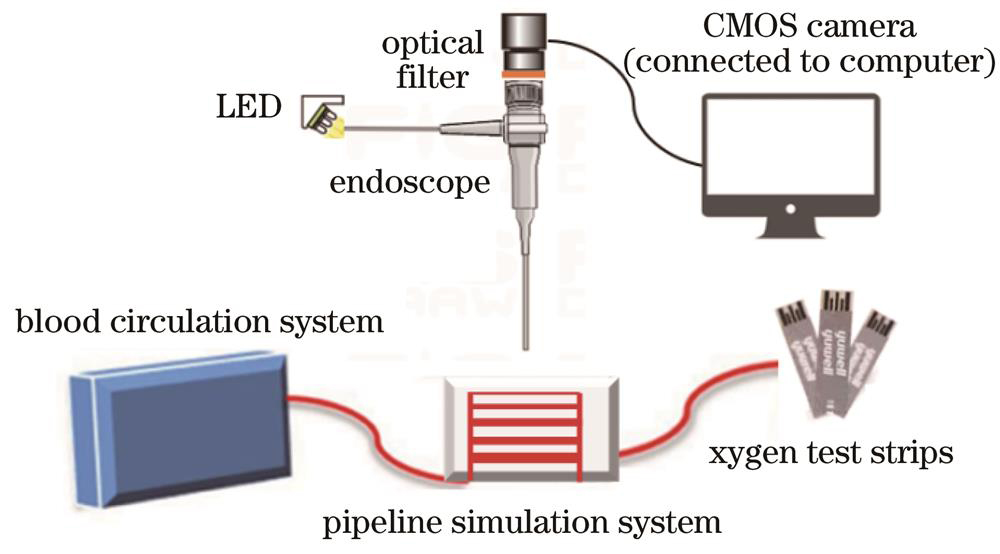
本实验使用的便携式管道仿体系统由3D打印技术制备的带血管状管道的聚二甲基硅氧烷(PDMS)以及连接在其上的液体循环装置组成。血管状管道由5根平行管道组成,其直径分别为1、2、3、4、5 mm,血管中心轴间距为10 mm。实验装置示意图如
在本次实验过程中,使用气体流量计泵入氧气,使牛血达到预期的血氧饱和度,在内窥镜CMOS拍摄图像转为灰度图像后,使用血氧检测试纸(G3+测试卡)进行血氧饱和度真值检测。
实验中检测到的仿体多光谱图像如
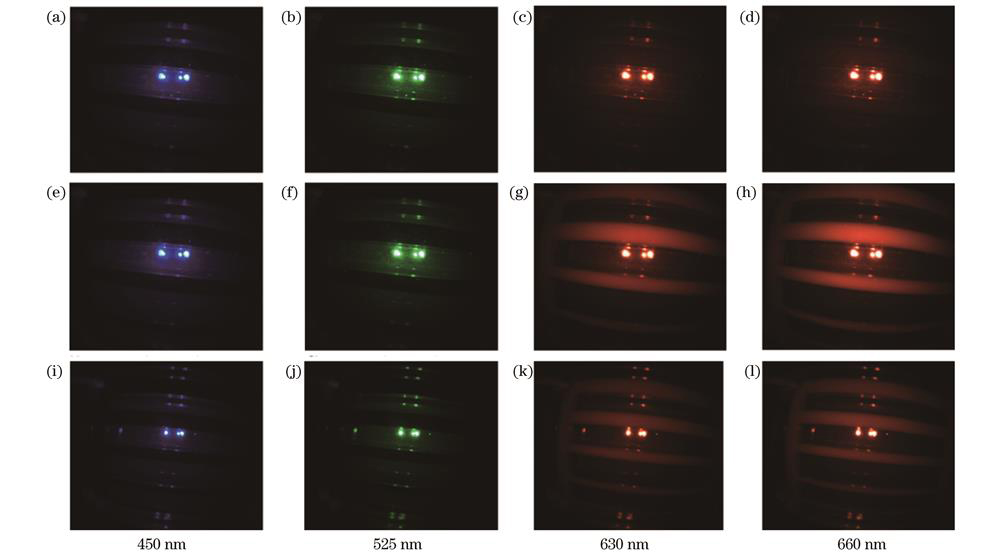
图 8. 实验室内窥镜拍摄的450 nm、525 nm、630 nm、660 nm仿体多光谱图像。(a)~(d)d=2 cm,
Fig. 8. Multispectral images of phantom at four wavelengths of 450 nm, 525 nm, 630 nm, and 660 nm captured by laboratory endoscope. (a)-(d) d=2 cm,
通过分析划定的血管区域,可以拟合出在固定探测距离为2 cm时的定距血氧分析公式,在此基础上,选取0.6~4.6 cm探测距离内的一系列间距计算出非等距血氧分析公式:
如

图 9. 血氧饱和度计算公式准确性分析。(a)等距状态下;(b)非等距状态下
Fig. 9. Analysis of accuracy of blood oxygen saturation calculation formula. (a) In equidistant state; (b) in non-equidistant state
为了进一步分析所推导公式的准确性,将四波段计算的结果与3种其他方法的结果进行比较,这3种方法为仅保留三波段分析法(450 nm、525 nm和630 nm)、非等间隔波段法[18](544 nm、568 nm和620 nm)以及血氧反构法[19](544 nm、552 nm、568 nm、576 nm、592 nm和600 nm)。这些方法在血氧饱和度为80%的条件下,面对不同种类的影响因素干扰时,在99%置信水平下的血氧饱和度偏差如

图 10. 99%置信水平下不同方法的血氧饱和度偏差
Fig. 10. Deviation of blood oxygen saturation of different methods at 99% confidence level
4 结论
首先,通过蒙特卡罗仿真算法探究内窥环境下可见光各个波段在不同血氧饱和度情况下的漫反射功率与对比度。同时,通过研究16类影响因素,结合层次分析法得出红光下各波段的抗干扰程度情况。然后,根据红绿蓝波段特点,通过结合对比度、抗干扰程度、功率探测的绝对值、绝对差值和相对值的综合分析,选出450 nm、525 nm、630 nm和660 nm波段。在此基础上,通过优选出的4个波段,提出等距与非等距状态下的血氧饱和度分析公式,二者均采用二元三次方程的表达形式。最后,使用实验室内窥镜对血管仿体进行实验,验证了所提四波段方法的可行性与科学性。
[1] Basiri A, Nabili M, Mathews S, et al. Use of a multi-spectral camera in the characterization of skin wounds[J]. Optics Express, 2010, 18(4): 3244-3257.
[2] Kuster N, Bargnoux A S, Badiou S, et al. Multilevel qualification of a large set of blood gas analyzers: which performance goals?[J]. Clinical Biochemistry, 2019, 74: 47-53.
[3] Wim V, Marek B, Erik B, et al. Calibration of contactless pulse oximetry[J]. Anesthesia and Analgesia, 2017, 124(1): 136-145.
[4] Zhang K, Ling W J. Health monitoring of human multiple physiological parameters based on wireless remote medical system[J]. IEEE Access, 2020, 8: 71146-71159.
[5] 付武兵, 梁贻智, 仲晓轩, 等. 光纤光声血氧饱和度测量与功能成像[J]. 光学学报, 2022, 42(20): 2017001.
[6] 孙彤, 黄国家, 张振辉. 基于高分辨光声显微成像的肝癌微血管特征分析[J]. 中国激光, 2023, 50(15): 1507105.
[7] 曲颖洁, 常淑芳, 徐晓嵘. 高光谱诊断外阴硬化萎缩性苔藓的初步探究[J]. 激光与光电子学进展, 2022, 59(6): 0617027.
[8] Houwen Britt B S L, Vleugels Jasper L A, Maria P, et al. Real-time diagnostic accuracy of blue light imaging, linked color imaging and white-light endoscopy for colorectal polyp characterization[J]. Endoscopy International Open, 2022, 10(1): EE9-E18.
[9] Yoshida N, Dohi O, Inoue K, et al. Blue laser imaging, blue light imaging, and linked color imaging for the detection and characterization of colorectal tumors[J]. Gut and Liver, 2019, 13(2): 140-148.
[10] Uchiyama K, Takagi T, Kashiwagi S, et al. Assessment of endoscopic mucosal healing of ulcerative colitis using linked colour imaging, a novel endoscopic enhancement system[J]. Journal of Crohn′s and Colitis, 2017, 11(8): 963-969.
[11] Torres-García E, Oros-Pantoja R, Aranda-Lara L, et al. A new Monte Carlo code for light transport in biological tissue[J]. Medical & Biological Engineering & Computing, 2018, 56(4): 649-655.
[12] Wang L H, Jacques S L, Zheng L Q. MCML: Monte Carlo modeling of light transport in multi-layered tissues[J]. Computer Methods and Programs in Biomedicine, 1995, 47(2): 131-146.
[13] Fang Q Q. Mesh-based Monte Carlo method using fast ray-tracing in Plücker coordinates[J]. Biomedical Optics Express, 2010, 1(1): 165-175.
[14] Jones G, Clancy N T, Helo Y, et al. Bayesian estimation of intrinsic tissue oxygenation and perfusion from RGB images[J]. IEEE Transactions on Medical Imaging, 2017, 36(7): 1491-1501.
[15] Bhalerao M V, Sumathi M, Sonavane S S. Line of sight model for visible light communication using Lambertian radiation pattern of LED[J]. International Journal of Communication Systems, 2017, 30(11): e3250.
[16] Liu J J, Bai Y F, Huang X W, et al. Research on multipath correlated imaging with the grayscale target in endoscopic applications[J]. Applied Sciences, 2021, 11(9): 4115.
[17] 张伟, 牛春阳, 游兴海, 等. 高倍率大视场细胞内镜成像系统研究[J]. 光学学报, 2021, 41(17): 1717001.
[18] Stefánsson E, Olafsdottir O B, Eliasdottir T S, et al. Retinal oximetry: metabolic imaging for diseases of the retina and brain[J]. Progress in Retinal and Eye Research, 2019, 70: 1-22.
[19] Huang J W, Zhang S W, Gnyawali S, et al. Second derivative multispectral algorithm for quantitative assessment of cutaneous tissue oxygenation[J]. Journal of Biomedical Optics, 2015, 20(3): 036001.
Article Outline
章昶威, 邹鸿博, 齐伟明, 朱文武, 王立强, 袁波. 内窥环境下多光谱血氧饱和度检测[J]. 光学学报, 2024, 44(2): 0217001. Changwei Zhang, Hongbo Zou, Weiming Qi, Wenwu Zhu, Liqiang Wang, Bo Yuan. Multi-Spectral Blood Oxygen Saturation Detection in Endoscopic Environment[J]. Acta Optica Sinica, 2024, 44(2): 0217001.
